Long
Long
Life Insurance Corp. of India
No trades
No trades
In-depth trading ideas
Long
LIC — Major Weekly Trendline Breakdown🔻 LIC — Bearish Breakdown on Weekly Timeframe
LIC is showing a significant bearish technical development on the weekly chart, with price breaking below a multi-year rising trendline.
The breakdown is accompanied by a sharp increase in volume, adding credibility to the bearish structure and suggesting a potential shift in medium-term momentum.
The stock has also failed to sustain above the ₹450 resistance zone, which has acted as a major supply area over multiple attempts.
Key Levels to Watch
Short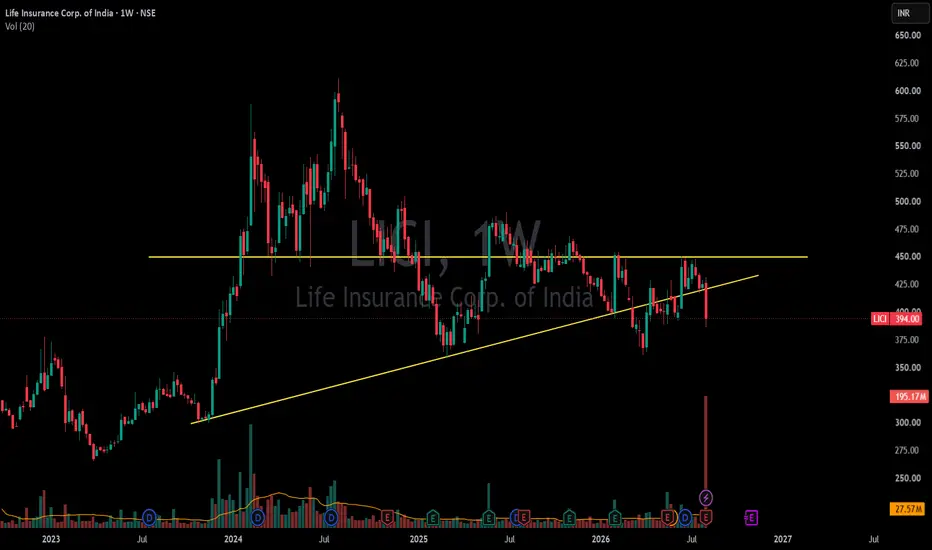
LIC Housing? (LICI) – Weekly Chart Analysis⚠️ The stock remains in a long-term downtrend, although the major falling trendline has been broken earlier.
📉 The recent rejection near ₹430–440 shows sellers are still active, and the latest bearish candle weakens the short-term structure.
🛡️ Strong Support: ₹360–370 (critical). A weekly close below this zone can drag the stock towards ₹330–340.
🚧 Resistance: ₹430–440, followed by ₹480.
🚀 Breakout Trigger: A weekly close above ₹440 would confirm a trend reversal and could open the path towards

TEDS Swing Trading Analysis | LICI 1H Short Setup | 15 July 26TEDS Swing Trading Analysis | Patience Is Part of the Strategy
Many traders focus only on the signal, but disciplined trading begins before the signal appears.
The TEDS (Trend Exhaustion Detection System) is designed to encourage traders to wait for confirmation instead of reacting to every market movement.
Chart Observation
🔹 During the recent price movement, the framework first entered a Wait Phase, indicating that the market had not yet met all the conditions required for a structured tra
Short
Swing Trade Idea: LICIBias: Bullish
Timeframe: Daily (Swing Trade)
🎯 Trade Plan
Entry: ₹ Buy Above 446
Stop Loss: ₹427
Target 1: ₹460
Target 2: ₹490
Risk : Reward: 1:2
Disclaimer: This analysis is for educational purposes only and is not financial advice. Please do your own research before investing.
Long
Long LICIIt seems after breakout and crossing the downward sloping trendline, LICI is under consolidation mode. We can buy it @ current levels with SL of 420 & Tgt of 470
Long
$lifeinsurancecorp580 incoming
breakout likely
pretty straightforward just scanning stuff for now
added to sonata software and waiting for jiof to launch
Long
LICI: Double Bottom + Mirror Image Pattern – Big Move LoadingThe stock has formed a strong Mirror Image Pattern along with a Double Bottom formation, indicating a potential trend reversal after a prolonged correction phase.
The support zone around 340–350 has been tested multiple times and has shown strong buying interest, strengthening the bullish structure.
A sustained move above the key resistance zone of 480–500 would confirm the pattern and could trigger a significant upside move towards 700 and higher levels.
Bullish view remains intact as long
Long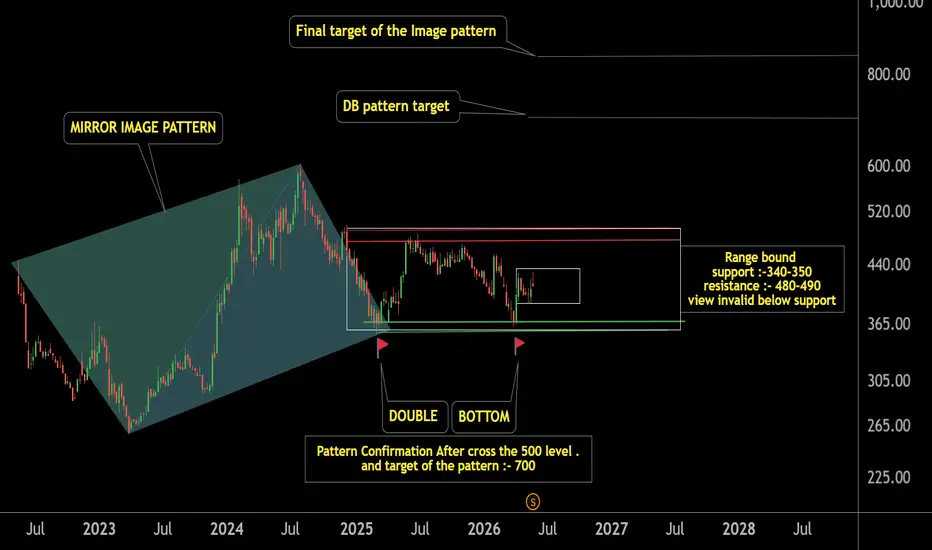
LIC India | Record Profits, But the Chart Still Hasn't Agreed📊 LIC India | Record Profits, But the Chart Still Hasn't Agreed — Here's Why That's Normal
Timeframe: Daily | Exchange: NSE
LIC just posted its best ever annual profit. Yet the stock is still 35% below its all-time high.
That gap between fundamentals and price is exactly what makes this chart worth studying.
━━━
💰 Q4 FY26 Results Snapshot
━━━
• Net Profit (Q4): ₹23,420 Cr ↑ 23% YoY
• Full Year PAT: ₹57,419 Cr ↑ 19.25% YoY (record high)
• Net Premium Income: ₹1.65 lakh Cr ↑ 11.6% YoY
• Investme

LICI - Technical Outlook (Probabilistic View)It is clear from the chart that
1. if the price breaks out and sustains may push the price to higher levels.
2. if price takes resistance may push the price to support level.
Long
LIC (Life Insurance Corp. of India) – Counter trend idea Market Context Recap:
LIC price has been in a corrective phase after rejecting major supply regions shown around ₹900–₹1,040.It is now approaching a deeper discount area, overlapping with a Monthly Bullish FVG and deeper Fibonacci retracements.
2. Key Levels Identified on the Chart
🔴 Major Supply (Resistance Cluster): ₹900–₹1,040
Multiple bearish OBs and imbalances overlap. Acts as a ceiling where selling historically re-entered.
🟩 Monthly Bullish FVG (Demand Cluster): ₹740–₹720
Deep discoun
Long
Life Insurance Corporation of India (LIC) – Weekly Chart Analysi
Short-Term (Swing / Trading View):
Price is trading near ₹825–850, a crucial support and demand zone.
Formation of a short-term rising base after a prolonged decline suggests stabilisation.
Upside levels:
₹870–900 (immediate resistance)
₹960–1,000 (major supply zone)
Downside risk: Weekly close below ₹800 can drag price toward ₹780 → ₹680.
Bias: Neutral to mildly positive as long as ₹800 holds.
Long-Term (Positional / Investment View):
Broader structure remains corrective / consolidatio

LIC (Life Insurance Corporation of India) =Bearish wayLIC (Life Insurance Corporation of India) –
Brief Technical Analysis (Weekly)
Trend: Stock is in a broad consolidation after a sharp decline from highs, forming a descending resistance with a rising support (compression structure).
Current Zone: Price is hovering near ₹825–850, which is an important demand and decision area.
Supports:
Immediate: ₹825–810
Strong base: ₹780–790
Resistances:
Near-term: ₹870–900
Major: ₹960–1,000
Outlook:
Above ₹870: Short-term strength can extend toward

Life Insurance Corporation of India Limited for 9th Dec #LICI Life Insurance Corporation of India Limited for 9th Dec #LICI
Resistance 865 Watching above 866 for upside momentum.
Support area 850 Below 860 gnoring upside momentum for intraday
Watching below 848 for downside movement...
Above 860 ignoring downside move for intraday
Charts for Educational purposes only.
Please follow strict stop loss and risk reward if you follow the level.
Thanks,
V Trade Point
Long
life Insurance Corporation of India Ltd for 12th Nov #LICI life Insurance Corporation of India Ltd for 12th Nov #LICI
Resistance 901-905 Watching above 906 for upside momentum.
Support area 890 Below 895 gnoring upside momentum for intraday
Watching below 889 for downside movement...
Above 895 ignoring downside move for intraday
Charts for Educational purposes only.
Please follow strict stop loss and risk reward if you follow the level.
Thanks,
V Trade Point
Long
LICI (NSE: LICI) – Strong Earnings Surprise & Key Levels AheadTechnical Outlook (Daily)
Current Price: ₹924.15
Support Zones:
🟩 ₹890 – ₹875 (strong demand zone)
🟩 ₹850 (swing low support)
Resistance Zones:
🟥 ₹950 – ₹965 (immediate supply zone)
🏦 LICI (NSE: LICI) – Strong Earnings Surprise & Key Levels Ahead
Earnings Snapshot (Q2 FY25)
📅 Reported on: Nov 6, 2025
Earnings per share (EPS): ₹15.97
Estimate: ₹12.98
Surprise: +₹2.99 (+23.04%)
Revenue Estimate: ₹1.27T
LICI delivered a strong earnings beat, signaling solid operational performance and imp
Long
LICI - Are you ready to capture this moveStrong Price action with positive action on Technical indicators SL - 890 Target -1000 (only for educational purpose)
After a meaningful correction - next level of move has started
Long
LICIHi
Price traded near 200 EMA SO POSSIBLE that price will be moves upper side. Let's see what happens...
This idea is for Educational purpose and paper trading only. Please consult your financial advisor before investing or making any position. Facts or Data given above may be slightly incorrect. We are not SEBI registered
Long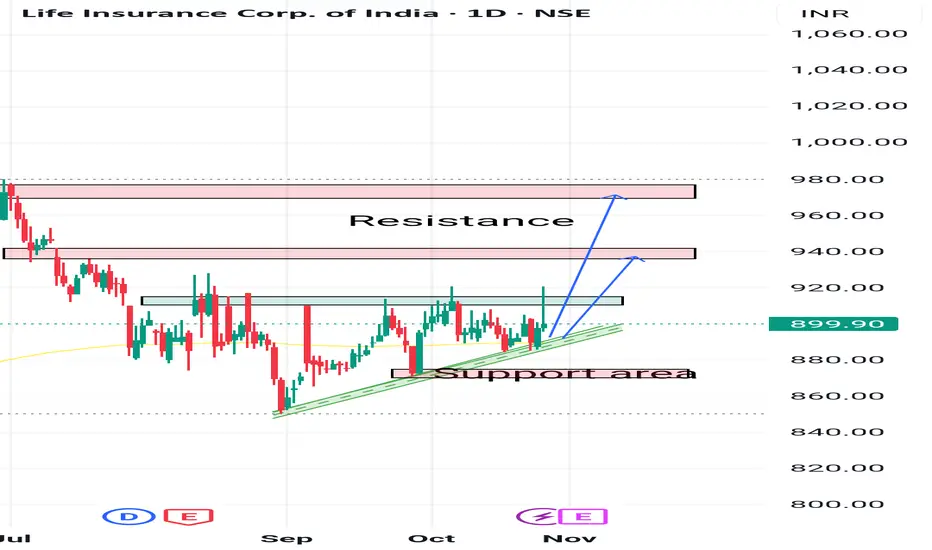
Life Insurance Corporation of India Ltd for 14th Oct #LICI Life Insurance Corporation of India Ltd for 14th Oct #LICI
Resistance 900-902 Watching above 903 for upside momentum.
Support area 890 Below 890 gnoring upside momentum for intraday
Watching below 888 for downside movement...
Above 900 ignoring downside move for intraday
Charts for Educational purposes only.
Please follow strict stop loss and risk reward if you follow the level.
Thanks,
V Trade Point
Long
Life Insurance Corporation of India Ltd for 13th Oct #LICI Life Insurance Corporation of India Ltd for 13th Oct #LICI
Resistance 900-902 Watching above 903 for upside momentum.
Support area 890 Below 890 gnoring upside momentum for intraday
Watching below 888 for downside movement...
Above 900 ignoring downside move for intraday
Charts for Educational purposes only.
Please follow strict stop loss and risk reward if you follow the level.
Thanks,
V Trade Point
Long
Life Insurance Corporation of India Ltd for 10th Oct #LICI Life Insurance Corporation of India Ltd for 10th Oct #LICI
Resistance 900-902 Watching above 903 for upside momentum.
Support area 890 Below 890 gnoring upside momentum for intraday
Watching below 888 for downside movement...
Above 900 ignoring downside move for intraday
Charts for Educational purposes only.
Please follow strict stop loss and risk reward if you follow the level.
Thanks,
V Trade Point
Long
Life Insurance Corporation of India Ltd for 8th Oct #LICI Life Insurance Corporation of India Ltd for 8th Oct #LICI
Resistance 920 Watching above 922 for upside momentum.
Support area 900 Below 910 gnoring upside momentum for intraday
Watching below 898 for downside movement...
Above 910 gnoring downside move for intraday
Charts for Educational purposes only.
Please follow strict stop loss and risk reward if you follow the level.
Thanks,
V Trade Point
Long
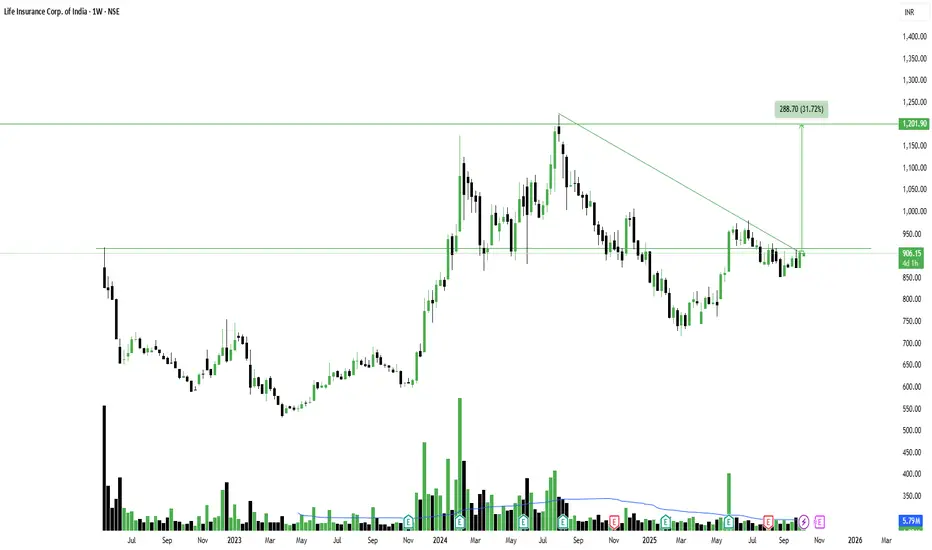
LICI - Weekly Chart Trendline BreakoutBreakout from Falling Trendline on Weekly Chart in LIC India
NSE:LICI
📈Pattern & Setup:
Life Insurance Corporation of India (LIC) is showing a potential breakout from a long-term falling trendline on the weekly chart. The stock has been consolidating just below the 900–920 zone, which has acted as a key resistance area multiple times in the past.
The current structure indicates that bulls are gradually gaining control, with price attempting to sustain above the trendline. Volume has star
Long