stop loss only 1.62 %* **Draw Line:** Connect 3+ swing points.
* **Breakout Close:** Wait for candle body to close past line.
* **Volume Spike:** Check for high volume on breakout candle.
* **Retest Entry:** Buy/sell when price retests the broken line.
* **SL & Target:** SL below recent swing, Target 1:2 Risk/Reward.
Compare with Larsen & Toubro Limited
152.10 INR
160.84 B INR
2.86 T INR
1.17 B
Next report date
—
Report period
—
EPS estimate
—
Revenue estimate
—
Company info
Sector
Industry
CEO
Sekharipuram Narayan Subrahmanyan
Website
Headquarters
Mumbai
Founded
1938
IPO date
Nov 3, 1994
ISIN
INE018A01030
FIGI
BBG000CVM8K3
Identifiers
ISIN INE018A01030
Larsen & Toubro Ltd. is an investment holding company, which engages in technology, engineering, construction, manufacturing, and financial activities. It operates through the following segments: Infrastructure Projects, Energy Projects, Hi-Tech Manufacturing, and Others. The Infrastructure Projects segment refers to the engineering and construction of building and factories, transportation infrastructure, heavy civil infrastructure, power transmission and distribution, renewables, water and effluent treatment, and minerals and metals. The Energy Projects segment focuses on hydrocarbon onshore and offshore businesses. The Hi-Tech Manufacturing segment includes the design, manufacture and construct, supply, and revamp or retrofit of custom designed, engineered critical equipment, and systems to the process of plant and nuclear energy. The Others segment relates to realty, smart infrastructure and communication projects, and construction equipment and industrial product design development. The company was founded by Henning Holck-Larsen and Soren Kristian Toubro in 1938 and is headquartered in Mumbai, India.
LT
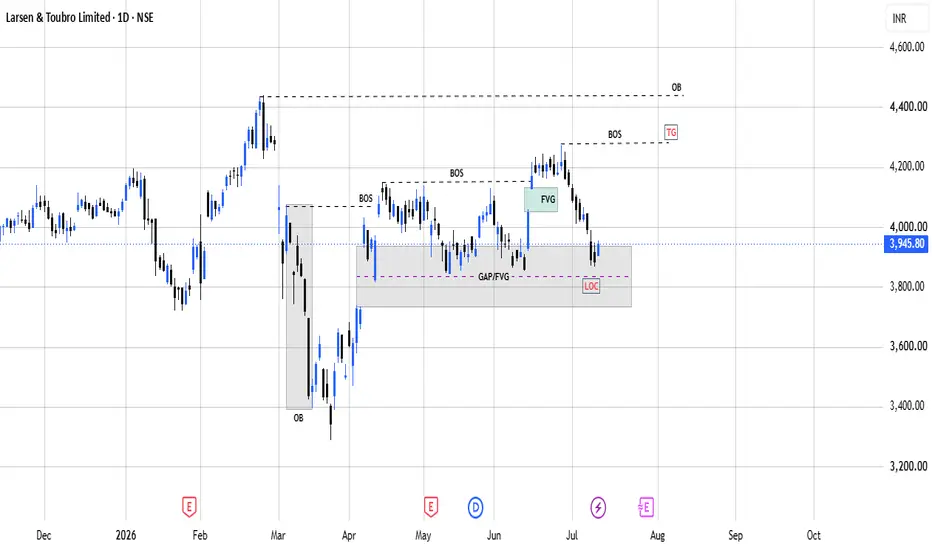
LT stock has successfully bounced from a strong demand zone, indicating renewed buying interest. Price is now trading above the base and showing signs of a trend reversal.
✅ My View:
The ₹3,860 demand zone can be considered as the buy-on-retest area.
As long as price holds above this zone, the bu
Larsen & Toubro (L&T)Larsen & Toubro (L&T) is currently trading at ₹3,945.80. Despite recent downward pressure resulting in a weekly loss of approximately 4.70%, the stock maintains a positive consensus outlook among market analysts, with an average target price significantly higher than the current market level.
Techn
LT Swing Short Setup | Pullback Sell Opportunity with 1:2 Risk-This chart shows a bearish swing setup in LT (Larsen & Toubro) after a strong downward move.
The idea is based on selling near a pullback/retest zone with a defined stop loss and favorable reward potential.
Trade Idea
Instrument: LT
Bias: Bearish / Short setup
Entry Zone: Around 3920–3940
Stop
LT | V-Shaped Recovery — Eyes on the Liquidity Above📊 Daily Timeframe
On the Daily, #LT (Larsen & Toubro Ltd.) is in a clear uptrend. After making highs, price pulled back into a deep correction — tapping all the way down into the Flip Zone ( ₹3,280.90 – ₹3,374.40 ) and holding firmly above its Protected Low at ₹2,962.50 .
From there, buyers stepp
L & T - DAILY CHART. L & T Daily chart, massive gap up to symmetry cluster zone, if there is any reaction back down to support around support back down break out balance area, it would provide favorable low risk idea as opposed to major gap up to immediate resistance area goes into watch list to keep an eye on it.
See all ideas
Summarizing what the indicators are suggesting.
Neutral
Neutral
Neutral
An aggregate view of professional's ratings.
Neutral
Neutral
Neutral
Displays a symbol's price movements over previous years to identify recurring trends.
Frequently asked questions
The current price of LT is 3,879.00 INR — it has increased by 0.88% in the past 24 hours. Watch Larsen & Toubro Limited stock price performance more closely on the chart.
Depending on the exchange, the stock ticker may vary. For instance, on BSE exchange Larsen & Toubro Limited stocks are traded under the ticker LT.
LT stock has risen by 0.78% compared to the previous week, the month change is a −5.83% fall, over the last year Larsen & Toubro Limited has showed a 5.38% increase.
We've gathered analysts' opinions on Larsen & Toubro Limited future price: according to them, LT price has a max estimate of 5,060.00 INR and a min estimate of 3,550.00 INR. Watch LT chart and read a more detailed Larsen & Toubro Limited stock forecast: see what analysts think of Larsen & Toubro Limited and suggest that you do with its stocks.
LT stock is 1.10% volatile and has beta coefficient of 1.40. Track Larsen & Toubro Limited stock price on the chart and check out the list of the most volatile stocks — is Larsen & Toubro Limited there?
Today Larsen & Toubro Limited has the market capitalization of 5.34 T, it has increased by 0.26% over the last week.
Yes, you can track Larsen & Toubro Limited financials in yearly and quarterly reports right on TradingView.
Larsen & Toubro Limited is going to release the next earnings report on Nov 4, 2026. Keep track of upcoming events with our Earnings Calendar.
LT earnings for the last quarter are 29.96 INR per share, whereas the estimation was 27.48 INR resulting in a 9.04% surprise. The estimated earnings for the next quarter are 33.41 INR per share. See more details about Larsen & Toubro Limited earnings.
Larsen & Toubro Limited revenue for the last quarter amounts to 679.42 B INR, despite the estimated figure of 671.68 B INR. In the next quarter, revenue is expected to reach 745.16 B INR.
LT net income for the last quarter is 41.23 B INR, while the quarter before that showed 53.26 B INR of net income which accounts for 0.00% change. Track more Larsen & Toubro Limited financial stats to get the full picture.
Yes, LT dividends are paid annually. The last dividend per share was 38.00 INR. As of today, Dividend Yield (TTM)% is 0.98%. Tracking Larsen & Toubro Limited dividends might help you take more informed decisions.
Larsen & Toubro Limited dividend yield was 1.08% in 2025, and payout ratio reached 27.80%. The year before the numbers were 0.97% and 26.68% correspondingly. See high-dividend stocks and find more opportunities for your portfolio.
As of Sep 26, 2026, the company has 437.44 K employees. See our rating of the largest employees — is Larsen & Toubro Limited on this list?
EBITDA measures a company's operating performance, its growth signifies an improvement in the efficiency of a company. Larsen & Toubro Limited EBITDA is 289.50 B INR, and current EBITDA margin is 12.65%. See more stats in Larsen & Toubro Limited financial statements.
Like other stocks, LT shares are traded on stock exchanges, e.g. Nasdaq, Nyse, Euronext, and the easiest way to buy them is through an online stock broker. To do this, you need to open an account and follow a broker's procedures, then start trading. You can trade Larsen & Toubro Limited stock right from TradingView charts — choose your broker and connect to your account.
Investing in stocks requires a comprehensive research: you should carefully study all the available data, e.g. company's financials, related news, and its technical analysis. So Larsen & Toubro Limited technincal analysis shows the sell today, and its 1 week rating is sell. Since market conditions are prone to changes, it's worth looking a bit further into the future — according to the 1 month rating Larsen & Toubro Limited stock shows the buy signal. See more of Larsen & Toubro Limited technicals for a more comprehensive analysis.