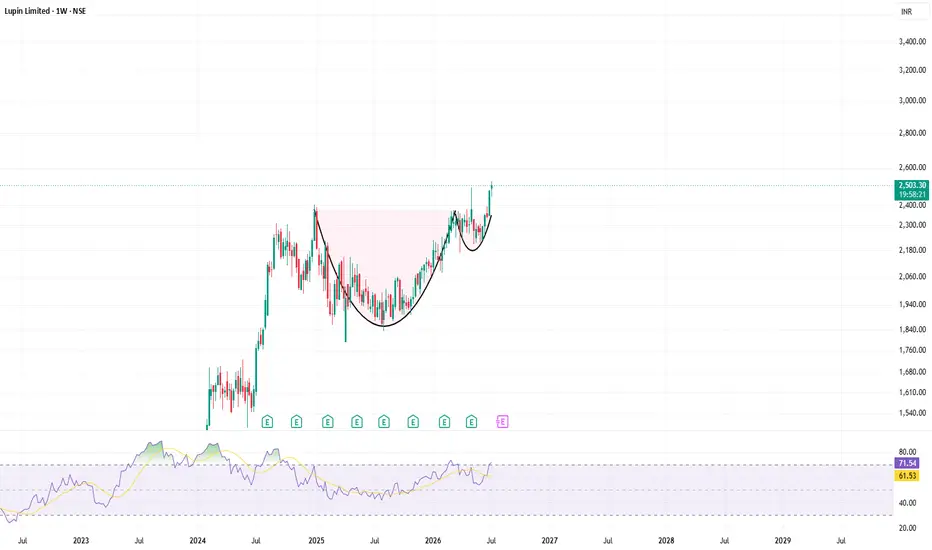
Lupin Pharma - Bullish over 2520If you look at the results QoQ and YoY, Lupin is doing well with a healthy set of numbers.
If you look at the slightly inclined cup with handle, above 2520, there will be confidence that the stock is breaking out of this inclined trendline resistance and once it goes on.. this will be one stock to keep holding till it is 3x from here.. so about 7500 should be the target in about 3 years.
Lupin Limited
No trades
No trades
In-depth trading ideas
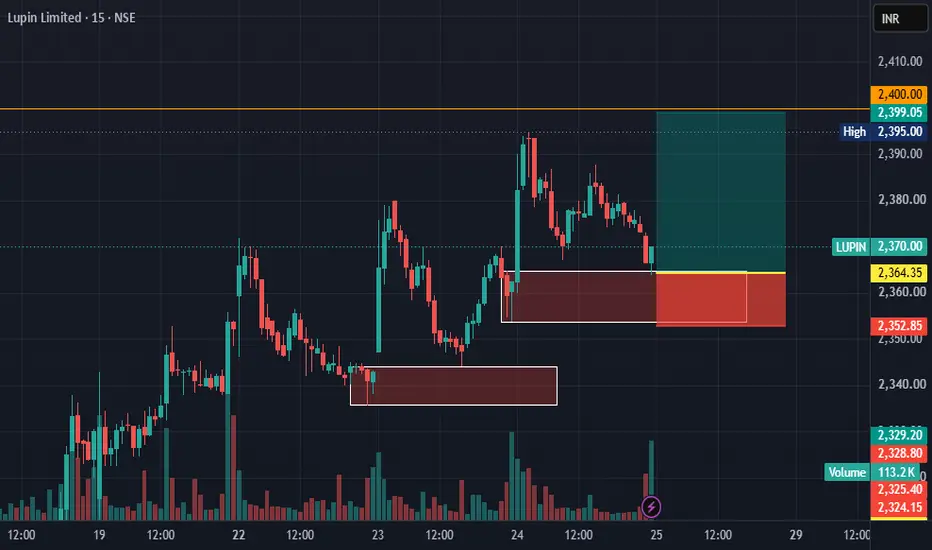
Lupin - Darvas Breakout and retest completeLupin has completed a darvas box breakout with volumes and a good retest.
Good recent results. Increasing revenues from the US look good and can get a lot of upmove.
With 6% SL from CMP the upside is huge.
Awaiting a confirmation before opening a trade though.
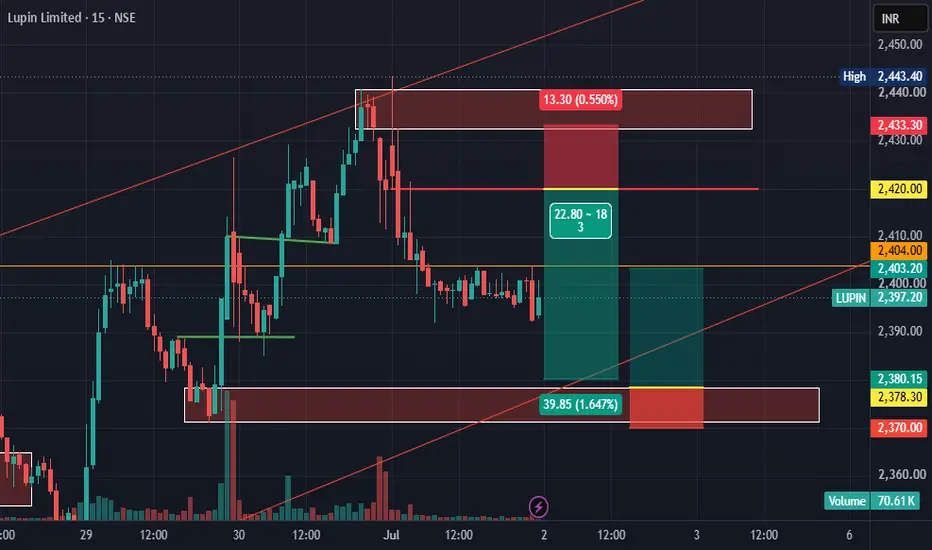
Lupin retest doneBreakout: Price has moved above the marked resistance zone, showing strong bullish intent.
Retest: The breakout level was retested successfully, confirming support.
Volume Spike: Increased trading volume adds conviction to the breakout.
Current Price: ~₹2,373
🎯 Upside Targets:
Target 1: ₹2,420 – immediate extension from breakout zone
Target 2: ₹2,480 – next resistance from prior swing highs
Target 3: ₹2,550 – measured breakout projection & psychological milestone
🛡️ Stop Loss:
Conservative: Below ₹2,340 (recent retest support)
Aggressive: Below ₹2,300 (original breakout level, invalidation point)
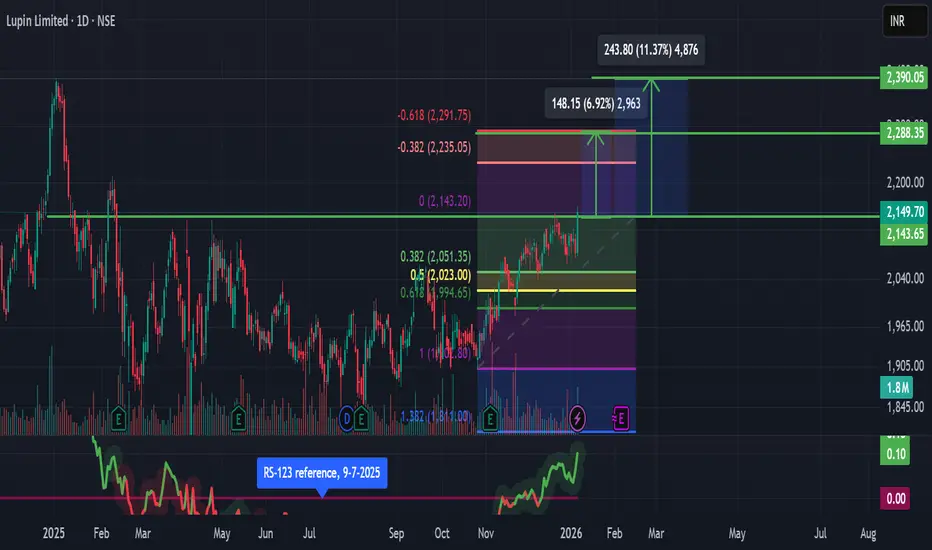
Lupin Ltd | Long Downtrend Reversal with Fibonacci ConfirmationLupin Ltd has shown a notable reversal after a prolonged downtrend and is now sustaining above the 0.5 Fibonacci retracement (golden zone), indicating a shift in trend and strengthening bullish momentum. The price structure suggests accumulation at lower levels, followed by steady higher closes.
The stock appears poised for an upside move, and a decisive breakout above current levels could trigger further momentum-driven buying. The overall chart setup supports a continuation toward higher resistance zones.
Outlook:
A confirmed breakout from current levels may lead to a 5–10% upside in the near to medium term.
Risk Management:
A close below the 0.5 Fibonacci level would weaken the bullish bias and invalidate the setup.
Disclaimer: This is for educational purposes only. Please manage risk accordingly.
EMA Support Zone in Focus | Reversal Setup Developing in LUPIN 4-Hour Chart Analysis
The stock is currently trading inside a well-defined rising channel structure, indicating that the overall trend remains bullish despite recent volatility.
After a sharp correction from higher levels, price is now approaching a strong confluence support zone near 2190 – 2200, where:
Rising channel support is placed
EMA support is aligned
Structure support is active
As long as the stock sustains above this support region, the possibility of a rebound towards 2350 remains strong.
Bullish view will become invalid below the support zone.
In trending markets, healthy pullbacks towards support often create better risk-reward opportunities for disciplined traders.
Is TOP in place for LUPIN?TF: Weekly
CMP: 2245
The wave counts suggests that the top is in place (end of 5th wave) in larger TF.
The counts are marked within the chart
The primary possibilities are
1. Lupin has completed 5 waves from the lows of 504 (Covid lows)
2.4th wave still in play and it is now moving down on C of 4th
In either case, a move towards and below 1900 looks to be very much possible on the cards
This is not a short recommendation as the stock is still in uptrend and above 200 DEMA
But rather a warning/eye opener to keep tight SL for your long positions
Disclaimer: I am not a SEBI registered Analyst and this is not a trading advise. Views are personal and for educational purpose only. Please consult your Financial Advisor for any investment decisions. Please consider my views only to get a different perspective (FOR or AGAINST your views). Please don't trade FNO based on my views. If you like my analysis and learnt something from it, please give a BOOST. Feel free to express your thoughts and questions in the comments section.
NSE – NIFTY 750 | Lupin | 13 Mar 2026Lupin illustrates a Regime Shift Structure.
After a long secular advance into the mid-2010s, the stock entered a structural distribution and decline phase that persisted for several years. This breakdown marked the end of the earlier upward regime.
Since around 2020, price has gradually transitioned into a recovery phase, suggesting structural repair and the rebuilding of a new regime.
This chart forms part of the NIFTY 750 Structural Study, documenting long-term price behaviour across ~750 Indian equities.
Structure → Level → Trigger → Probability
#NIFTY750
#Lupin
#MarketStructure
#ElliottWave
#PriceAction
#IndianStockMarket
#EwavesJournal
LUPIN | Gann Square of 9 – 45° Reaction Case Study | 28 Mar 2022This idea highlights a historical intraday example demonstrating how the Gann Square of 9 helps identify price exhaustion and reaction zones using geometric price levels.
On 28 March 2022, Lupin Ltd opened with a strong bullish tone. The initial intraday low near ₹752.55 was treated as the 0° reference point as per the Gann Square of 9 framework.
📐 Gann Degree Levels
0° (Base Level): ₹752.55
45° (Normal Intraday Capacity): ₹766
90° (Exceptional Move Zone): ₹780
⏱️ Price–Time Observation
During the session, price reached the 45° level (₹766) quickly and reacted precisely from that zone, followed by a clear downside movement.
As per classical Gann intraday observations:
45° reactions often act as temporary resistance when achieved early in the session
Such levels frequently produce measured pullbacks rather than continuation
🧠 Key Learning
This case study shows that:
Gann degree levels define logical intraday limits
Reactions occur at measured price points
Geometry brings structure to intraday volatility
📌 Conclusion
The Gann Square of 9 helps traders evaluate whether a move is normal or stretched. When price reacts from 45°, it signals temporary exhaustion, allowing traders to observe market behavior with clarity and discipline.
Disclaimer:
This chart is shared for educational and analytical purposes only. It is not a trading recommendation or investment advice.
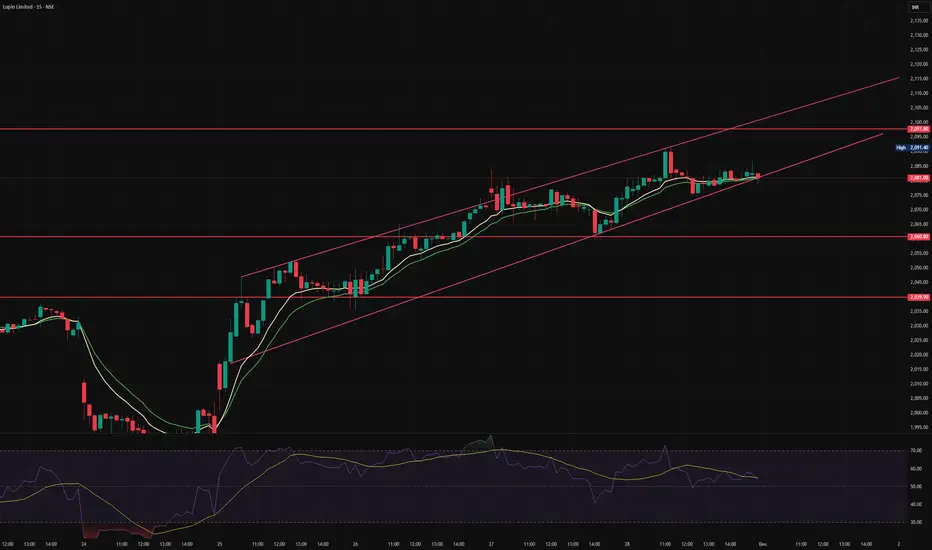
LUPIN - Short for short termLUPIN is in strong uptrend however it is entering into a channel of 2080- 2110. Scalpers can make money on selling at 2100-2110 with a strict stop loss of 2120 and tgt of 2082. Be patient to short it and follow strict SL. Trade at your own will no recommendation just for educational purpose.
LUPIN – Upside Can ResumeLUPIN – Upside Can Resume
CMP: 2060
Stoploss: 1790
Target: 2402
Positional Target: 3400
Why Upside Can Continue (Straight & Clear):
Lupin gave a rounding bottom breakout at 2115.
After the breakout, price rallied straight to 2402 — completing the first leg.
Post that, the stock has done a clean retest, absorbing supply and forming a base.
Now price action again shows renewed strength, indicating the next upside leg can start.
As long as 1790 holds, structure remains strongly bullish.
Positional rounding-bottom target = 3400, which is still open.
Trend is intact, retest is done, and the stock is positioned for the next move.
⚠️ Clarification:
This is an independent analysis based purely on technical and market study. No part of Religare is involved in this view or recommendation.
📝 Important:
I am not responsible for any loss or profit incurred. I am not taking any fees for these views – just sharing my analysis for educational and informational purposes.
📉 Disclaimer: Not SEBI-registered. Please do your own research or consult a financial advisor before taking any investment decision.
Lupin Ltd for 25th Sept #LUPIN Lupin Ltd for 25th Sept #LUPIN
Resistance 2000-2010 Watching above 2016 for upside momentum.
Support area 1970 Below 1990 gnoring upside momentum for intraday
Watching below 1967 for downside movement...
Above 1990 ignoring downside move for intraday
Charts for Educational purposes only.
Please follow strict stop loss and risk reward if you follow the level.
Thanks,
V Trade Point
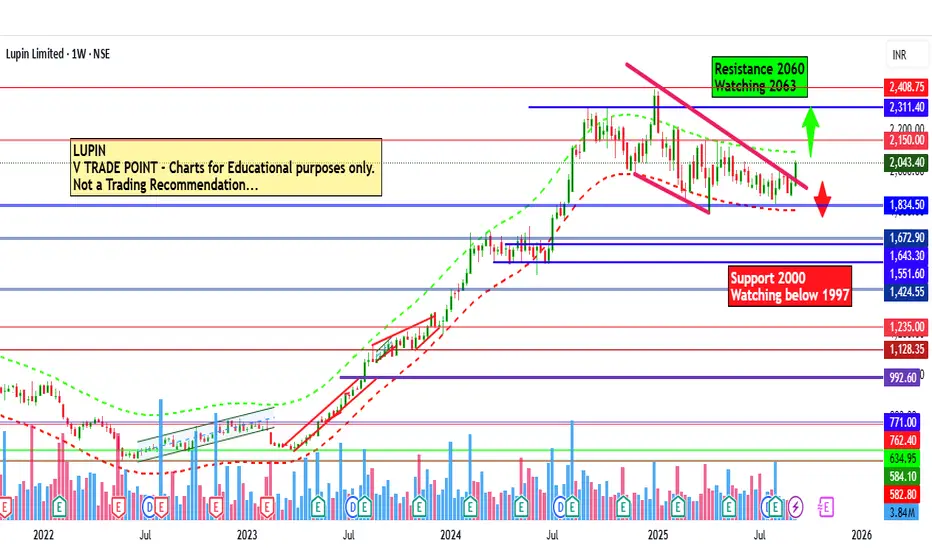
LUPIN Ltd for 17th Sept #LUPIN LUPIN Ltd for 17th Sept #LUPIN
Resistance 2060 Watching above 2063 for upside momentum.
Support area 2000 Below 2030 gnoring upside momentum for intraday
Watching below 1997 for downside movement...
Above 2030 ignoring downside move for intraday
Charts for Educational purposes only.
Please follow strict stop loss and risk reward if you follow the level.
Thanks,
V Trade Point
LUPIN Ltd for 15th Sept #LUPIN LUPIN Ltd for 15th Sept #LUPIN
Resistance 2060 Watching above 2063 for upside momentum.
Support area 2000 Below 2030 gnoring upside momentum for intraday
Watching below 1997 for downside movement...
Above 2030 ignoring downside move for intraday
Charts for Educational purposes only.
Please follow strict stop loss and risk reward if you follow the level.
Thanks,
V Trade Point
Lupin Swing Trade Setup📊 Price Action & Trend Analysis
Analyzing market trends using price action, key support/resistance levels, and candlestick patterns to identify high-probability trade setups.
Always follow the trend and manage risk wisely!
Price Action Analysis Interprets Market Movements Using Patterns And Trends On Price Charts.
👉👉👉Follow us for Live Market Views/Trades/Analysis/News Updates.
INTRADAY SET UP AND ANALYSIS FOR 6TH AUGUST 2025Nifty future and banknifty future analysis and intraday plan.
This video is for information/education purpose only. you are 100% responsible for any actions you take by reading/viewing this post.
please consult your financial advisor before taking any action.
----Vinaykumar hiremath, CMT
Lupin At Best Support !! This is the 4 hour chart of Lupin .
Lupin appears to be forming a potential Three Drives bullish reversal pattern, with both drives terminating at the 1.27 Fibonacci extension level, indicating a possible exhaustion of the downtrend.
Lupin is trading within a well-defined descending channel. It has once again approached the lower boundary of the channel, which lies around the 1865–1880 zone, and is showing signs of a bounce.
If this level is sustain , then we may see higher prices in Lupin.
Thank You !!