Bank of Maharashtra
No trades
No trades
In-depth trading ideas
Bank of Maharashtra – Strong Breakout Retest Opportunity
Bank of Maharashtra has delivered a clean breakout from a long-term consolidation and resistance zone around 73–75, signaling a major shift in market structure. The breakout was backed by strong bullish momentum and increased volume participation, indicating institutional accumulation.
After the sharp rally, the stock is now undergoing a healthy retest of the breakout zone, which is often considered one of the best low-risk entry opportunities in trending stocks. Price continues to sustain above the key breakout area as well as the rising 200 DMA, reflecting strong bullish control on the higher timeframe.
Technical Highlights:
* Multi-month resistance breakout above the crucial 73–75 supply zone.
* Breakout supported by strong volume expansion, confirming buying strength.
* Previous resistance is now acting as support during the current pullback.
* Sustaining above the rising 200 DMA indicates long-term bullish structure.
* Formation of higher highs and higher lows confirms ongoing uptrend momentum.
* Ascending trendline support remains intact, showing aggressive dip buying activity.
* Current consolidation appears to be a bullish retest rather than a reversal.
* Structure suggests possible continuation into Stage-2 markup phase.
* Favorable risk-to-reward setup for positional and swing traders.
### Trade Setup:
Entry Zone: Around CMP / Near breakout support
Target: 97+
Stop Loss: Below 66.40
As long as the breakout zone holds, the probability favors trend continuation towards fresh highs in the coming weeks.
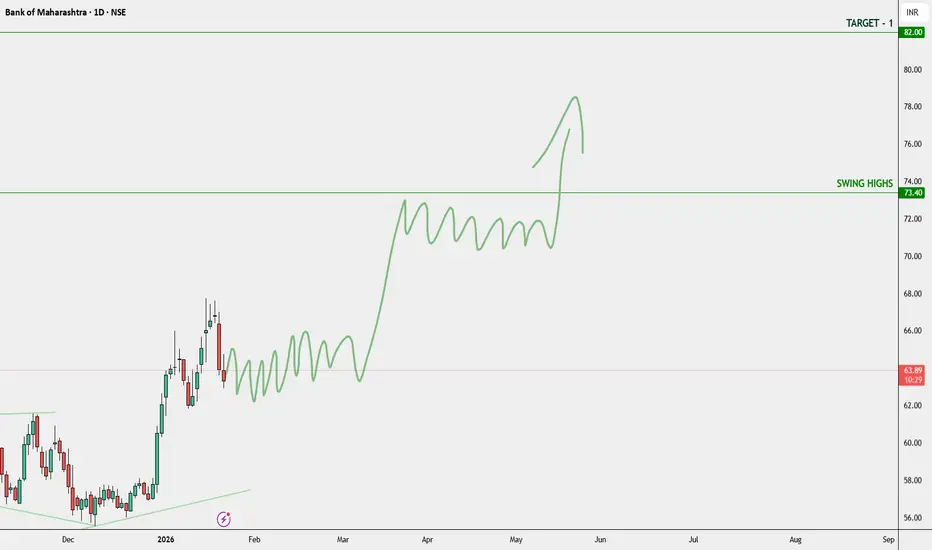
BANK OF MAHARASHTRA - DAILY CHART MY VIEW The Structure looks good to us, waiting for this instrument to correct and then give us these opportunities as shown on this instrument (Price Chart).
Note: Its my view only and its for educational purpose only. Only who has got knowledge about this strategy, will understand what to be done on this setup. its purely based on my technical analysis only (strategies). we don't focus on the short term moves, we look for only for Bullish or Bearish Impulsive moves on the setups after a good price action is formed as per the strategy. we never get into corrective moves. because it will test our patience and also it will be a bullish or a bearish trap. and try trade the big moves.
We do not get into bullish or bearish traps. We anticipate and get into only big bullish or bearish moves (Impulsive Moves). Just ride the Bullish or Bearish Impulsive Move. Learn & Know the Complete Market Cycle.
Buy Low and Sell High Concept. Buy at Cheaper Price and Sell at Expensive Price.
Please keep your comments useful & respectful.
Keep it simple, keep it Unique.
Thanks for your support
Tradelikemee Academy
Saanjayy K G
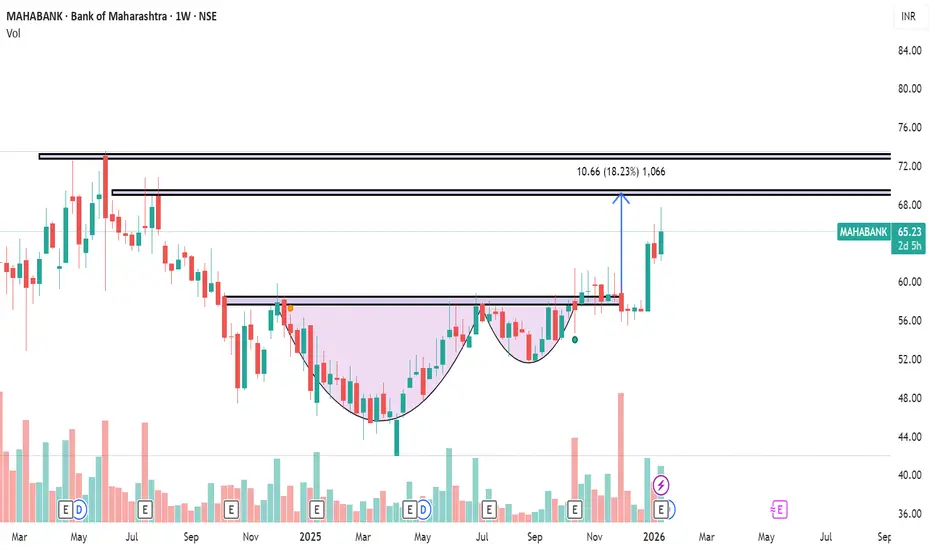
Amazing breakout on WEEKLY Timeframe - MAHABANKCheckout an amazing breakout happened in the stock in Weekly timeframe, macroscopically seen in Daily timeframe. Having a great favor that the stock might be bullish expecting a staggering returns of minimum 25% TGT. IMPORTANT BREAKOUT LEVELS ARE ALWAYS RESPECTED!
NOTE for learners: Place the breakout levels as per the chart shared and track it yourself to get amazed!!
#No complicated chart patterns
#No big big indicators
#No Excel sheet or number magics
TRADE IDEA: WAIT FOR THE STOCK TO BREAKOUT IN WEEKLY TIMEFRAME ABOVE THIS LEVEL.
Checkout an amazing breakout happened in the stock in Weekly timeframe.
Breakouts happening in longer timeframe is way more powerful than the breakouts seen in Daily timeframe. You can blindly invest once the weekly candle closes above the breakout line and stay invested forever. Also these stocks breakouts are lifelong predictions, it means technically these breakouts happen giving more returns in the longer runs. Hence, even when the scrip makes a loss of 10% / 20% / 30% / 50%, the stock will regain and turn around. Once they again enter the same breakout level, they will flyyyyyyyyyyyy like a ROCKET if held in the portfolio in the longer run.
Time makes money, GREEDY & EGO will not make money.
Also, magically these breakouts tend to prove that the companies turn around and fundamentally becoming strong. Also the magic happens when more diversification is done in various sectors under various scripts with equal money invested in each N500 scripts.
The real deal is when to purchase and where to purchase the stock. That is where Breakout study comes into play.
Check this stock which has made an all time low and high chances that it makes a "V" shaped recovery.
> Taking support at last years support or breakout level
> High chances that it reverses from this point.
> Volume dried up badly in last few months / days.
> Very high suspicion based analysis and not based on chart patterns / candle patterns deeply.
> VALUABLE STOCK AVAILABLE AT A DISCOUNTED PRICE
> OPPURTUNITY TO ACCUMULATE ADEQUATE QUANTITY
> MARKET AFTER A CORRECTION / PANIC FALL TO MAKE GOOD INVESTMENT
DISCLAIMER : This is just for educational purpose. This type of analysis is equivalent to catching a falling knife. If you are a warrior, you throw all the knives back else you will be sorrow if it hits SL. Make sure to do your analysis well. This type of analysis only suits high risks investor and whose is willing to throw all the knives above irrespective of any sectoral rotation. BE VERY CAUTIOUS AS IT IS EXTREME BOTTOM FISHING.
HOWEVER, THIS IS HOW MULTIBAGGERS ARE CAUGHT !
STOCK IS AT RIGHT PE / RIGHT EVALUATION / MORE ROAD TO GROW / CORRECTED IV / EXCELLENT BOOKS / USING MARKET CRASH AS AN OPPURTUNITY / EPS AT SKY.
LET'S PUMP IN SOME MONEY AND REVOLUTIONIZE THE NATION'S ECONOMY!
Weekly Analysis Index and Stocks. Found Unique stocks for InvestFound Few Unique stocks and Bees that will generate good momentum (rocket):
🔹#Hi-Tech Pipes
🔹#Astramicrowave
🔹#AsterDM
🔹#Monte Carlo Fashions
🔹#EicherMotor
🔹#Paragmilk
🔹#PSUBankbees
🔹#Silverbees
🔹#MahaBank
Sole purpose of doing it was to instill a belief that money can be made with patience to wait for the right setups and the discipline of executing them without fear
Maha BankSEBI-Disclosure for Stock Analysis
For Informational Purposes Only: The analysis provided above is for educational and informational purposes only and is based on the technical interpretation of the supplied stock chart. It should not be construed as financial advice, investment advice, or a recommendation to buy, sell, or hold any security.
Not a Financial Advisor: I am an AI assistant and not a registered or qualified financial advisor, investment advisor, or stockbroker. The information presented is generated without considering your individual financial situation, risk tolerance, or investment objectives.
Risk of Loss: Trading and investing in financial markets, including equities, carry a significant risk of loss. The value of stocks can fluctuate, and you may lose part or all of your investment. Past performance is not indicative of future results.
Consult a Professional: Before making any investment decisions, you should conduct your own thorough research and/or consult with a qualified financial professional to assess your personal circumstances and the suitability of any investment.
Information Accuracy: While this analysis is based on the data visible in the chart, it does not account for all possible market variables, including fundamental factors (like company earnings, debt, management) or macroeconomic events (like interest rate changes, government policies) that can impact the stock's price.
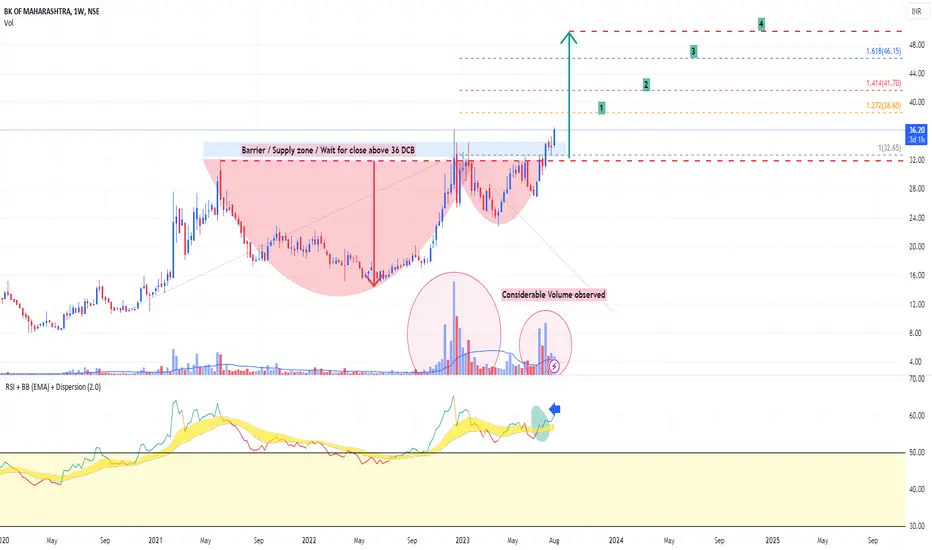
Bank of MaharashtraTargets in Chart
Stoploss - 28
Market Cap
₹ 24,385 Cr.
Current Price
₹ 36.2
High / Low
₹ 36.2 / 16.8
Stock P/E
8.07
Book Value
₹ 23.5
Dividend Yield
3.65 %
ROCE
4.44 %
ROE
17.4 %
Face Value
₹ 10.0
Promoter holding
86.5 %
EPS last year
₹ 3.87
EPS latest quarter
₹ 1.31
Debt
₹ 2,44,830 Cr.
Pledged percentage
0.00 %
Net CF
₹ -1,387 Cr.
Price to Cash Flow
-16.9
Free Cash Flow
₹ -1,617 Cr.
Debt to equity
15.5
OPM last year
55.0 %
OPM 5Year
42.4 %
Reserves
₹ 9,060 Cr.
Price to book value
1.53
Int Coverage
1.44
PEG Ratio
0.24
MAHABANK - Bank of Maharashtra - Long Term Buy & HoldMAHABANK Technical Analysis :- Based on technical analysis, I suggest this stock to buy and Hold for long term for maximum profit and I am bullish in this stock
Short-Term Bearish: Recent price drops and technical indicators like the Awesome Oscillator and Average Directional Index (ADI) suggest a downward trend.
Long-Term Bullish: Some indicators show a one-week buy trend and a one-month buy signal, hinting at a potential reversal.
Do your own research before buying this stock as I am not SEBI registered person
Thanks for your support as always
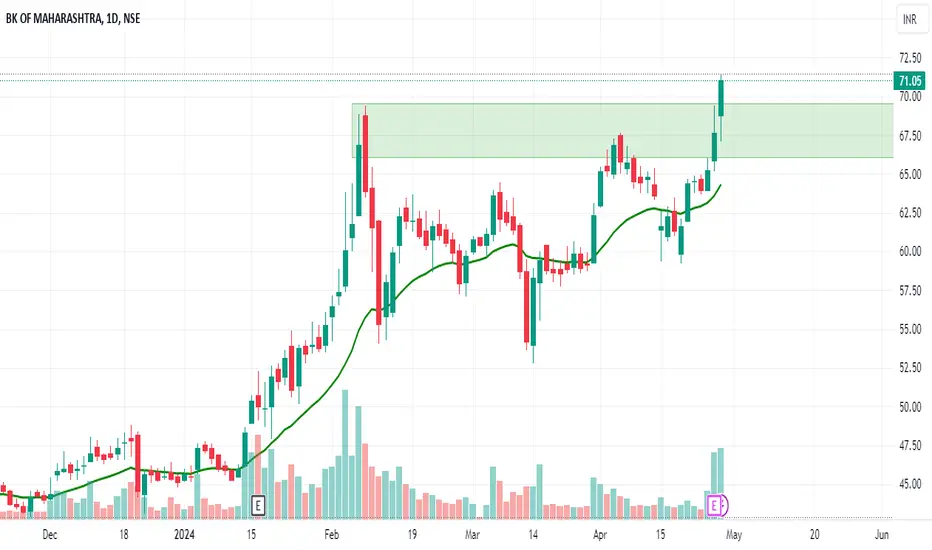
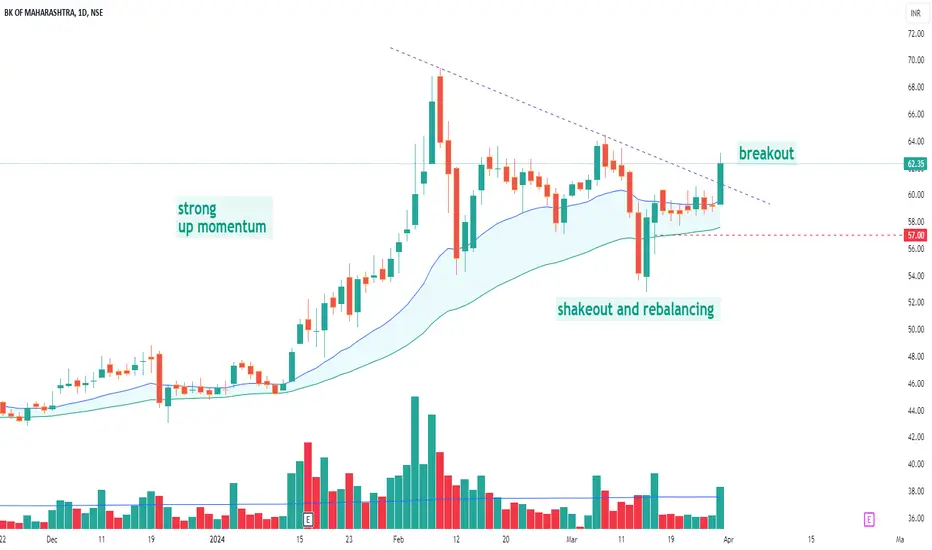
MAHABANKTriangle pattern Breakout .
Good volumes.
Consolidation done .
Above all Key EMA.
Good for Short term.
Do Like ,Comment , Follow for regular Updates...
Keep Learning ,Keep Earning...
Disclaimer : This is not a Buy or Sell recommendation. I am not SEBI Registered. Please consult your financial advisor before making any investments . This is for Educational purpose only.