New breakout Ready to move upward. It completed the corrective pattern and may follow the previous motive wave. Keep SL at recent swing low i.e, low of wave 4Longby harishpop3211
MANKIND (D) CHARTTechnical Note: Let the market come to your zones and show its hand. Trade safely and manage your risk! Always wait for your own confirmations before entering the market. Risk Disclaimer: This analysis is for educational purposes only and does not constitute financial advice. Always practice proper risk and position sizing. The market is supreme; no one can make a 100% accurate prediction. Stop Loss Must if you want to be a profitable Trader. MARKET VIEW:- Current Bias: BULLISH Preferred Strategy: – BUY ON DIP... Wait for ConfirmationLongby askbiswanath20250
MANKIND: High-Level Breakout & Bullish EMA Ribbon Alignment 📊 Mankind Pharma Ltd. (MANKIND) - 1-Hour (1H) Chart Analysis This post is shared for EDUCATIONAL PURPOSES ONLY to analyze short-term continuation breakouts, moving average alignment, and structural price expansion. It is not financial or investment advice. 🎯 Educational Swing Setup: • Entry Zone: 2,575.00 – 2,620.00 (Sizing into position blocks near current levels or accumulating on minor intraday pullbacks toward the 2,580 EMA support shelf). • Target 1: 2,750.00 (Near-term key structural expansion target) • Target 2: 2,880.00 (Extended momentum target zone) • Invalidation / Stop-Loss: 2,495.00 (A definitive 1H close back below the pink long-term moving average baseline completely invalidates this short-term bullish continuation setup). • Expected Duration: 4 to 10 Trading Days (Short-term 1H swing view) ⚠️ Risk Management: Since the price has pushed into fresh local peaks, watch for volume continuation on hourly candle prints to validate sustained institutional participation. Keep your position sizing disciplined and manage your risk strictly! Longby rmhetre151
MANKIND | Buy @LTP | Strict SL below 2480 | Targets 2980, 3460The stock market involves risk, risk, and only risk. To survive in the market, accepting stop-loss with discipline and without hesitation. There is no other way to protect you capital. Any stock I share is either already part of my existing holding or I take a fresh entry at the same level I mention. I always place the stop-loss in my system at the time of buying, and I give the highest importance to stop-loss more than the target. Once the target is achieved, I usually book profit once and then wait for either a retest or a fresh breakout. Disclaimer (Please Read Carefully): This is not investment advice. The stocks shared here are purely for educational and informational purposes. Please do your own research or consult with a financial advisor before making any investment decisions. Longby ProfitLossMereSathUpdated 1
MANKIND - Trading Opportunity in the short termTF: daily CMP: 2330 Observation: Price is bouncing from the breakout Retest zone Price is taking support at the 200 DEMA 50 DEMA confluence zone Price made a doji at the support and reversal confirmation is in play. Positional players can enter now and hold. One can wait for another pullback and buy. SL will be 2275 on DCB Disclaimer: I am not a SEBI registered Analyst and this is not a trading advise. Views are personal and for educational purpose only. Please consult your Financial Advisor for any investment decisions. Please consider my views only to get a different perspective (FOR or AGAINST your views). Please don't trade FNO based on my views. If you like my analysis and learnt something from it, please give a BOOST. Feel free to express your thoughts and questions in the comments section.by Murthy_SanthoshUpdated 5
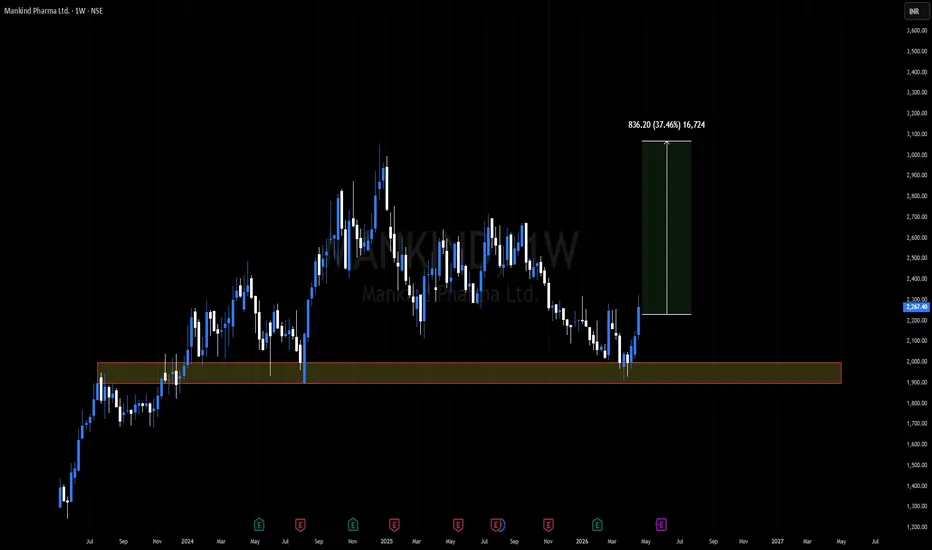
MANKIND PHARMA – SWING TO POSITIONAL TRADE SETUP LOADING .......✅ Accumulation Near Key Support Price is holding the ₹2,300–₹2,340 demand zone. Previous resistance is attempting to become support. ✅ Multi-Month Trendline Breakout Long-term descending trendline has been broken. Signals potential trend reversal after a prolonged correction. ✅ Volume Confirms Interest Breakout accompanied by one of the highest volume spikes in months. Indicates strong participation from large buyers. ✅ Strong Recovery Structure Sharp rally from ₹1,900 lows. Higher Highs and Higher Lows established. Market structure has turned bullish. ✅ Moving Average Support Price reclaimed and is sustaining above the moving average. Momentum remains positive. Trade Setup Accumulation Zone: ₹2,300–₹2,375 Stop Loss: ₹2,219 Target: ₹3,000–₹3,050 Why I'm Bullish? ✔ Trendline Breakout ✔ Resistance to Support Flip ✔ Strong Volume Expansion ✔ Higher High & Higher Low Formation ✔ Recovery From Major Base ✔ Attractive Risk-Reward Longby Pips_Sadhak2
MANKIND - A must consider script in the Pharma spaceCMP: 2520 TF: Daily Most of the scripts had a great run since covid and they were multiplied by 5-8x since covid. Since this script listed only in 2024, and didnt move much, and also in the pharma space, i believe that this script has a great potential compared to every other stock in the pharma space. At 2520, the stock is exhibiting the nature of 3rd wave upmove (awaiting confirmation by breaking the (recent swing resistances). One can consider and/or remain invested in this script. It ticks all the boxes for a good bullish stock Above cloud Above 200 DEMA RSI above 70 Trendline breakout and retest done Disclaimer: I am not a SEBI registered Analyst and this is not a trading advise. Views are personal and for educational purpose only. Please consult your Financial Advisor for any investment decisions. Please consider my views only to get a different perspective (FOR or AGAINST your views). Please don't trade FNO based on my views. If you like my analysis and learnt something from it, please give a BOOST. Feel free to express your thoughts and questions in the comments section.by Murthy_SanthoshUpdated 224
Review and plan for 20th May 2026 Nifty future and banknifty future analysis and intraday plan. This video is for information/education purpose only. you are 100% responsible for any actions you take by reading/viewing this post. please consult your financial advisor before taking any action. ----Vinaykumar hiremath, CMT06:20by vinaysh0
Amazing INVESTMENT on WEEKLY Timeframe - MANKINDCheckout an amazing breakout happened in the stock in Weekly timeframe, macroscopically seen in Daily timeframe. Having a great favor that the stock might be bullish expecting a staggering returns of minimum 25% TGT. IMPORTANT BREAKOUT LEVELS ARE ALWAYS RESPECTED! NOTE for learners: Place the breakout levels as per the chart shared and track it yourself to get amazed!! #No complicated chart patterns #No big big indicators #No Excel sheet or number magics TRADE IDEA: WAIT FOR THE STOCK TO BREAKOUT IN WEEKLY TIMEFRAME ABOVE THIS LEVEL. Checkout an amazing breakout happened in the stock in Weekly timeframe. Breakouts happening in longer timeframe is way more powerful than the breakouts seen in Daily timeframe. You can blindly invest once the weekly candle closes above the breakout line and stay invested forever. Also these stocks breakouts are lifelong predictions, it means technically these breakouts happen giving more returns in the longer runs. Hence, even when the scrip makes a loss of 10% / 20% / 30% / 50%, the stock will regain and turn around. Once they again enter the same breakout level, they will flyyyyyyyyyyyy like a ROCKET if held in the portfolio in the longer run. Time makes money, GREEDY & EGO will not make money. Also, magically these breakouts tend to prove that the companies turn around and fundamentally becoming strong. Also the magic happens when more diversification is done in various sectors under various scripts with equal money invested in each N500 scripts. The real deal is when to purchase and where to purchase the stock. That is where Breakout study comes into play. Check this stock which has made an all time low and high chances that it makes a "V" shaped recovery. > Taking support at last years support or breakout level > High chances that it reverses from this point. > Volume dried up badly in last few months / days. > Very high suspicion based analysis and not based on chart patterns / candle patterns deeply. > VALUABLE STOCK AVAILABLE AT A DISCOUNTED PRICE > OPPURTUNITY TO ACCUMULATE ADEQUATE QUANTITY > MARKET AFTER A CORRECTION / PANIC FALL TO MAKE GOOD INVESTMENT DISCLAIMER : This is just for educational purpose. This type of analysis is equivalent to catching a falling knife. If you are a warrior, you throw all the knives back else you will be sorrow if it hits SL. Make sure to do your analysis well. This type of analysis only suits high risks investor and whose is willing to throw all the knives above irrespective of any sectoral rotation. BE VERY CAUTIOUS AS IT IS EXTREME BOTTOM FISHING. HOWEVER, THIS IS HOW MULTIBAGGERS ARE CAUGHT ! STOCK IS AT RIGHT PE / RIGHT EVALUATION / MORE ROAD TO GROW / CORRECTED IV / EXCELLENT BOOKS / USING MARKET CRASH AS AN OPPURTUNITY / EPS AT SKY. LET'S PUMP IN SOME MONEY AND REVOLUTIONIZE THE NATION'S ECONOMY! Longby Yoyohoneysingh930
Chart – MANKIND (Educational View)Sharing this chart for educational purposes and market study. This is not a buy/sell recommendation. It’s a structured view of current price behavior around key levels. Focus areas on the chart: • Market structure • Key support & resistance zones • Reaction zones where price is responding • Possible scenarios based on price action The idea is simple—trade what price shows, not what we expect. Always wait for confirmation, manage risk properly, and avoid overtrading. Trading is about consistency, not predictions. #MANKIND #TradingView #StockMarketIndia #Nifty #PriceAction #IntradayTrading #TradingIdeas #RiskManagement #TradingDiscipline by NiftyNerve0
MANKIND making double bottom MANKIND making double bottom after exit all long . let see where it will go04:03by StockAerna1
MANKIND Hi, Price traded in channel and now at lower end of channel so possiblity that it will be moves upper side. Let's see what happens This idea is for Educational purpose and paper trading only. Please consult your financial advisor before investing or making any position. Facts or Data given above may be slightly incorrect. We are not SEBI registered Longby RRC5554
MANKIND PHARMA: Descending Triangle Breakout🎯 BUY Entry at CMP 💰 TARGET Calculated using the triangle's height: ₹2900 🛑 STOP-LOSS Place just below the breakout point for risk management: ₹2555 Longby rmhetre155
MANKIND PHARMA- MULTIPLE SUPPORTS & RESISTANCESI have drawn support and resistance lines. it may be following the trend lines. May not be as well... need more time to see if the trend lines are being supported by the stock. As of now, volumes are missing and stock has held its price. Earnings on 28th August. Stock likely to remain range bound. May mint some money. Also since nifty has made ATH, holding on to a pharma stock not bad idea.by abhigel75Updated 332
MANKIND PHARMA - For swing Trade1. In monthly time frame price is looking very bullish. 2. In weekly time frame price has given a breakout of double bottom pattern which is also showing bullish sign. And also from last 4 weeks price is making a good bullish move upside. 3. In daily time frame price has given a curve line breakout and make a good bullish move upside today. 4. Current price is 2696 2642 was the breakout level and also a break of structure(BOS) 5. Next Target can be 2840 to 2940 NOTE - 2445 to 2410 is the Bullish reversal zone. Longby rounakgupta2743
Mankind Pharma has opportunity for swing tradingmankind pharma has crossed monthly support and has now opportunity for swing trading with help of nifty50 also in plus. currently it is at 2432 it can go up to 2537 which is weekly support.Longby ravimakadia83Updated 222
Mankind Pharma Ltd view for Intraday 22nd May #MANKIND Mankind Pharma Ltd view for Intraday 22nd May #MANKIND Resistance 2550 Watching above 2555 for upside momentum. Support area 2500 Below 2520 ignoring upside momentum for intraday Watching below 2498 for downside movement... Above 2520 ignoring downside move for intraday Charts for Educational purposes only. Please follow strict stop loss and risk reward if you follow the level. Thanks, V Trade PointLongby Tradesspot0
MANKIND PHARMA, WATCH OUT FOR BREAKOUTmankind pharma look for breakout, from last two days price is moving up and the volumes are rising. education purpose only.by ArunKumar1707861
ATH breakoutGood volume buildup in daily time frame. ATH breakout and retest successfully. Fundamental's are good. FII stakes are up. NOTE: I do my analysis, do yours before trade. Eat🍜 Sleep😴 TradingView📈 Repeat 🔁Longby GreyandWise0
MANKIND PHARMA LTD S/R Support and Resistance Levels: Support Levels: These are price points (green line/shade) where a downward trend may be halted due to a concentration of buying interest. Imagine them as a safety net where buyers step in, preventing further decline. Resistance Levels: Conversely, resistance levels (red line/shade) are where upward trends might stall due to increased selling interest. They act like a ceiling where sellers come in to push prices down. Breakouts: Bullish Breakout: When the price moves above resistance, it often indicates strong buying interest and the potential for a continued uptrend. Traders may view this as a signal to buy or hold. Bearish Breakout: When the price falls below support, it can signal strong selling interest and the potential for a continued downtrend. Traders might see this as a cue to sell or avoid buying. 20 EMA (Exponential Moving Average): Above 20 EMA: If the stock price is above the 20 EMA, it suggests a potential uptrend or bullish momentum. Below 20 EMA: If the stock price is below the 20 EMA, it indicates a potential downtrend or bearish momentum. Trendline: A trendline is a straight line drawn on a chart to represent the general direction of a data point set. Uptrend Line: Drawn by connecting the lows in an upward trend. Indicates that the price is moving higher over time. Acts as a support level, where prices tend to bounce upward. Downtrend Line: Drawn by connecting the highs in a downward trend. Indicates that the price is moving lower over time. It acts as a resistance level, where prices tend to drop. RSI: RSI readings greater than the 70 level are overbought territory, and RSI readings lower than the 30 level are considered oversold territory. Combining RSI with Support and Resistance: Support Level: This is a price level where a stock tends to find buying interest, preventing it from falling further. If RSI is showing an oversold condition (below 30) and the price is near or at a strong support level, it could be a good buy signal. Resistance Level: This is a price level where a stock tends to find selling interest, preventing it from rising further. If RSI is showing an overbought condition (above 70) and the price is near or at a strong resistance level, it could be a signal to sell or short the asset. Disclaimer: I am not a SEBI registered. The information provided here is for learning purposes only and should not be interpreted as financial advice. Consider the broader market context and consult with a qualified financial advisor before making investment decisions. by zenthosh1
MANKIND PHARMABullish Wedge Pattern is forming. Wait for Retest. Than Make Your Position. Idea shared Only for Educational Purpose. Longby TeJiVishalUpdated 4
W PATTERN HAS FORMED1 DAY Time Frame- W PATTERN HAS FORMED. Just keep patience to get supported on 61.80%. 3 times rejection from fib based extention 78.60% and got supported from 50.00% it's time to make new entries. IDEA SHARED ONLY FOR EDUCATIONAL PURPOSE.Longby TeJiVishalUpdated 4
MANKINDThese are swing ideas which you can add your watchlist and analysis for yourself ! Longby RahulAyar1

 Long
Long