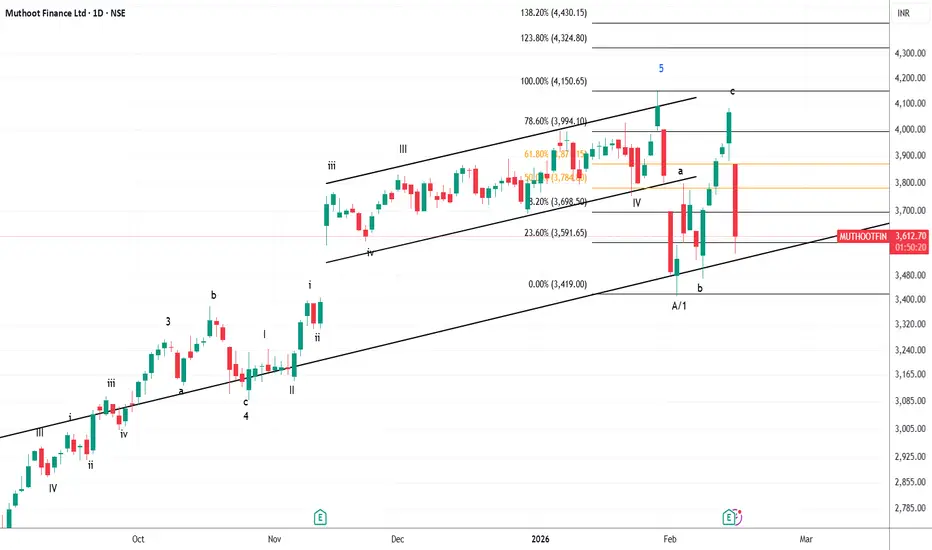
MUTHOOTFIN – Trendline Test at ₹2,770Price has come back to touch the 2-year rising trendline after correcting from ₹4,000 highs.
What the chart says:
Long-term uptrend line held since mid-2024
Price now sitting exactly on the line at ₹2,770
This is the first real test of this support after the top
Levels to watch:
Hold above ₹2,750 → bounce likely toward ₹3,100
Close below ₹2,700 → trendline breaks, next support near ₹2,300
View: Make-or-break zone. Bulls need to defend here. A daily close below the line changes the structure
In-depth trading ideas
MUTHOOTFIN | Falling Wedge BreakoutAfter months of consolidation within a falling wedge, MUTHOOTFIN has broken out with strong volume, indicating renewed buying interest.
Entry: ₹2,900–2,910
Target: ₹3,040 (+4.5%)
Stop Loss: Below ₹2,840
Thesis:
Bullish wedge breakout
Volume confirms the move
Previous resistance may now act as support
Muthoot Finance Share analysis## 🏢 Muthoot Finance — Business Model (Simple English Explanation)
---
## 📌 Company Overview
**Muthoot Finance Ltd** is one of India’s largest **Gold Loan Non-Banking Financial Companies (NBFCs)**.
The company mainly provides **loans against gold jewellery** to individuals and small businesses.
Founded in 1939, its core idea is simple:
> **People pledge gold → Company gives instant loan → Interest income becomes company profit.**
---
## 💰 Core Business Model
### 1️⃣ Gold Loan Business (M
Review and plan for 18th February 2026Nifty future and banknifty future analysis and intraday plan.
This video is for information/education purpose only. you are 100% responsible for any actions you take by reading/viewing this post.
please consult your financial advisor before taking any action.
----Vinaykumar hiremath, CMT
Muthoot Finance: Bearish View-Updated ChartPrice action triggered the initial stop-loss at ₹3800, indicating short-term strength. However, the subsequent rally failed to surpass the prior Wave 5 high, thereby keeping the broader bearish structure intact. The inability to register a higher high suggests that the recent up move is likely a counter-trend rally within a developing corrective or impulsive decline.
The sharp upside retracement further reinforces the characteristic nature of bear market rallies, which tend to be swift and aggr
Muthoot Finance Ltd. – Technical View: Bearish BiasThe stock has completed a five-wave advance, following which price witnessed a sharp corrective decline, indicating exhaustion at higher levels. The subsequent rebound retraced up to the 50% Fibonacci retracement, where price faced selling pressure near the Open–High zone, forming a strong supply area and reinforcing resistance around current levels.
From an Elliott Wave perspective, the initial decline can be interpreted either as Wave A or Wave 1. The retracement that followed fits the struct
MUTHOOT FINANCETrend Overview
Overall Trend: Strong UP across all timeframes (Yearly → Daily → Intraday).
Key Averages:
HTF Avg: 2,478
MTF Avg: 3,187
ITF Avg: 3,167
Trade Plan
Entry: 3,245
Stop Loss: 3,089
Targets:
First Target: 3,535
Positional Target: 3,928
Quantity: 500 shares
Risk/Reward (RR): 2.39
Financials
Total Buy Value: 1,622,500
Capital at Risk: 567,875
Net Profit if Targets Hit: ~205,822
Net Loss if Stop Hit: 85,953
ROI:
12 months: ~9.7% p.a.
4 months: ~32%
Key Points
Trade a
RESULT IS SUPER GOLD RATE IS HIGH RELEND IS HIGH GO FOR 3000+BEST GOLD Loan lender giant Muthoot fin. is going for 3000+ start to build base zone might take some more session around 2510-2680 on result day big candle with rise volume now consolidate and remove weak longs once process done upward journey to 3000+ ... ROCE., NIM , NPA are looking promising as per mangagment guidance., One can grab this for 3000+ with daily close below sl 2510... CMP 2675
Buy Muthootfin @1055-80 TGT 1625/4800/9300 avg @ 950 Sl 790The stock had taken a meaningful correction as well as the Gold prices also on the verge of breakout. As per the chart stock is trying to break free from the clutches of 200 WEMA which will boost it towards the life time high and once the high breaks, it will be in open territory to go for the above mentioned targets.
Pole and Flag The pole and flag pattern is a classic continuation pattern in technical analysis, often signaling that the current trend is likely to continue after a brief consolidation. The pattern consists of:
Pole: A sharp, nearly vertical movement in price reflecting strong market momentum.
Flag: A consolidation phase where price moves within parallel trendlines, usually sloping against the direction of the pole, indicating a pause before the next move.
In the provided chart of Muthoot Finance Ltd., th
MUTHOOT FINANCE at Best Resistance !! This is the Daily Chart of MUTHOOT FINANCE .
MUTHOOTFIN is currently trading near its resistance range around the 2700 range.
MUTHOOTFIN has completed its upward move as per its natural price behavior, with the rise reaching up to the 2700 range.
If This level is sustain , then we may see lower prices in MUTHOOTFIN.
Thank You !!
MUTHOOTFIN (Breakout Stock)🚀 MUTHOOT FINANCE – Breakout Stock Alert! 🚀
Muthoot Finance has given a strong breakout, backed by solid fundamentals and increasing investor interest. The stock is showing high momentum with a surge in volumes, indicating strong buying pressure.
📊 Key Highlights:
✅ Breakout Confirmation: Price action suggests a sustained uptrend.
✅ Strong Fundamentals: Consistently delivering robust financial performance.
✅ Sector Strength: NBFCs are gaining traction, making Muthoot Finance a prime candidate
MUTHOOTFINANCE WEEKLY BREAKOUT FOR LONG TERM
FUNDAMENTALS:-
Muthoot Finance, a leading non-banking financial company (NBFC) specializing in gold loans, has shown strong financial fundamentals over the years. Here's a detailed analysis:
### 1. **Financial Performance**
- **Revenue Growth:** Muthoot Finance's revenue has shown consistent growth, with recent numbers reflecting a robust gold loan portfolio.
- **Profit Margins:** Net profit margins have been healthy, benefiting from lower operational costs and an efficient loan disburs
MUTHOOT FINANCE FINANCE LTD Swing TradeHello,
Trend-Based Analysis. Buy the Dips, Sell The Rallies, Also Following the Trend. Let's see where the Price Action takes us, Riding the wave. Potential trade setups based on trend momentum.
Technical analysis based on trend identification and momentum, Looking for high-probability setups within the prevailing trend.
Analyzing the current market trend and potential future price movement. Focusing on risk management and reward-to-risk ratios.
Details is Mentioned in Chart, Read carefully.
Muthootfin looks good with Head & Shoulder Pattern watch out.hello Investor's,
Chart looks very promising as pattern is attractive for short & long term view.
Already broken pattern with open low same on one day chart should blast with short correction.
Trade or invests with strict stop loss.
Patience is a game of investing returns.
MUTHOOT FINANCE LTD S/R Support and Resistance Levels:
Support Levels: These are price points (green line/shade) where a downward trend may be halted due to a concentration of buying interest. Imagine them as a safety net where buyers step in, preventing further decline.
Resistance Levels: Conversely, resistance levels (red line/shade) are where upward trends might stall due to increased selling interest. They act like a ceiling where sellers come in to push prices down.
Breakouts:
Bullish Breakout: When the price move
MUTHOOT FINANCE LTD S/RSupport and Resistance Levels:
Support Levels: These are price points (green line/shade) where a downward trend may be halted due to a concentration of buying interest. Imagine them as a safety net where buyers step in, preventing further decline.
Resistance Levels: Conversely, resistance levels (red line/shade) are where upward trends might stall due to increased selling interest. They act like a ceiling where sellers come in to push prices down.
Breakouts:
Bullish Breakout: When the price move
Muthoot Finance Long Trade on 15m Time Frame: Trade in ProgressA long entry was initiated at 1927.05 on the 9th of October at 10:15 am. The price is nearing Target 1 (1963.50) and remains on track for further movement towards the upper targets. We have now set a trailing stop at 1928.50 to lock in gains and manage risk.
Target Points:
TP 1: 1963.50 (close to being hit)
TP 2: 2022.50
TP 3: 2081.50
TP 4: 2117.95
Trailing Stop: 1928.50
Stop Loss (SL): 1897.55
We'll keep a close eye on this position as it progresses towards the remaining targets.