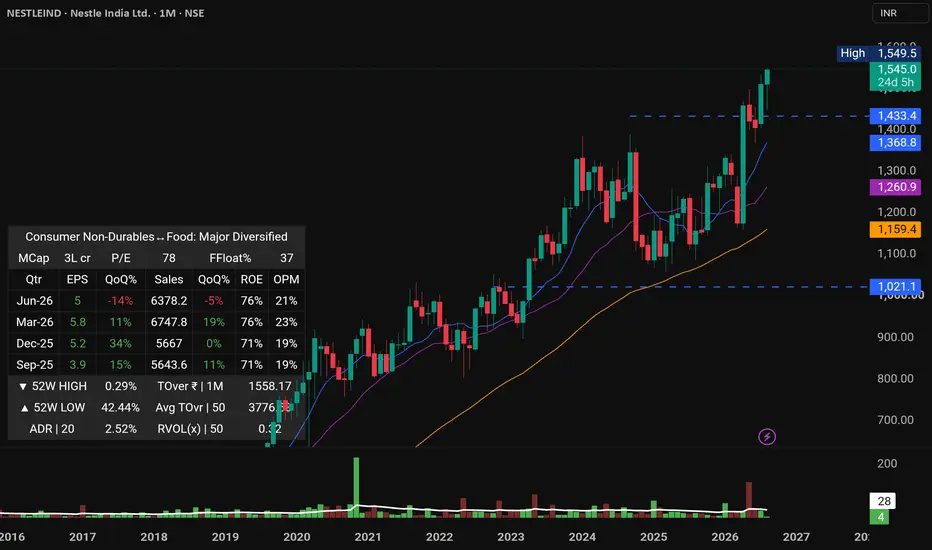
NESTLEINDNestle India Limited is a subsidiary of Nestle which is a Swiss MNC. The company operates in the Food segment.by akilan147930
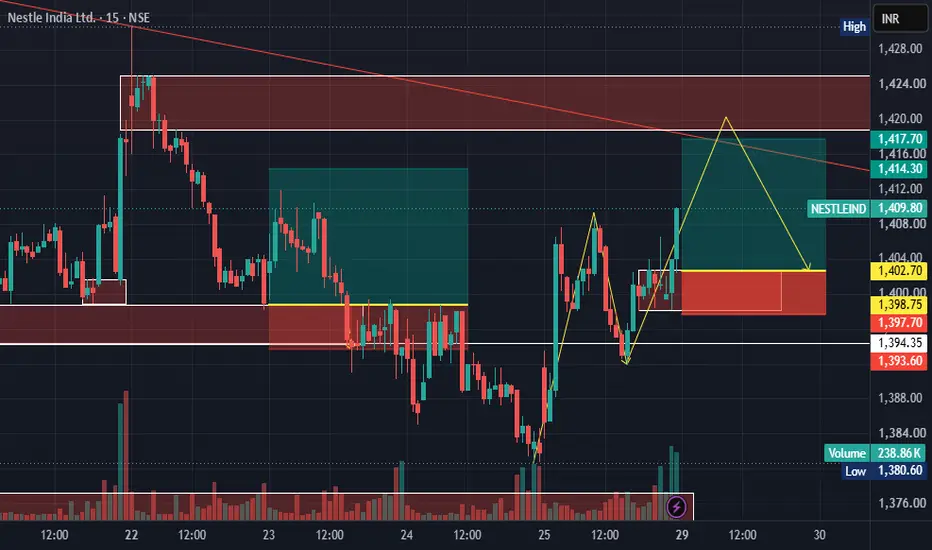
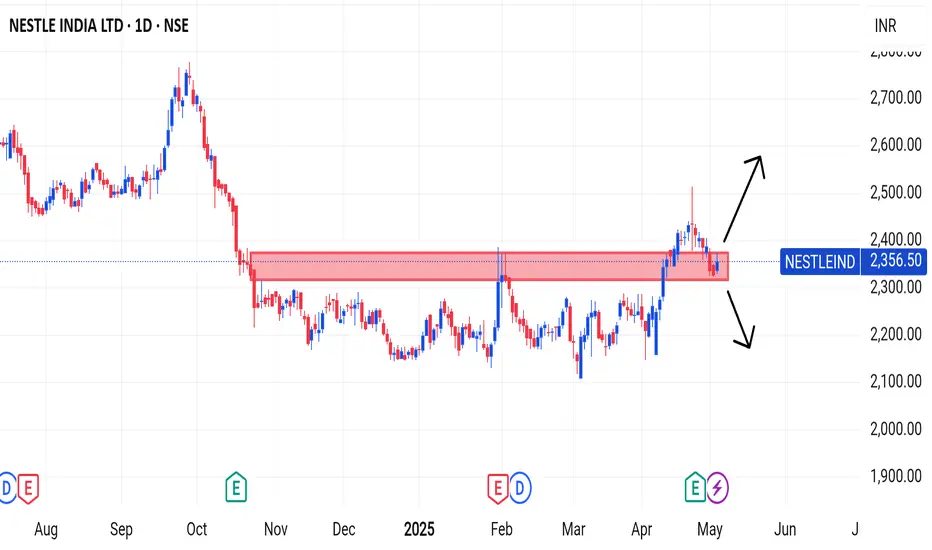
NESTILIND (D) CHARTFriends, these are the charts, where we haven't been able to make a buy or sell decision yet because the price hasn't broken out of the structure-defining range candle. That is why we cannot act right now; we need to wait for confirmation. Once the price breaks the zone and moves either up or down, we find a good trade setup. Friends, whenever the market breaks structure with a large candle, that candle holds significance (acting as support or resistance). We will consider or acknowledge a strby askbiswanath20250
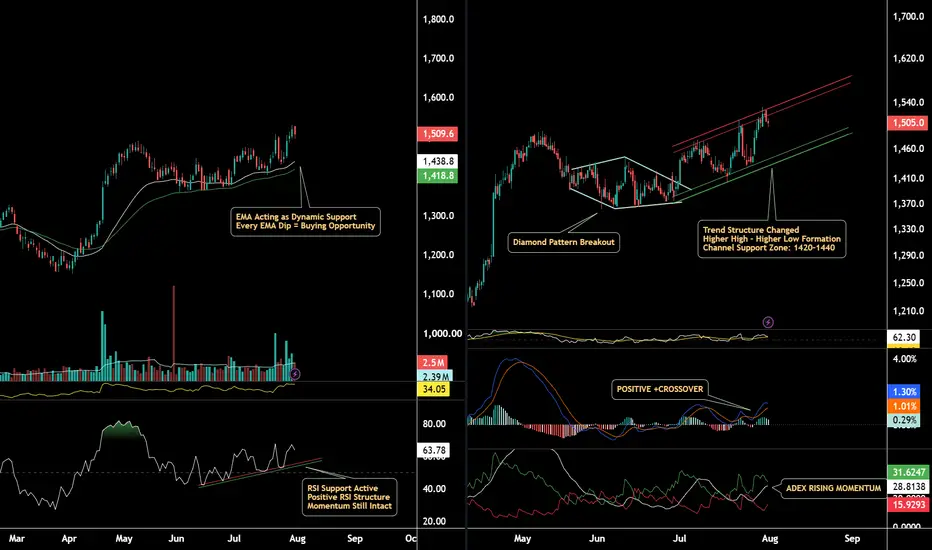
NESTLE INDIA: The Next Alpha Opportunity .....The stock has confirmed a bullish structural breakout after the Diamond Pattern, signaling a clear trend reversal. Price continues to trade above the EMA CROSSOVER, reinforcing a strong bullish bias while both EMAs act as dynamic demand zones. Momentum Check RSI is holding above 50 with a rising structure, reflecting healthy momentum and sustained buying strength. Every controlled dip continues to attract fresh demand, keeping the bullish trend intact. Key Demand Zone 1420–1440 remains the sLongby trailingtradesc85cd5c9f87345fb0
NESTLE INDIANestlé India Ltd. (CMP ₹1,471 NSE: NESTLEIND) Prepared by Sucrit Patil | The SmartWay Research Desk | 8 July 2026 A Gurugram‑based FMCG subsidiary of Nestlé S.A., incorporated in 1959. Nestlé India operates across packaged foods, dairy, beverages, and nutrition, with flagship brands like Maggi, Nescafé, KitKat, Milkmaid, Cerelac, and Everyday. Promoter Holding (Mar 2026): Nestlé S.A. — 62.76% stake (no pledges) --- FY22–FY26 Snapshot - Revenue Growth: FY26 revenue ₹20,842 Cr vs ₹18,912 Cr in FY2Longby TechnicalAnalystSucrit0
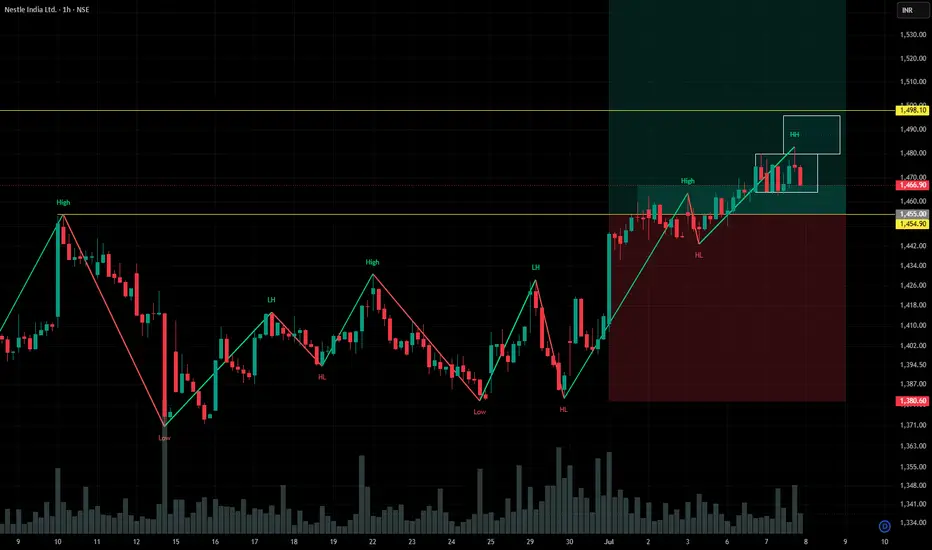
NESTLEIND expects uptrendCurrent trend is upside as HH and HL formed, with recent HH is broken. so expects uptrend.Longby NSB-GroProUpdated 1
NESTLEIND expects uptrendMajor trend is upside, minor trend is down. Dividend news also came yesterday, so expects a upside move. if candle strongly (SL Hit and) close below the support zone then expects a downtrend towards a major support zone.Longby NSB-GroProUpdated 0
"Nestlé at ₹1050–₹1070: Strong Support Meets Premium Valuation.1. Technical Overview Nestlé India is approaching a strong ₹1050–₹1070 demand zone, aligned with the Monthly 20 EMA. This is also Breakout level acted as strong support multiple times around 7 times in the past. Price is coming down from an overvalued zone and is now near fair value, making it more attractive for long-term entry. 2. Latest Fundamental Triggers Q1 FY26 Revenue ₹5,096 crore, up ~6% YoY – growth driven by urban demand Q1 FY26 Profit ₹647 crore, down ~13% YoY – due to higheLongby rahul25Updated 2
Nestle India weekly breakout if weekly breakout sustains , 1st probable target (resistance) will be - 1550-1570Longby kalyanadak0093
NSE – NIFTY 750 | Nestlé India Ltd | Structural Assessment | 17Monthly structural assessment under NIFTY 750 – Structure Census. Secular advance with regime-stable impulse structure observed. Current phase: Mature impulse with prolonged higher-range consolidation. Long-term rising base intact. Structure preserved. Educational study only — not a recommendation. #NIFTY750 #StructureCensus #MarketStructure #EquityStructureby kacraj0
NESTLEIND LONG TRADETrade Setup: Nestle IND long trade as weekly income trade. Logic: NESTLEIND is in uptrend on the daily time frame. and also in line with an up flag pattern. A dip to 1233.35 levels should be considered as buying opportunity as a demand zone can be identified on a 2 hrly time frame. RR: 1:3. Entry: 1233.35 Stop: 1205.95 Target: 1313.45. # Maintain proper position size as per your risk management.Longby the_sailor_traderUpdated 46
NESTLE – RETEST DONE, READY FOR NEXT LEG UP🥛 NESTLE – RETEST DONE, READY FOR NEXT LEG UP Nestle recently broke out from an Inverse Head & Shoulder pattern. After the breakout, the stock came back for a perfect retest of the neckline — and is now bouncing again, confirming strength. 📊 Technical Snapshot: • Clear IHS breakout • Retest successful (healthy price action) • Fresh momentum building above key support • Structure turning bullish for positional move 💰 Trade Plan: • CMP: ₹1282 • Stop Loss: ₹1170 • Target 1: ₹1320 • Target 2: ₹13Longby satyam153
Nestle Swing CandidateChart Analysis : Price making a decending triangle breakout pattern of day tf while taking support on 1255-1260 zone. Charts looks good to go long. Key Levels : Entry : At day close 1275-1280 Support : 1255-1260 Resistance : 1288/1300/1310 SL : Day close below 1255 Targets will be as per risk and emotion Disclaimer: I am not SEBI registered. This analysis is for educational purposes only and not investment advice. Please do your own research before trading or investing. Longby itradeassets092
NESTLEIND - RISING WEDGE PATTERN BREAKOUT [ SELL SIDE ]I am not a SEBI-registered investment advisor. The information provided here is for educational and informational purposes only and should not be construed as financial or investment advice. Please do your own research or consult with a SEBI-registered financial advisor before making any investment decisions. Investments in the securities market are subject to market risks. Read all the related documents carefully before investing.Shortby Data2Dreams1
Nestle India Buy Alert – Golden Opportunity for InvestorsNestle India – Technical Update Timeframe: 1-Hour Chart Price Action: Nestle India is trading within a well-defined parallel channel. Support Zone: Currently sustaining above the 1170–1180 LOP support zone. Outlook: If the stock holds this level, we may witness upside momentum. Potential Target: 1280–1290 near the channel resistance. Thank you!Longby FiveCircles2
#NESTLEIND - 250 Points Move?Date: 23-08-2025 #NestleInd - Current Price: 1162.9 Pivot Point: 1127 Support: 1079 Resistance: 1176 Upside Targets: -------------------------------- | Target | Price | --------------------------------- | 🎯 Target 1 | 1237 | | 🎯 Target 2 | 1298 | | 🎯 Target 3 | 1362 | | 🎯 Target 4 | 1426 | Downside Targets: -------------------------------- | Target | Price | --------------------------------- | 🎯 Target 1 by Micro_trades123Updated 0
NESTLEINDIAi Observed these Levels based on Price Action and Demand & Supply which is my own Concept "PENDAM CONCEPTS"... Please don't take any trades based on this chart/post... Because this chart is for educational purpose only not for Buy or Sell Recommendation... Thank QLongby mistertraderofficial15
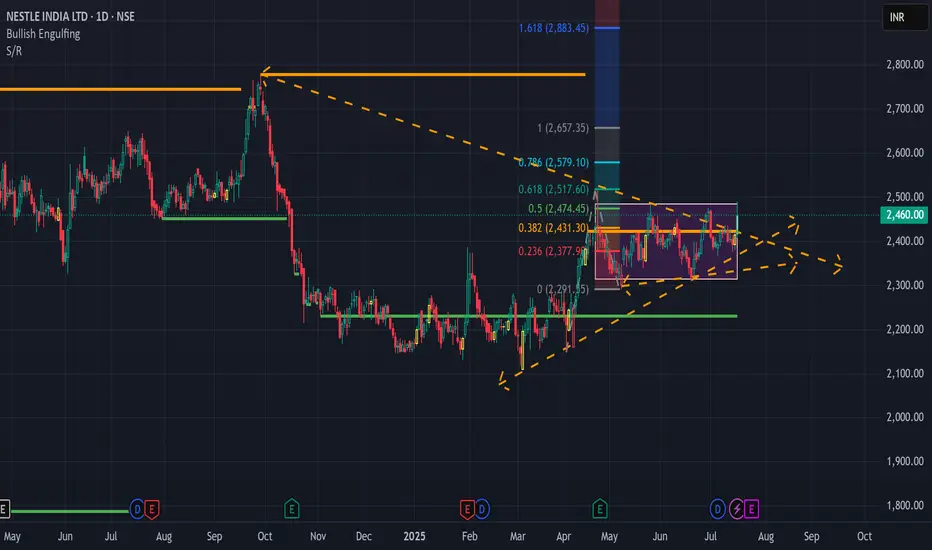
Nestle India in BreakoutNSE:NESTLEIND shows a breakout of a bullish ascending traingle trend. You can enter at 2460 and Target for 2640.by ProfitPearlUpdated 1
Nestle India, Breakout, 1D, LongNestle India tried to break the resistance at 2480 but failed multiple times. If it breaks this level of 2480 with Bullish candlestick patterns like Bullish Engulfing, Hammer & Inverted Hammer, Piercing Line, Morning Star, Three White Soldiers, Tweezer Bottoms or Bullish Harami, then a trade can be planned in it with target of 2530 and 2580. Entry: 2480 (after Bullish Candlestick pattern) Target1: 2530 Target2: 2580. SL 2450Longby redhatbuddy9
Nestle indiaconsolidation on WTF. with tight range also supported by20 & 200 MA. very low risk entry available on this trade see the analysis. swing trade for 2 months atleast entry on current price near 4400 SL 3800 Target 6000Longby DEVA435Updated 1
#Nestle - Pivot Point is 2423.50 Date: 06-06-2025 #Nestle Current Price: 2415 Pivot Point: 2423.50 Support: 2378.05 Resistance: 2469.29 Upside Targets: Target 1: 2513.39 Target 2: 2557.50 Target 3: 2607.75 Target 4: 2658.00 Downside Targets: Target 1: 2333.78 Target 2: 2289.5 Target 3: 2239.25 Target 4: 2189.00 by Micro_trades123Updated 1
NESTLE INDIA SWING TRADE SETUP📊 Price Action & Trend Analysis Analyzing market trends using price action, key support/resistance levels, and candlestick patterns to identify high-probability trade setups. Always follow the trend and manage risk wisely! Price Action Analysis Interprets Market Movements Using Patterns And Trends On Price Charts. 👉👉👉Follow us for Live Market Views/Trades/Analysis/News Updates.Longby GohelPrakasha1
Nestle for short term is in upmove soon will reach 2489NESTLE Is showing strong momentum and hope soon it will touch 2489, lets see Longby ATULTONE6969Updated 11
NESTLE INDIA If the price bounces from this support, the next resistance level could be around 2,450–2,500. If the price breaks this support, it would be a bearish breakdown, and the price could fall to 2,250 or even lower. If you find this helpful and want more FREE forecasts in TradingView, Hit the 'BOOST' button Drop some feedback in the comments below! (e.g., What did you find most useful? How can we improve?) Your support is appreciated! Now, it's your turn! Be sure to leave a comment; let us knoby milanpatel0073