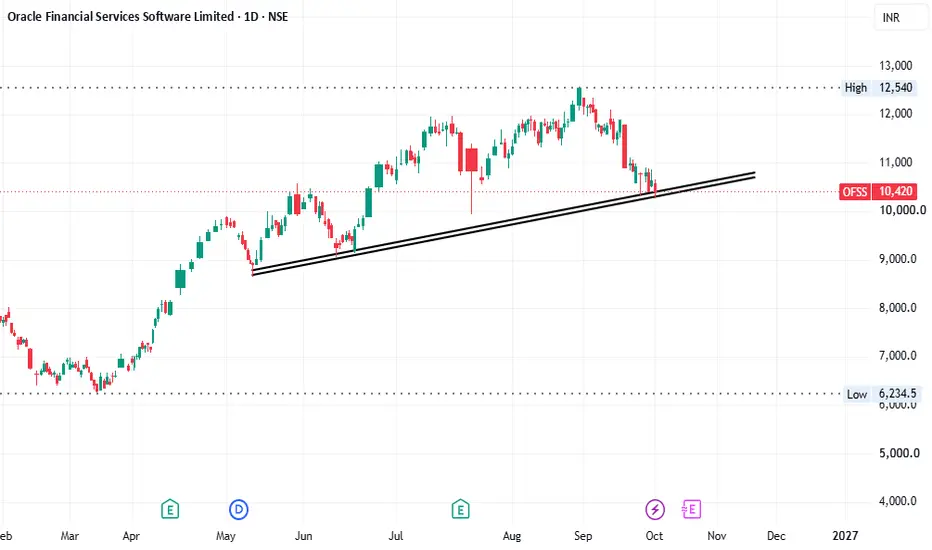
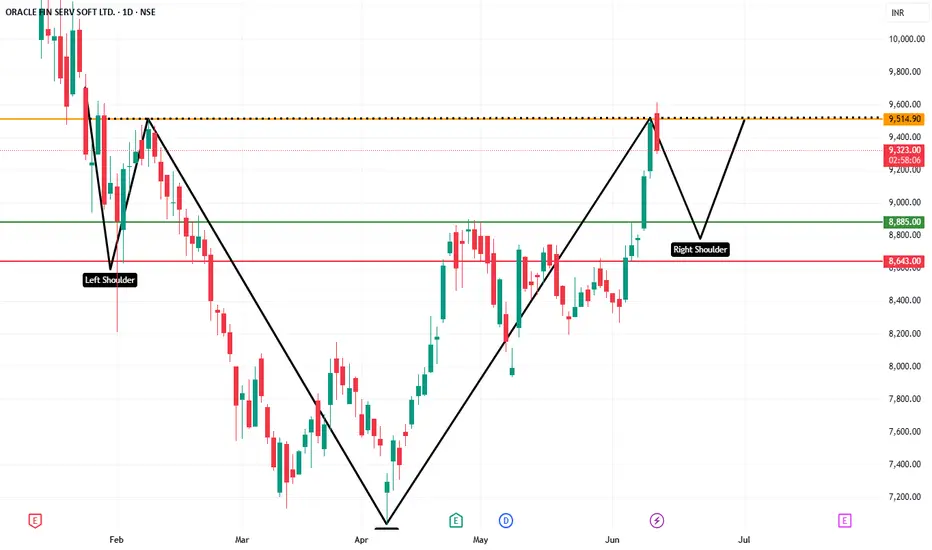
OFSS: Back at Long-Term Trendline SupportDescription:
OFSS has respected a rising trendline for months, with each dip finding buyers on this line.
After a sharp fall from the recent high, price is now back on that trendline support.
What to watch:
Holds the trendline and bounces: the higher-low structure stays intact, and the uptrend r
Oracle Financial Services Software Limited
No trades
No trades
Compare with Oracle Financial Services Software Limited
410.05 INR
26.39 B INR
76.72 B INR
24.03 M
Last report date
—
Report period
—
EPS
—
Revenue
—
Company info
Sector
Industry
CEO
Avadhut Ketkar
Website
Headquarters
Mumbai
Founded
1989
IPO date
Jun 28, 2002
ISIN
INE881D01027
FIGI
BBG000F48MC4
Identifiers
ISIN INE881D01027
Oracle Financial Services Software Ltd. is a holding company, which engages in development, sale, and market of computer software and computer systems; and provision of consultancy and other information technology related activities. It operates through the following segments: Product Licenses and Related Activities; and IT Solutions and Consulting Services. The Product Licenses and Related Activities segment deals with banking software products. The IT Solutions and Consulting Services segment offers services comprising the entire lifecycle of applications used by financial service institutions. The company was founded on September 27, 1989 and is headquartered in Mumbai, India.
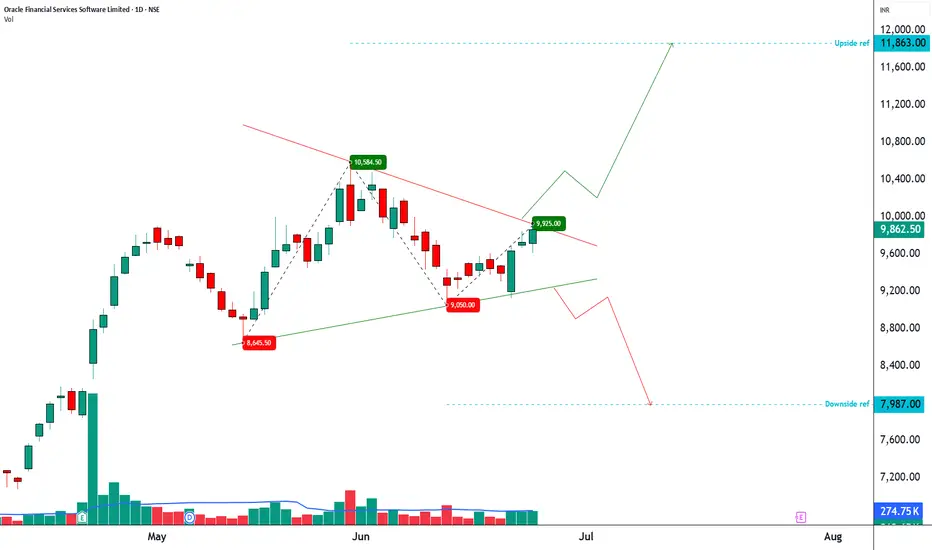
OFSS: Volatility Coiling for an Imminent 1,938-Point Move!🔥 OFSS: Volatility Coiling for an Imminent 1,938-Point Move! 🚀
Oracle Financial Services Software Limited (OFSS) is currently trading at a critical decision point as price compresses into the apex of a well-defined Symmetrical Triangle. With volatility steadily contracting and structure tightening
OFSS – Momentum Expansion Near Resistance | Breakout or Pullback📊 Oracle Financial Services Software Ltd – STWP Equity Snapshot
Ticker: NSE: OFSS
Sector: IT / Financial Software
CMP: 8,126 ▲ (+2.46%)
Learning Rating: ⭐⭐⭐⭐☆ (Momentum Expansion Near Resistance)
Chart Pattern Observed: Trend Continuation with Breakout Leg
Candlestick Context: Bullish Piercing + St
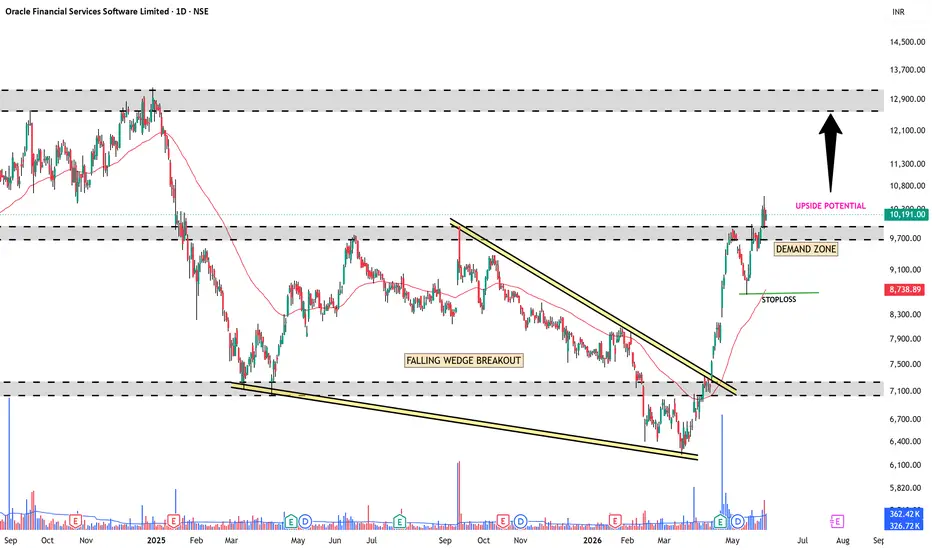
OFSS – Cup & Handle on Weekly TFMarket Cap: ₹80,550 Cr
Fundamentals – Slight profit growth (2023–25), DII reducing stake, FII mixed.
Price Action:
2021 breakout at ₹4,300 → Rally till ₹13,220 (ATH).
Corrected 47% to ₹6,675 (major support).
Now forming Cup & Handle.
Resistance = ₹9,960.
➡ Breakout above ₹9,960 = Potential ra
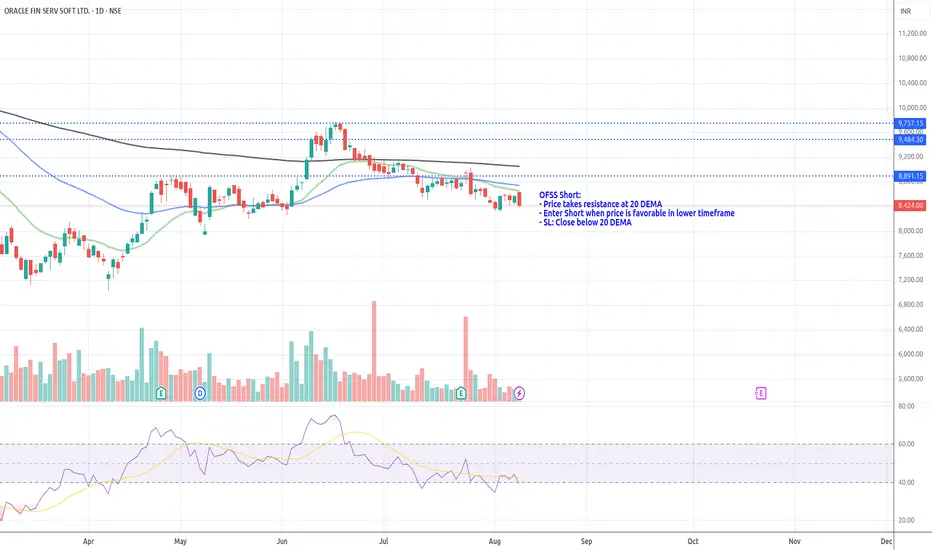
ofss rsi breakout cmp : 9030
stoploss : weekly closing below 8780
target :10400
Disclaimer:
This publication is strictly for educational and informational purposes only and should not be construed as investment advice, a trading recommendation, or a solicitation to buy or sell any securities. The analysis and
See all ideas
Summarizing what the indicators are suggesting.
Neutral
Neutral
Neutral
An aggregate view of professional's ratings.
Neutral
Neutral
Neutral
Displays a symbol's price movements over previous years to identify recurring trends.
Frequently asked questions
The current price of OFSS is 9,938.00 INR — it has decreased by −0.42% in the past 24 hours. Watch Oracle Financial Services Software Limited stock price performance more closely on the chart.
Depending on the exchange, the stock ticker may vary. For instance, on BSE exchange Oracle Financial Services Software Limited stocks are traded under the ticker OFSS.
OFSS stock has risen by 1.27% compared to the previous week, the month change is a −4.91% fall, over the last year Oracle Financial Services Software Limited has showed a 16.20% increase.
We've gathered analysts' opinions on Oracle Financial Services Software Limited future price: according to them, OFSS price has a max estimate of 14,600.00 INR and a min estimate of 11,750.00 INR. Watch OFSS chart and read a more detailed Oracle Financial Services Software Limited stock forecast: see what analysts think of Oracle Financial Services Software Limited and suggest that you do with its stocks.
OFSS reached its all-time high on Dec 30, 2024 with the price of 13,203.60 INR, and its all-time low was 380.00 INR and was reached on May 17, 2004. View more price dynamics on OFSS chart.
See other stocks reaching their highest and lowest prices.
OFSS stock is 2.10% volatile and has beta coefficient of 0.68. Track Oracle Financial Services Software Limited stock price on the chart and check out the list of the most volatile stocks — is Oracle Financial Services Software Limited there?
Today Oracle Financial Services Software Limited has the market capitalization of 869.64 B, it has decreased by −4.04% over the last week.
Yes, you can track Oracle Financial Services Software Limited financials in yearly and quarterly reports right on TradingView.
Oracle Financial Services Software Limited is going to release the next earnings report on Jan 20, 2027. Keep track of upcoming events with our Earnings Calendar.
OFSS net income for the last quarter is 7.02 B INR, while the quarter before that showed 14.15 B INR of net income which accounts for 0.00% change. Track more Oracle Financial Services Software Limited financial stats to get the full picture.
As of Oct 31, 2026, the company has 9.15 K employees. See our rating of the largest employees — is Oracle Financial Services Software Limited on this list?
EBITDA measures a company's operating performance, its growth signifies an improvement in the efficiency of a company. Oracle Financial Services Software Limited EBITDA is 47.28 B INR, and current EBITDA margin is 46.14%. See more stats in Oracle Financial Services Software Limited financial statements.
Like other stocks, OFSS shares are traded on stock exchanges, e.g. Nasdaq, Nyse, Euronext, and the easiest way to buy them is through an online stock broker. To do this, you need to open an account and follow a broker's procedures, then start trading. You can trade Oracle Financial Services Software Limited stock right from TradingView charts — choose your broker and connect to your account.
Investing in stocks requires a comprehensive research: you should carefully study all the available data, e.g. company's financials, related news, and its technical analysis. So Oracle Financial Services Software Limited technincal analysis shows the sell today, and its 1 week rating is neutral. Since market conditions are prone to changes, it's worth looking a bit further into the future — according to the 1 month rating Oracle Financial Services Software Limited stock shows the buy signal. See more of Oracle Financial Services Software Limited technicals for a more comprehensive analysis.