My View on ONGC — Daily Chart**1. Key Observation**
ONGC is moving towards an important demand zone around **₹238–₹241**.
The **May 29 candle** initiated heavy buyer activity, which looks like possible absorption from lower levels. On **Jun 4**, price created resistance, acting like a **dynamic pivot**.
Now price is coming back near the support area, and the **Jan 9 candle wick zone** can act as an important support reference. Also, near **₹261**, a Fair Value Gap is visible, which can act as the first upside magnet if reversal starts.
**2. My View**
I am not looking to chase at the current level. My buy interest starts only if ONGC comes near **₹241** and shows support / buyer reaction.
If buyers defend this zone, ONGC can give a short-term reversal move.
**3. Invalidation**
The setup becomes invalid if ONGC gives a **daily candle close below ₹238**.
**4. Risk-Reward**
Entry near **₹241**, SL below **₹238**, and target near **₹262** gives approx **1:7 risk-reward**, which makes this setup attractive for a long-side study.
**5. Target Point / Range**
Target: **₹262**
Extended range: **₹268** if momentum continues.
**6. Why It’s Good for Long**
This is good for a long setup because price is coming into a demand zone, risk is small, and upside room is bigger compared to the stop-loss. The chart also shows possible buyer absorption near lower levels.
**7. Time Period**
This view is mainly for the **July contract**, if planning through options. Since it is an option trade setup, entry timing and support confirmation near **₹241** are very important.
I am not a SEBI-registered analyst. This idea is shared purely for educational and study purposes. Please do your own analysis or consult a certified financial advisor before taking any trades.
#ONGC #VPA #VolumeProfile #PriceAction #FairValueGap #SupportAndResistance #OptionsTrading #JuneContract #IndianStockMarket
In-depth trading ideas
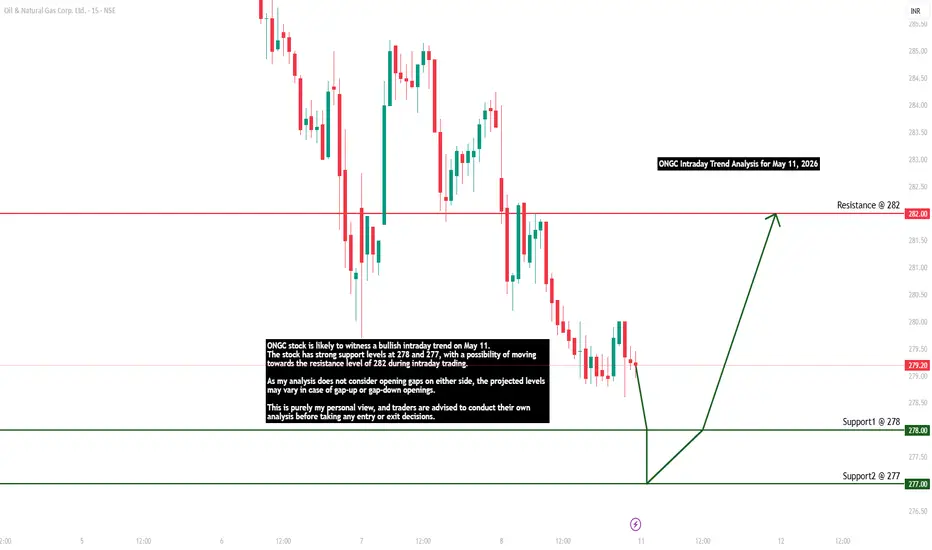
ONGC Intraday Trend Analysis for May 11, 2026ONGC stock is likely to witness a bullish intraday trend on May 11.
The stock has strong support levels at 278 and 277, with a possibility of moving
towards the resistance level of 282 during intraday trading.
As my analysis does not consider opening gaps on either side, the projected levels
may vary in case of gap-up or gap-down openings.
This is purely my personal view, and traders are advised to conduct their own
analysis before taking any entry or exit decisions.
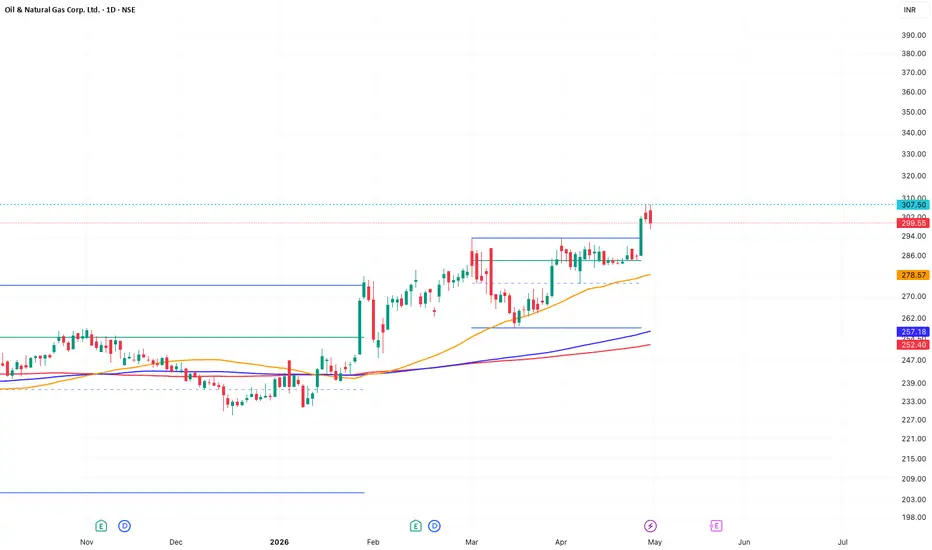
ONGC ready for possible all-time high move after strong technica🔥 ONGC ready for possible all-time high move after strong technical setup.
📌 CMP: ₹298
📌 SL: ₹280 (closing basis)
🎯 Targets:
316 / 322 / 344
📈 Technical View:
✅ Cup & Handle pattern formed on daily chart or VCP pattern breakout
✅ Breakout triggered above ₹293 zone
✅ Dips near ₹291 can be buying opportunity in volatility
✅ Structure supports fresh upside momentum
✅ Energy theme may benefit from crude strength
⚠️ Strategy:
Stock is news driven — take staggered entries only and avoid full quantity at one time. Strictly respect stop loss and control position sizing.
💡 Sustaining above ₹298 can trigger next leg towards ₹316+ quickly.
🌍 Key Trigger:
Move depends a lot on crude oil prices and international/global news flow.
🔔 Notification:
Options are risky instruments. Be careful with fund size and position sizing. Trades shared are based purely on technical analysis and personal study.
⚠️ Clarification:
This is an independent analysis based purely on technical and market study. No part of Religare is involved in this view or recommendation.
📝 Important:
I am not responsible for any loss or profit incurred. I am not taking any fees for these views – just sharing my analysis for educational and informational purposes.
📉 Disclaimer: Not SEBI-registered. Please do your own research or consult a financial advisor before taking any investment decision.
ONGC: Bullish Continuation Setup After Buy-Side Liquidity SweepMarket Structure Analysis
ONGC formed a strong bullish ascending channel with multiple higher highs and higher lows. However, price recently swept liquidity above the previous swing high and faced sharp rejection from the upper resistance trendline.
The rejection from the premium zone indicates possible exhaustion of bullish momentum. Price is now retesting the rising support trendline, which is a critical decision area for the next directional move.
The current structure suggests a potential bearish breakdown setup if price loses the ascending trendline support with strong bearish confirmation.
Key Bearish Observations
Buy-side liquidity sweep above previous highs
Strong rejection from upper channel resistance
Failure to sustain above breakout area
Weakening bullish momentum near premium zone
Price revisiting key ascending support
Potential bearish BOS if support breaks
Bearish Trade Plan
Entry Zone
275.85
Stop Loss
307.45
Target 1
258.35
Target 2
231.00
Bearish Confirmation Conditions
The bearish setup becomes stronger if:
Price closes decisively below the ascending trendline
Bearish displacement candles appear
Minor support structure breaks
Volume increases during breakdown
Invalidation
The bearish view becomes invalid if price:
reclaims the ascending trendline strongly
forms bullish displacement from support
closes back above recent swing highs
Conclusion
This setup represents a potential counter-trend bearish opportunity after a liquidity sweep and rejection from the upper resistance zone. The ascending trendline is the key level to monitor for confirmation of further downside continuation.
ONGC Breakout
ONGC Price has came out of its range post its long consolidation since October 2024.
Formation of base over base, and then breakout.
Current Price > 50 > 150 > 200 SMA.
Initiative moves by buyers, rally on volume and rest in consolidation.
During the rest period the price has contracted on the right side and on the top end of the consolidation phase.
Relative strength has gotten better in mid and short term.
Also, the Nifty Oil and Gas Index structure looking relatively stronger over mid and short term.
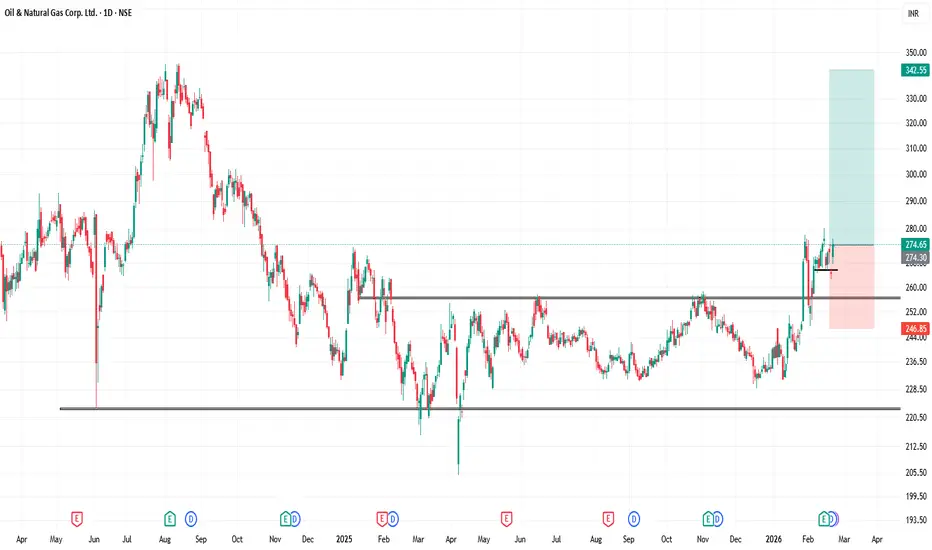
Ongc strategy for 04-02-26ONGC it is engaged in exploring, production of crudeoil, natural gas, value added products. Surge in crude oil prices is benifit to upstream oil companies like ONGC, OIL INDIA Etc. As per technical analysis Cup with Handle formation formed in in this stock and break out occurred in yesterday trading session with good volumes. So I am expecting northward journey from here in this stock. Investors can added this to their portfolios with strict stop loss and target which are mentioned below.
Buy price (CMP for risky traders )
(284 for safe traders )
1st Target : 294
2nd target : 320
Stop loss : 270 on daily closing price basis
Disclaimer : I am not a SEBI Reasearch Analyst please take an advise from your financial advisor before take position based on my recommendation
Thanking you for your support if you liked my content suggest to your friends to follow my channel
NSE – NIFTY 750 | ONGC | 12 Feb 2026Monthly structural assessment of ONGC under the NIFTY 750 Structure Census framework.
Cyclical range → structural breakdown → post-2020 recovery regime observed.
Price currently trades within a long-term range environment.
No confirmed structural breakout beyond historical resistance zone yet.
This is a structural update, not a directional call.
Disclaimer:
For educational and structural study purposes only. Not investment advice.
#NIFTY750 #StructureCensus #ONGC #Energy #OilAndGas #PSU #MarketStructure #LongTermView #EquityAnalysis
Breakout Retest Holding Above Resistance in ONGCNSE:ONGC has delivered a strong breakout above the long‑standing resistance near 270–272, followed by a quick pullback and stabilization. Instead of collapsing back into the range, price is holding above the breakout zone, which is a bullish sign of acceptance.
The sharp impulse candle with heavy volume shows aggressive participation, and the current tight consolidation suggests the market is preparing for a continuation move rather than a reversal.
📝 Trade Plan:
✍🏻 Entry: Fresh entry can be planned near 268–272 on signs of bounce or strength.
🚩Stop-Loss: 258–260 (below the retest zone).
🎯Targets:
Target 1 → 300 (psychological resistance).
Target 2 → 320–325 (measured move projection, ~18–20% upside).
💡Pyramiding Strategy:
- Enter first lot near 270.
- Add above 285 on momentum continuation, trail SL to 270.
- Add final lot above 300 breakout, trail SL to 285.
Hold as long as the stock sustains above the breakout base.
Keep Learning. Keep Earning.
Let’s grow together 📚🎯
🔴Disclaimer:
This is not an investment advice. Always do your own due diligence before making any trading or investment decision.
ONGC Looking for a strong bullish momentumIn 1D TF, there has been a lot of re-accumulation after a downtrend. Level 230 is strong; it has been tested around 6 times in the past 7 months. Level 260-280 looks like another zone for consolidation. Breakout at level 280 with strong volume,indicates a strong bullish rally till 300-305 level.
ONGC Swing Trade Setup📊 Price Action & Trend Analysis
Analyzing market trends using price action, key support/resistance levels, and candlestick patterns to identify high-probability trade setups.
Always follow the trend and manage risk wisely!
Price Action Analysis Interprets Market Movements Using Patterns And Trends On Price Charts.
👉👉👉Follow us for Live Market Views/Trades/Analysis/News Updates.
ONGC Ltd – Breakout Retest in ProgressONGC Ltd – Breakout Retest in Progress
NSE:ONGC
📈 Pattern & Setup:
ONGC has been showing a consistent bullish structure with higher lows and a breakout attempt above the key resistance zone around 254–256. The recent breakout candle was supported by a healthy volume spike, signaling genuine buying interest from institutions.
After the breakout, the stock pulled back slightly to retest the breakout zone — a typical price behavior before continuation. This retest phase is crucial as it often separates short-term traders from strong holders.
If the stock sustains above 254 with volume confirmation, it may start its next leg toward 282–285 levels, aligning with its 9.88% projected move from the breakout range.
📝 Trade Plan:
✍Entry: Above 257 (confirmation after retest)
🚩Stop-Loss: 246 (below recent swing low)
🎯Targets:
Target 1 → 270
Target 2 → 282 (around 10% potential move)
💡 Pyramiding Strategy:
1. Enter 60% above 257 after confirmation of retest
2. Add 40% above 262 once strong volume returns
3. Trail stop-loss to 252 once the stock trades above 270
Keep Learning. Keep Earning.
Let’s grow together 📚🎯
🔴Disclaimer:
This analysis is for educational purposes only. Not a buy/sell recommendation. Please do your own research or consult your financial advisor before trading.
ONGCTrend:
From 2020 lows (~₹50), ONGC rallied sharply to ~₹345 (2022 peak).
Since then, it has been in a corrective downtrend, now stabilizing near ₹205–₹230.
Still inside a rising channel (support & resistance lines drawn).
Support Levels:
Strong support near ₹200–205 (trendline + horizontal level).
If broken, next support lies around ₹175–180.
Resistance Levels:
Immediate resistance near ₹230–235 (horizontal + channel mid-zone).
Higher resistance near ₹275–280, then ₹320–345 (all-time high).