Can PFC replicate AXISBANK's June Price action in July?
TF: 75 minutes
CMP: 437
The detailed comparison between Axis Bank and PFC chart's price action are explained within the charts.
Copied below is the chart of Axis Bank
As you can see, the price structure of PFC is almost exhibiting the exact nature that of the Axis bank..
Let's see if July wil
Compare with Power Finance Corporation Limited
78.95 INR
259.01 B INR
1.07 T INR
1.45 B
Next report date
—
Report period
—
EPS estimate
—
Revenue estimate
—
Company info
Sector
Industry
CEO
Parminder Chopra
Website
Headquarters
New Delhi
Founded
1986
IPO date
Feb 21, 2007
ISIN
INE134E01011
FIGI
BBG000BXJHF0
Identifiers
ISIN INE134E01011
Power Finance Corp. Ltd. is a non-banking financial company, which engages in the provision of financial assistance to the power and allied infrastructure sectors. It offers fund-based and non-fund-based financial assistance, and fee-based technical advisory and consultancy services. The company was founded on July 16, 1986 and is headquartered in New Delhi, India.
PFC – Bullish Continuation Setup Near ₹420 Zone (Buy on Dips)**The price has shown a steady recovery from lower levels and is currently trading around the ₹415–₹420 zone. The structure indicates strength as the stock sustains above support, suggesting a potential continuation of the uptrend if momentum holds.
The key demand/support zone lies near ₹398 – ₹405,
PFC: Daily Ascending Triangle High Conviction Breakout WatchPFC is currently consolidating within a classic Ascending Triangle on the daily chart. While the stock has faced consistent selling pressure near the ₹374–₹380 resistance zone, the rising support line confirms that the bulls are absorbing all available supply at higher prices.
This structure reflec
Unlocking Potential: Power Finance Corporation Analysis! 💼📈Traders, let's delve into Power Finance Corporation today ! 🌟 In the daily timeframe, we're witnessing a range-bound movement, with the price testing previous swing highs. 🔄 Anticipate a breakout above this level(red box), potentially targeting Rs. 450 and beyond. But before that it may come around
Power Finance Corporation Ltd for 9th Oct #PFC Power Finance Corporation Ltd for 9th Oct #PFC
Resistance 403 Watching above 404 for upside momentum.
Support area 398 Below 398 gnoring upside momentum for intraday
Watching below 398 for downside movement...
Above 403 gnoring downside move for intraday
Charts for Educational purposes only.
Ple
Power Finance Corporation Ltd for 6th Oct #PFC Power Finance Corporation Ltd for 6th Oct #PFC
Resistance 415 Watching above 416 for upside momentum.
Support area 408-410 Below 410 gnoring upside momentum for intraday
Watching below 407 for downside movement...
Above 415 ignoring downside move for intraday
Charts for Educational purposes only
PFC , 1W Breakout In this stock we clearly see the Channel pattern is formed and Ready for Breakout , Wait for candle Close in 1D with good volume , then we can see very good move up to 35% nearly .
As now nifty is given Breakout from 1D Channel pattern and in Market Breadth 1D has given breakout and in weekly marke
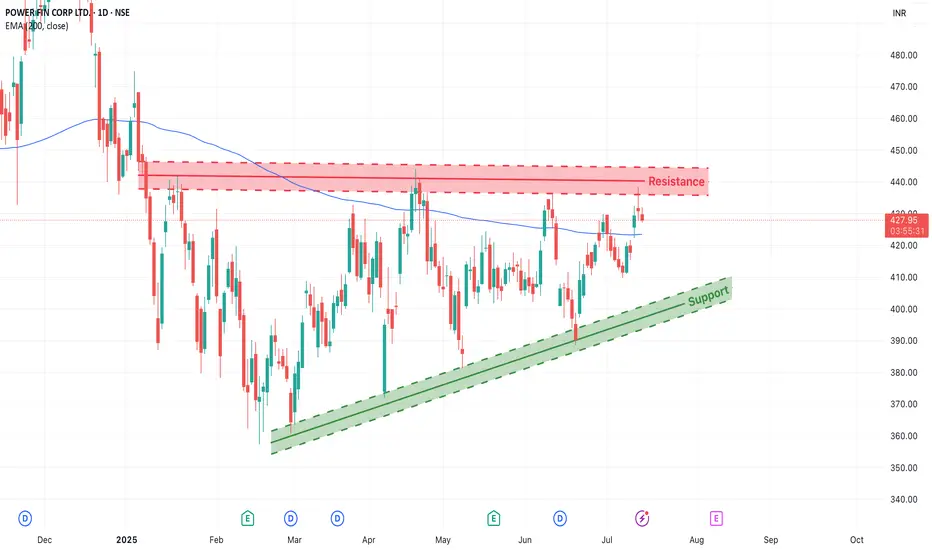
PFC– At Resistance with Ascending Triangle PatternPower Finance Corporation (NSE: PFC) is forming a technically clean structure — trading within a rising trend channel and now testing a critical resistance zone around ₹430–₹440.
This is a make-or-break level, and the market could tip in either direction depending on how price reacts this week.
1.
See all ideas
Summarizing what the indicators are suggesting.
Neutral
Neutral
Neutral
An aggregate view of professional's ratings.
Neutral
Neutral
Neutral
Displays a symbol's price movements over previous years to identify recurring trends.
Maturity dateApr 23, 2030
Coupon3.95% (Fixed)
Maturity dateSep 21, 2028
Coupon1.84% (Fixed)
See all PFC bonds
Frequently asked questions
The current price of PFC is 330.15 INR — it has decreased by −2.52% in the past 24 hours. Watch Power Finance Corporation Limited stock price performance more closely on the chart.
Depending on the exchange, the stock ticker may vary. For instance, on BSE exchange Power Finance Corporation Limited stocks are traded under the ticker PFC.
PFC stock has fallen by −3.75% compared to the previous week, the month change is a −7.24% fall, over the last year Power Finance Corporation Limited has showed a −18.48% decrease.
We've gathered analysts' opinions on Power Finance Corporation Limited future price: according to them, PFC price has a max estimate of 520.00 INR and a min estimate of 410.00 INR. Watch PFC chart and read a more detailed Power Finance Corporation Limited stock forecast: see what analysts think of Power Finance Corporation Limited and suggest that you do with its stocks.
PFC stock is 2.93% volatile and has beta coefficient of 0.91. Track Power Finance Corporation Limited stock price on the chart and check out the list of the most volatile stocks — is Power Finance Corporation Limited there?
Today Power Finance Corporation Limited has the market capitalization of 1.12 T, it has increased by 0.46% over the last week.
Yes, you can track Power Finance Corporation Limited financials in yearly and quarterly reports right on TradingView.
Power Finance Corporation Limited is going to release the next earnings report on Nov 5, 2026. Keep track of upcoming events with our Earnings Calendar.
PFC earnings for the last quarter are 14.38 INR per share, whereas the estimation was 12.22 INR resulting in a 17.68% surprise. The estimated earnings for the next quarter are 14.99 INR per share. See more details about Power Finance Corporation Limited earnings.
Power Finance Corporation Limited revenue for the last quarter amounts to 54.92 B INR, despite the estimated figure of 57.09 B INR. In the next quarter, revenue is expected to reach 64.88 B INR.
PFC net income for the last quarter is 70.12 B INR, while the quarter before that showed 69.99 B INR of net income which accounts for 0.00% change. Track more Power Finance Corporation Limited financial stats to get the full picture.
Yes, PFC dividends are paid quarterly. The last dividend per share was 3.90 INR. As of today, Dividend Yield (TTM)% is 5.54%. Tracking Power Finance Corporation Limited dividends might help you take more informed decisions.
Power Finance Corporation Limited dividend yield was 4.89% in 2025, and payout ratio reached 23.63%. The year before the numbers were 3.81% and 22.68% correspondingly. See high-dividend stocks and find more opportunities for your portfolio.
As of Sep 29, 2026, the company has 777 employees. See our rating of the largest employees — is Power Finance Corporation Limited on this list?
EBITDA measures a company's operating performance, its growth signifies an improvement in the efficiency of a company. Power Finance Corporation Limited EBITDA is 575.84 B INR, and current EBITDA margin is 97.83%. See more stats in Power Finance Corporation Limited financial statements.
Like other stocks, PFC shares are traded on stock exchanges, e.g. Nasdaq, Nyse, Euronext, and the easiest way to buy them is through an online stock broker. To do this, you need to open an account and follow a broker's procedures, then start trading. You can trade Power Finance Corporation Limited stock right from TradingView charts — choose your broker and connect to your account.
Investing in stocks requires a comprehensive research: you should carefully study all the available data, e.g. company's financials, related news, and its technical analysis. So Power Finance Corporation Limited technincal analysis shows the strong sell today, and its 1 week rating is strong sell. Since market conditions are prone to changes, it's worth looking a bit further into the future — according to the 1 month rating Power Finance Corporation Limited stock shows the sell signal. See more of Power Finance Corporation Limited technicals for a more comprehensive analysis.