
 Long
LongIn-depth trading ideas
Long
POWERGRIDThere is 2 posibility's for down and up also. Cant predict exact 1st direction Due to triangle pattern breakout. lets see which one is trigger first.

POWERGRID expects upmoveexpects small upmove of current minor uptrend. Recent high is broken and major resistance zone is waiting to retest.
Long Short
Short
POWERGRID expects uptrendCurrent trend uptrend, liquidity zone responded properly. Upmove expects from prev HL.
Long Short
Short
POWERGRID expects upsidePowergrid expects to travel upside with key support of key zone. There is 2 plan as Now and Next.
Long
Power Grid intraday trend analysis for May 19, 2026Power Grid stock is showing a bullish momentum tomorrow with support level at 295
while resistance at 307. The resistance of 307 may be seen in a day or two.
Since opening gaps are not taken into account, the levels may vary depending on the
magnitude of the gap.
This is my personal view only. Please use your own technical analysis for entries and
exits.
Long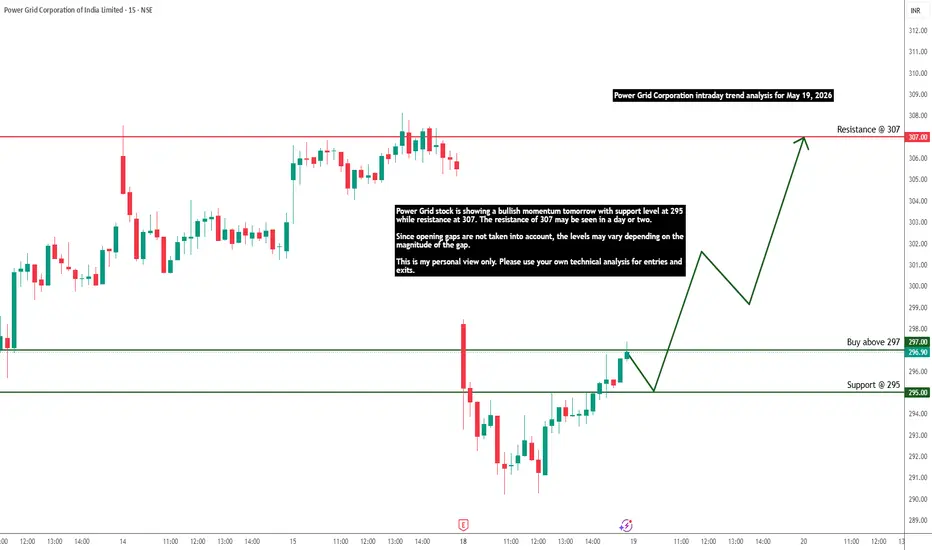
Powergrid buy at cmp can give 20% return Buy powergrid at cmp,hold for next 3-4 month can give 20%+ returns
Trade at your own sl and risk accordingly
Long
Power grid CorporationOn the weekly timeframe, a strong reversal candle has formed at a key support level, accompanied by healthy trading volume. This suggests a potential shift in momentum.
The sustainability of the current channel breakout depends on the price remaining above 292. Conversely, a breakdown below 278 would signal a continuation of the bearish trend. The price action in the coming week will be critical in confirming a definitive trend reversal.
Long
NSE – NIFTY 750 | Power Grid Corporation | 04 Feb 2026Structure assessed from earliest reliable data.
Long-term rising channel structure observed, with price respecting the broader channel framework across cycles.
This is a structural context study — not a directional call.
#NIFTY750 #EquityStructure #POWERGRID #MarketStructure #EWAVESJOURNAL

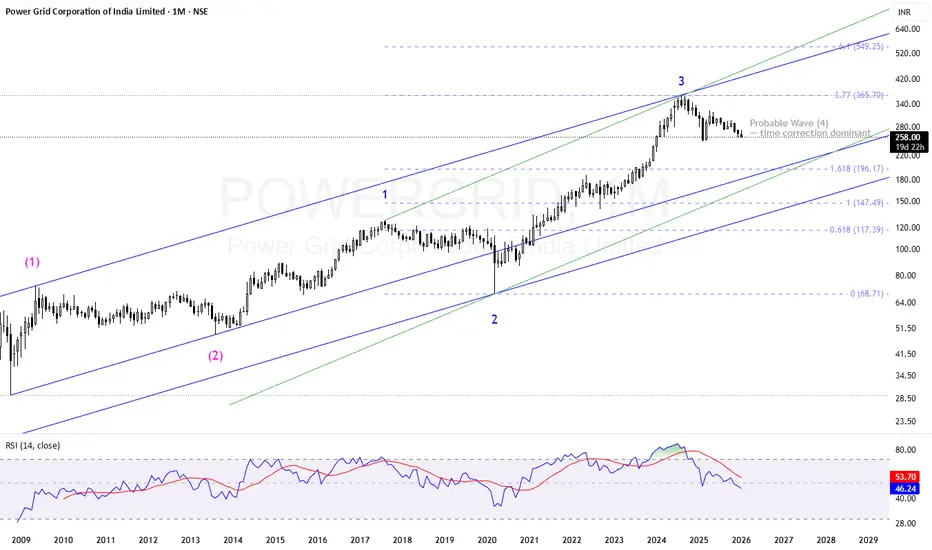
POWERGRID (Monthly) – Elliott Wave Structure CheckThis chart presents a conservative Elliott Wave view of Power Grid on the monthly timeframe.
Key points:
Secular uptrend remains intact within a rising channel
Advance from 2009 fits an impulsive structure
Wave (3) appears extended and completed near recent highs
Current pullback is best viewed as a Probable Wave (4)
Wave (4) is expected to be time-dominant , not price-destructive
Internal trendlines may be breached temporarily
Only an impulsive breakdown of the main channel would damage the bullish structure
This is a structural pause, not a trend reversal.
📌 Educational / structure-based view. Not trading advice.
#POWERGRID #ElliottWave #ElliottWaveAnalysis #MarketStructure
#WaveFour #CorrectiveStructure #LongTermInvesting
#IndianStocks #ChartStudy #StructureBased
Power Grid Building Momentum for the Next Summit!This is the Daily Timeframe Chart of Power Grid Corporation of India.
The stock is forming a Bow & Tie pattern, indicating a potential trend reversal setup.
It has a strong support zone in the 258–22 range, while the resistance lies near the 285 And 300 level.
If the stock sustains above its support zone, we may witness higher price movement in Power Grid Corporation of India.
Thank you!

Powergrid Corporation of India Ltd for 7th Nov #POWERGRID Powergrid Corporation of India Ltd for 7th Nov #POWERGRID
Resistance 272-273 Watching above 273 for upside momentum.
Support area 267-268 Below 268 gnoring upside momentum for intraday
Watching below 267 for downside movement...
Above 272 ignoring downside move for intraday
Charts for Educational purposes only.
Please follow strict stop loss and risk reward if you follow the level.
Thanks,
V Trade Point
Long
Power Grid Corp of India POWERGRID Reliable Infrastructure BUY A backbone of India’s electricity transmission system, Power Grid continues to deliver stable performance and strong cash flows. With India’s energy transition accelerating, this stock remains a consistent value play.
Long
Powergrid Swing Trade Setup📊 Price Action & Trend Analysis
Analyzing market trends using price action, key support/resistance levels, and candlestick patterns to identify high-probability trade setups.
Always follow the trend and manage risk wisely!
Price Action Analysis Interprets Market Movements Using Patterns And Trends On Price Charts.
👉👉👉Follow us for Live Market Views/Trades/Analysis/News Updates.
Long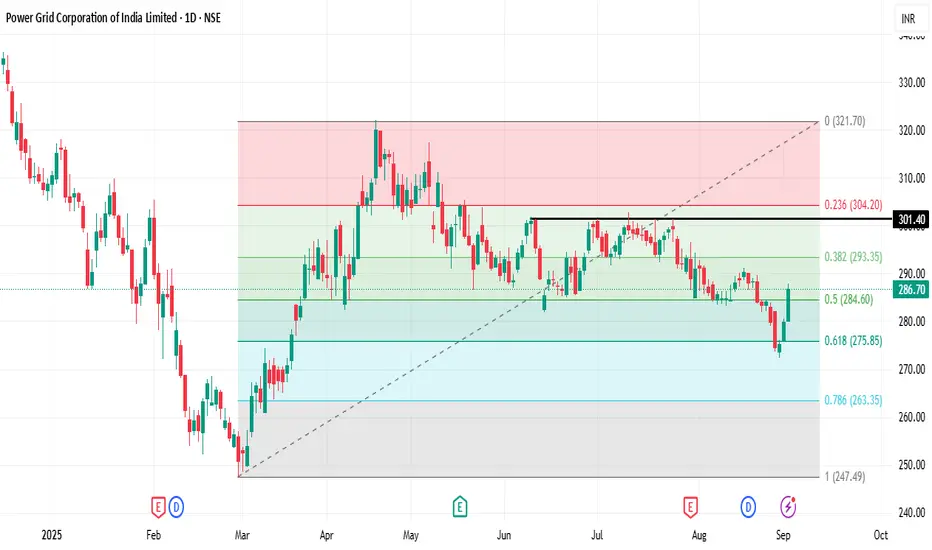 Long
Long
Powergridthis is daily chart of powergrid...
looking at the chart...
it is ready to move up...
as long as it holds its recent low...
Powergrid is ready to test upper levels of channel...
Just a View!!
Vedang!!
Disclaimer: Chart is for study purpose only!!
Long
Powergrid Corporation of INdia view for Intraday 21st May #POWERPowergrid Corporation of INdia view for Intraday 21st May #POWERGRID
Resistance 300 Watching above 302 for upside momentum.
Support area 295 Below 300 ignoring upside momentum for intraday
Watching below 294 for downside movement...
Above 300 ignoring downside move for intraday
Charts for Educational purposes only.
Please follow strict stop loss and risk reward if you follow the level.
Thanks,
V Trade Point
Long
PowergridOne holding company that works in the power transmission industry is Power Grid Corp. of India Ltd. Transmission Services, Consultancy Services, and Telecom Services are its three business divisions. Bulk electricity transmission between India's states is referred to as the Transmission Services segment.
I've seen that it's attempting to surpass the high from the prior day. It might attempt to ramp up to the 335–340 level, in my opinion. After it crosses the 302 level with small SL 280, I anticipate an increase of 10–15%.
This is merely my view and is meant to be educational.
Disclaimer: We are not SEBI registered, and all of the information on this page is only meant for educational purposes. Please consult a SEBI-registered financial counsellor before to investing or making any financial decisions. We are not liable for any profit or loss you may have made.
I would welcome your participation and support by liking, commenting, and following in order to express encouragement.
GLORIOUS TRADING 👍
Long
Power grid corporation This depicts a technical pattern known as the "Cup and Handle" pattern.
If the breakout is successful, an upward bullish trend can be expected
If you find this helpful and want more FREE forecasts in TradingView, Hit the 'BOOST' button
Drop some feedback in the comments below! (e.g., What did you find most useful?
How can we improve?)
Your support is appreciated!
Now, it's your turn!
Be sure to leave a comment; let us know how you see this opportunity and forecast.
Have a successful week
DISCLAIMER: I am NOT a SEBI registered advisor or a financial adviser. All the views are for educational purpose only
Long
POWERGRID – Breakout Setup with Volume Spike📍 Entry Zone: ₹310.10 – ₹311.10
🎯 Target: ₹330.00
🛑 Stoploss: ₹302.00
📈 RSI has crossed above 60, volume confirms breakout momentum (🔵 arrow), and price is supported above key EMAs.
🔍 Strong bullish structure with clear higher lows and a clean breakout candle. Momentum shift confirmed with increasing volume.
For Education Purposes Only
Long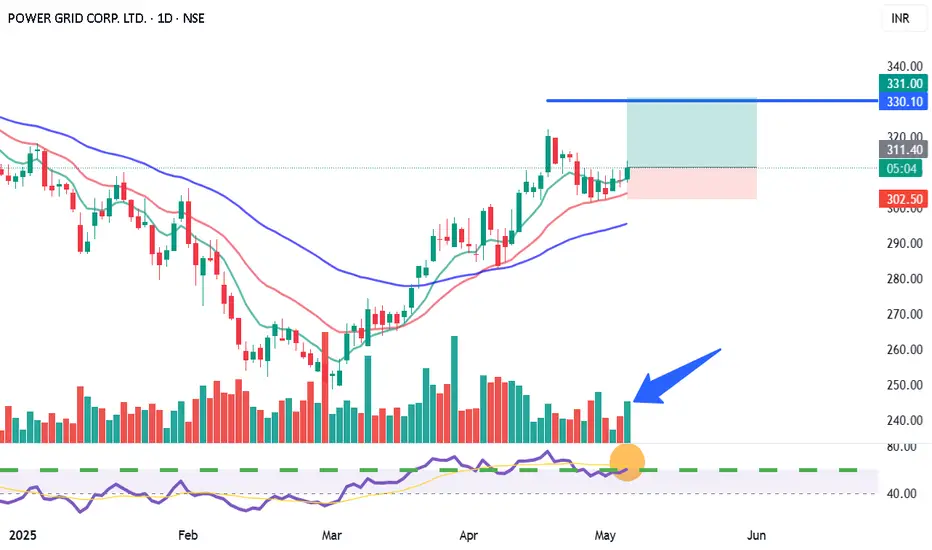
Powergrid Corporation Ltd view for Intraday 21st April #POWERGRIPowergrid Corporation Ltd view for Intraday 21st April #POWERGRID
Resistance 310 Watching above 311 for upside movement...
Support area 300 Below 305 ignoring upside momentum for intraday
Watching below 299 for downside movement...
Above 305 ignoring downside move for intraday
Charts for Educational purposes only.
Please follow strict stop loss and risk reward if you follow the level.
Thanks,
V Trade Point
Long