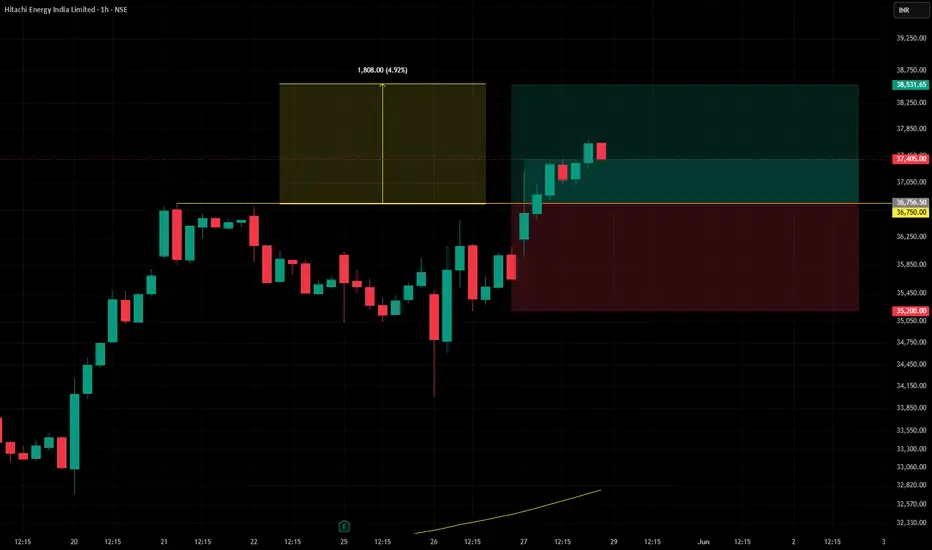
Hitachi Energy
arameter Details
Instrument Hitachi Energy India Ltd.
Timeframe Daily
Trend Context Long‑term bullish; short‑term corrective phase approaching 141 SMA (≈ 26,313).
Entry Zone 26,325 ± 50 pts — near 141 SMA and prior demand cluster.
Stop‑Loss 23,400 — below structural demand and swing low.
Target 38,
Hitachi Energy India Limited
No trades
No trades
Compare with Hitachi Energy India Limited
221.65 INR
9.88 B INR
81.48 B INR
12.68 M
Next report date
—
Report period
—
EPS estimate
—
Revenue estimate
—
Details
Sector
Industry
CEO
Venu Nuguri
Website
Headquarters
Bangalore
Founded
2019
IPO date
Mar 30, 2020
ISIN
INE07Y701011
FIGI
BBG00ST5VST8
Identifiers
ISIN INE07Y701011
Hitachi Energy India Ltd. engages in manufacture of electrical equipment. Its products and solutions support utility, industry and transport and infrastructure customers to plan, build, operate and maintain its power infrastructure. The company was founded on February 19, 2019 and is headquartered in Bangalore, India.
HITACHI ENERGYHitachi Energy India Ltd. (NSE: POWERINDIA)
Prepared by Sucrit Patil | The SmartWay Research Desk | 28 May 2026
A Bengaluru‑based power technology and energy solutions company, incorporated in 1989 (formerly ABB Power Products & Systems India Ltd.). Hitachi Energy India provides grid automation, tr
LOOKS BULLISHMoving Averages (Simple & Exponential): All signals (from 5‑day to 200‑day) in both SMA & EMA suggest strong BUY .
Trend Oscillators:
MACD: Bullish with positive value ~134 .
ADX/DMI: ADX ~23 indicates weak trend, but DMI+ (32.8) > DMI– (14.8), signalling a bullish bias .
Momentum Oscillators:
RSI (
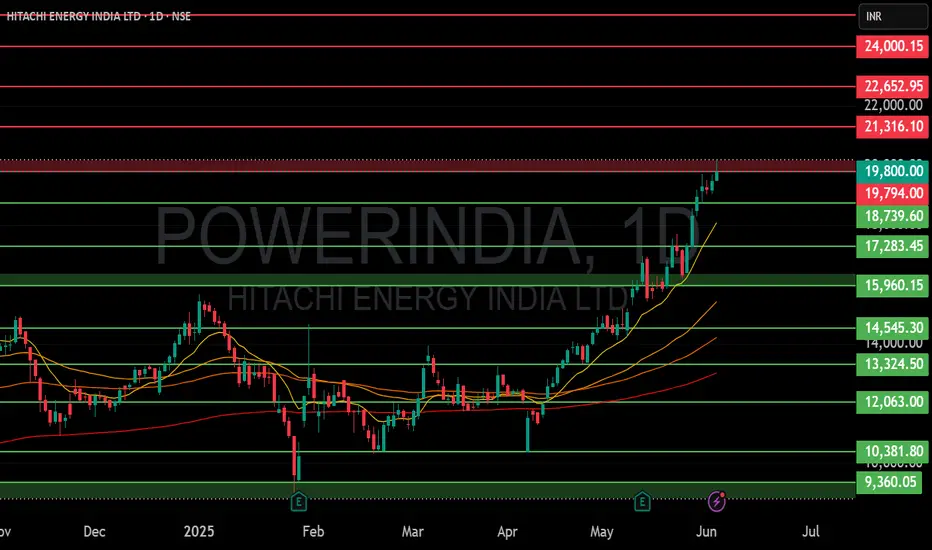
HITACHI ENERGY INDIA LTD S/RSupport and Resistance Levels:
Support Levels: These are price points (green line/shade) where a downward trend may be halted due to a concentration of buying interest. Imagine them as a safety net where buyers step in, preventing further decline.
Resistance Levels: Conversely, resistance levels (re
See all ideas
Summarizing what the indicators are suggesting.
Neutral
SellBuy
Strong sellStrong buy
Strong sellSellNeutralBuyStrong buy
Neutral
SellBuy
Strong sellStrong buy
Strong sellSellNeutralBuyStrong buy
Neutral
SellBuy
Strong sellStrong buy
Strong sellSellNeutralBuyStrong buy
An aggregate view of professional's ratings.
Neutral
SellBuy
Strong sellStrong buy
Strong sellSellNeutralBuyStrong buy
Neutral
SellBuy
Strong sellStrong buy
Strong sellSellNeutralBuyStrong buy
Neutral
SellBuy
Strong sellStrong buy
Strong sellSellNeutralBuyStrong buy
Displays a symbol's price movements over previous years to identify recurring trends.
Frequently asked questions
The current price of POWERINDIA is 31,605.25 INR — it has increased by 0.90% in the past 24 hours. Watch Hitachi Energy India Limited stock price performance more closely on the chart.
Depending on the exchange, the stock ticker may vary. For instance, on BSE exchange Hitachi Energy India Limited stocks are traded under the ticker POWERINDIA.
POWERINDIA stock has fallen by −2.18% compared to the previous week, the month change is a −8.09% fall, over the last year Hitachi Energy India Limited has showed a 59.42% increase.
We've gathered analysts' opinions on Hitachi Energy India Limited future price: according to them, POWERINDIA price has a max estimate of 49,936.00 INR and a min estimate of 25,815.00 INR. Watch POWERINDIA chart and read a more detailed Hitachi Energy India Limited stock forecast: see what analysts think of Hitachi Energy India Limited and suggest that you do with its stocks.
POWERINDIA reached its all-time high on Jun 1, 2026 with the price of 38,800.00 INR, and its all-time low was 749.70 INR and was reached on Mar 31, 2020. View more price dynamics on POWERINDIA chart.
See other stocks reaching their highest and lowest prices.
POWERINDIA stock is 3.52% volatile and has beta coefficient of 0.70. Track Hitachi Energy India Limited stock price on the chart and check out the list of the most volatile stocks — is Hitachi Energy India Limited there?
Today Hitachi Energy India Limited has the market capitalization of 1.38 T, it has increased by 0.56% over the last week.
Yes, you can track Hitachi Energy India Limited financials in yearly and quarterly reports right on TradingView.
Hitachi Energy India Limited is going to release the next earnings report on Aug 7, 2026. Keep track of upcoming events with our Earnings Calendar.
POWERINDIA earnings for the last quarter are 74.10 INR per share, whereas the estimation was 67.52 INR resulting in a 9.74% surprise. The estimated earnings for the next quarter are 66.09 INR per share. See more details about Hitachi Energy India Limited earnings.
Hitachi Energy India Limited revenue for the last quarter amounts to 27.54 B INR, despite the estimated figure of 24.67 B INR. In the next quarter, revenue is expected to reach 23.27 B INR.
POWERINDIA net income for the last quarter is 3.30 B INR, while the quarter before that showed 2.61 B INR of net income which accounts for 0.00% change. Track more Hitachi Energy India Limited financial stats to get the full picture.
Yes, POWERINDIA dividends are paid annually. The last dividend per share was 6.00 INR. As of today, Dividend Yield (TTM)% is 0.02%. Tracking Hitachi Energy India Limited dividends might help you take more informed decisions.
Hitachi Energy India Limited dividend yield was 0.03% in 2025, and payout ratio reached 3.61%. The year before the numbers were 0.05% and 6.64% correspondingly. See high-dividend stocks and find more opportunities for your portfolio.
EBITDA measures a company's operating performance, its growth signifies an improvement in the efficiency of a company. Hitachi Energy India Limited EBITDA is 12.56 B INR, and current EBITDA margin is 15.42%. See more stats in Hitachi Energy India Limited financial statements.
Like other stocks, POWERINDIA shares are traded on stock exchanges, e.g. Nasdaq, Nyse, Euronext, and the easiest way to buy them is through an online stock broker. To do this, you need to open an account and follow a broker's procedures, then start trading. You can trade Hitachi Energy India Limited stock right from TradingView charts — choose your broker and connect to your account.
Investing in stocks requires a comprehensive research: you should carefully study all the available data, e.g. company's financials, related news, and its technical analysis. So Hitachi Energy India Limited technincal analysis shows the sell today, and its 1 week rating is buy. Since market conditions are prone to changes, it's worth looking a bit further into the future — according to the 1 month rating Hitachi Energy India Limited stock shows the buy signal. See more of Hitachi Energy India Limited technicals for a more comprehensive analysis.
If you're still not sure, try looking for inspiration in our curated watchlists.