RVNL: Rail Vikas Nigam Ltd. Off the Rails and Over the Bridge!🚂🚂🚂
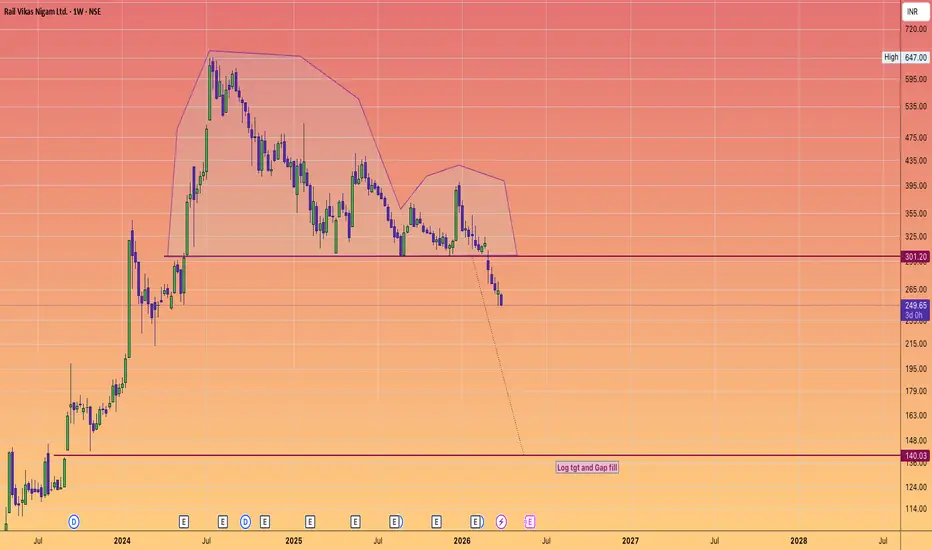
The Parabolic Peak: RVNL has become the poster child for "PSU Mania."
The chart shows a classic "Blow-off Top" with vertical price action on massive retail volume.
The Derailment Drivers:
Profit Booking Gravity: The stock is prone to "News-Driven Exhaustion."
Every major order announcement is now met with a "Sell the News" reaction.
Margin Pressure: While the order book is huge, these are low-margin infrastructure projects.
If commodity prices (Steel/Cement) stay high due to Middle East tensions, these fixed-price contracts will see significant margin erosion.
The Gap-Down Risk: There are multiple "unfilled gaps" lower on the chart.
Rail Vikas Nigam Ltd.
No trades
No trades
In-depth trading ideas
RVNL LONG TRADE SETUP📊 Price Action & Trend Analysis
Analyzing market trends using price action, key support/resistance levels, and candlestick patterns to identify high-probability trade setups.
Always follow the trend and manage risk wisely!
Price Action Analysis Interprets Market Movements Using Patterns And Trends On Price Charts.
👉👉👉Follow us for Live Market Views/Trades/Analysis/News Updates.
Chart – RVNL (Educational View)Sharing this chart for educational purposes and market study.
This is not a buy/sell recommendation. It’s a structured view of current price behavior around key levels.
Focus areas on the chart:
• Market structure
• Key support & resistance zones
• Reaction zones where price is responding
• Possible scenarios based on price action
The idea is simple—trade what price shows, not what we expect.
Always wait for confirmation, manage risk properly, and avoid overtrading.
Trading is about consistency, not predictions.
#RVNL #TradingView #StockMarketIndia #Nifty #PriceAction #IntradayTrading #TradingIdeas #RiskManagement #TradingDiscipline
Review and plan for 16th April 2026Nifty future and banknifty future analysis and intraday plan.
This video is for information/education purpose only. you are 100% responsible for any actions you take by reading/viewing this post.
please consult your financial advisor before taking any action.
----Vinaykumar hiremath, CMT
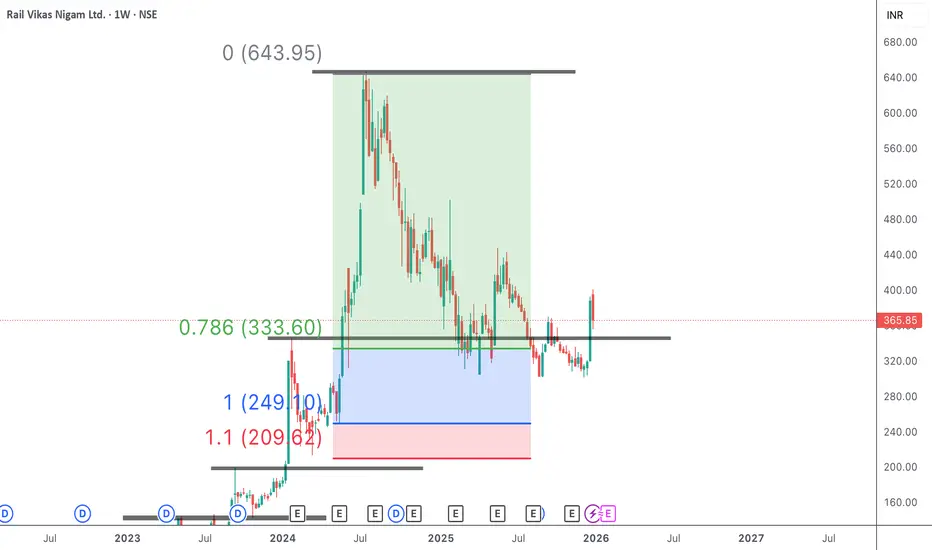
RVNL: Multiple Timeframe Analysis – Key Levels to WatchRail Vikas Nigam Ltd. (RVNL) NSE:RVNL is currently showing a significant correction from its recent highs and is approaching a crucial decision zone. This analysis highlights key Supply, Demand, and Breakout levels across Daily, Weekly, and Monthly timeframes.
📉 Support & Demand Zones
Monthly Demand Zone (₹245.40 - ₹213.05): The stock is hovering above a major demand area. The ₹245.40 level acts as the primary cushion for the bulls.
Crucial Breakdown Level (₹213.05): A Monthly candle closing below this level would signal a major structural breakdown and further downside.
📈 Resistance & Supply Zones
Immediate Daily Breakout (₹273.40): For a short-term trend reversal, we need to see a Daily candle close above this level.
Weekly Supply Zone (₹303.00 - ₹306.50): This is a "Role Reversal" zone where previous support is now acting as supply. Expect some selling pressure here.
Major Weekly Breakout (₹324.00): A Weekly candle close above this mark will confirm the return of bullish momentum, potentially heading towards previous highs.
🚀 Long-Term Target
Monthly Breakout (₹400.70): This is the ultimate resistance. A Monthly candle close above ₹400.70 opens the doors for a fresh multi-month rally and new highs.
Final Verdict & Strategy
Conservative Entry: Wait for a Weekly close above ₹324.00 for a high-probability long setup.
Aggressive Entry: Look for reversal signs (like a Hammer or Bullish Engulfing) near the ₹245.40 Monthly Demand level.
Risk Management: Keep a close eye on the ₹213.05 level on a closing basis.
Disclaimer: This analysis is for educational purposes only. Please perform your own due diligence or consult a financial advisor before making any investment decisions.
RVNL Long setupLogic: RVNL has started uptrend, followed by a demand zone on the daily.
The zone lines around 50% of the previous week bullish candle which may be considered a good retracement level.
The demand zone zone formed may act as a netter retracement level and a long opportunity.
A equivalent better demand zone lies on 25 min time frame right above the daily which can act as a turning point of prices.
Keep strict Stop loss and target of 1: 3
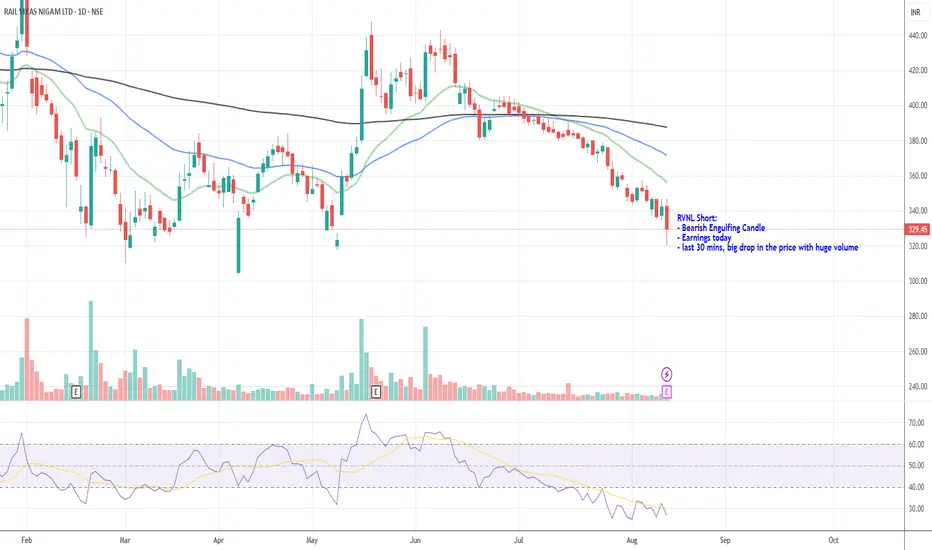
RVNL (NSE) 1D- falling trendline breakout + early continuationPrice Action
The stock has been in a sustained downtrend marked by a clearly defined falling trendline. After an extended corrective phase, price formed a stable base near the ₹300–₹305 zone, indicating exhaustion of selling pressure.
Recently, the stock has decisively broken above the falling trendline and reclaimed the key horizontal level near ₹345–₹346, signaling a potential trend reversal. The breakout candle is strong and followed by consolidation above the breakout zone, which suggests acceptance of higher prices rather than a false breakout.
The projected price path on the chart reflects a classic breakout–pullback–continuation structure, where minor retracements are expected before the next leg higher.
Key Levels
Support Zones:
₹346.05 – ₹345.70 – Immediate breakout support; must hold to sustain bullish momentum.
₹323.90 – ₹327.50 – Major demand zone and retest support; structurally important.
₹302.00 – ₹301.40 – Long-term base support; breakdown below this would invalidate the bullish setup.
Resistance Zones / Upside Targets:
₹368.15 – First resistance; near-term target after consolidation.
₹390.30 – Intermediate resistance; likely to see profit booking.
₹412.45 – Strong resistance zone; breakout here strengthens trend continuation.
₹434.55 – ₹438.45 – Major upside target; represents a full trend reversal objective.
Volume Analysis
Volume behavior supports the bullish case:
Volume expanded notably during the breakout above the falling trendline.
Prior to the breakout, volume had been contracting, which is typical during base formation.
Recent green volume bars suggest renewed accumulation by stronger participants.
Sustained volume expansion above ₹346 would confirm continuation strength, while low volume pullbacks would be considered healthy.
Trend & Momentum
Short-term Trend:
Bullish — price is holding above the falling trendline and key horizontal breakout level.
Medium-term Trend:
Turning bullish — the long downtrend is potentially transitioning into a new uptrend.
Momentum:
Improving — momentum indicators (price structure and breakout behavior) favor upside.
A close below ₹323.90 would weaken momentum, while holding above ₹345 keeps momentum positive.
Possible Scenarios
Bullish Case:
If the stock sustains above ₹345–₹346, the next leg higher may unfold toward:
₹368.15
₹390.30
₹412.45
₹434.55–₹438.45 (extended target)
Minor pullbacks toward ₹346 or ₹327 can be considered structural retests rather than weakness.
Bearish Case:
Failure to hold ₹345 followed by a breakdown below ₹323.90 would signal a failed breakout.
A decisive close below ₹302 would completely invalidate the reversal structure and reopen downside risk.
Overall Bias:
The chart shows a high-probability bullish reversal setup characterized by:
a prolonged downtrend,
a well-defined base near ₹300,
a clean falling trendline breakout, and
improving volume and momentum.
As long as the price holds above ₹323–₹327, the overall bias remains bullish, with upside potential toward ₹412 and ₹438 in the coming weeks.
⚠️ Disclaimer : This chart analysis is for educational purposes only.
Regulatory Note : We are an independent development team and are not registered with any financial authority. Please consult a licensed financial advisor before making trading or investment decisions.
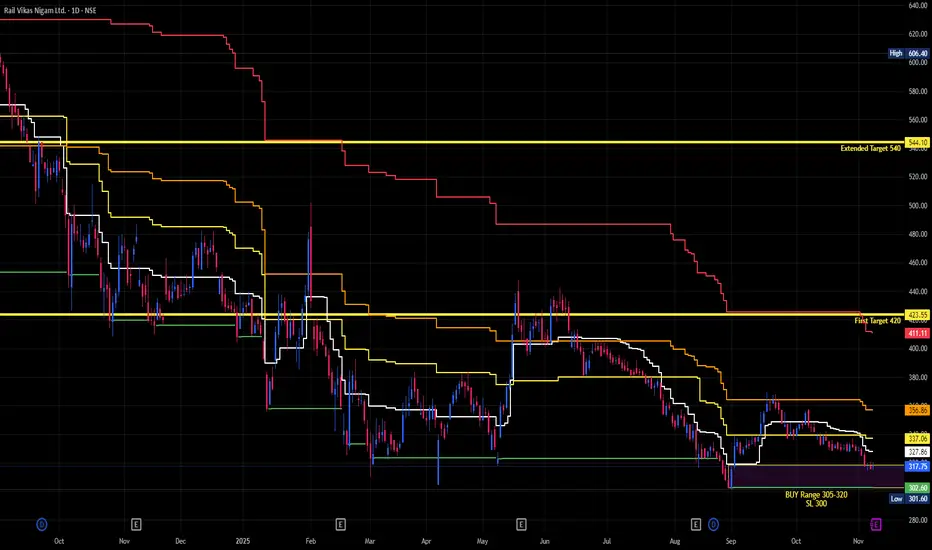
Rail Vikas Nigam Ltd for 7th Nov #RVNL Rail Vikas Nigam Ltd for 7th Nov #RVNL
Resistance 320 Watching above 320 for upside momentum.
Support area 315 Below 320 gnoring upside momentum for intraday
Watching below 314 for downside movement...
Above 320 ignoring downside move for intraday
Charts for Educational purposes only.
Please follow strict stop loss and risk reward if you follow the level.
Thanks,
V Trade Point
RVNL Long Trades Setup📊 Price Action & Trend Analysis
Analyzing market trends using price action, key support/resistance levels, and candlestick patterns to identify high-probability trade setups.
Always follow the trend and manage risk wisely!
Price Action Analysis Interprets Market Movements Using Patterns And Trends On Price Charts.
👉👉👉Follow us for Live Market Views/Trades/Analysis/News Updates.
RVNL-The Railway Growth EngineIn FY 2019, just before Covid, RVNL was trading at a premium of roughly 10 times, giving about ₹3.50 per share to Its Equity shareholder . Its sales figures jumped massively from ₹10,000 crore to ₹19,000 crore. However, when we look at EPS, it only increased from about ₹3.5 to ₹6 till F.Y 2024.
By August 2024, when the stock started to decline, the premium had reached nearly 80. This is simply an observation based on the available data, nothing in-depth.
Now, looking at the technicals, the stock has cut the 24-month moving average. At this stage, it seems to be a “wait and watch” situation. We can only observe at what price RVNL bounces back and starts its time correction.
This is purely an observation based on publicly available data.