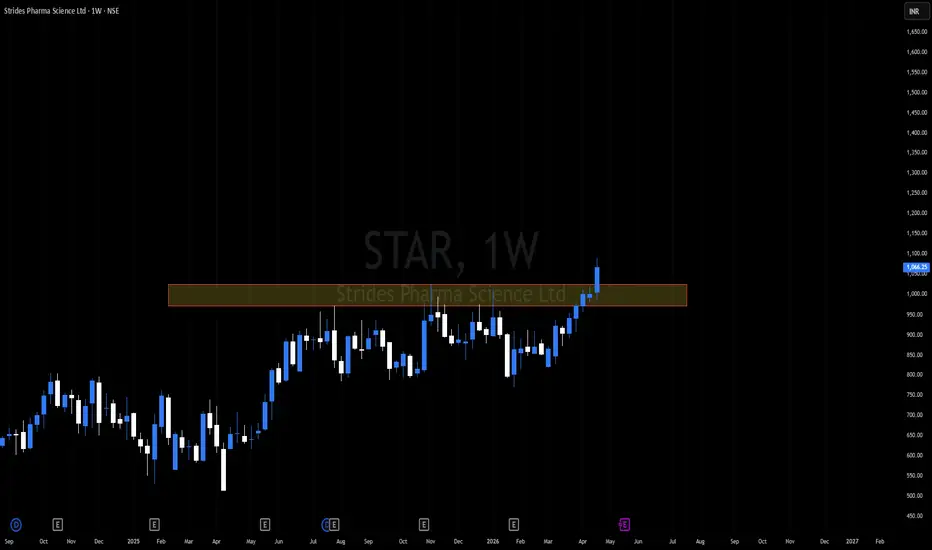
Strides Pharma Science Ltd - Tight Range breakoutThe stock has successfully broken above a key resistance at ₹1,025, a level that had previously capped upward moves.
After a retest of this zone, buyers stepped in, confirming the breakout and strengthening bullish sentiment.
A tight range breakout followed, signaling strong momentum and a shift from consolidation to expansion.
Current price action around ₹1,169 reflects sustained demand, with volume supporting the move.
Breakout Confirmation: Price has broken above the ₹1,025 resistance, retested, and continued higher.
Current Price: ₹1,169
🎯 Upside Targets (based on breakout momentum & measured move approach):
Target 1: ₹1,200 – psychological round number & near-term extension
Target 2: ₹1,250 – next resistance zone from prior swing highs
Target 3: ₹1,320 – projected move from tight range breakout
🛡️ Stop Loss:
Conservative: Below ₹1,100 (recent retest zone support)
Aggressive: Below ₹1,025 (original breakout level, invalidation point)
Strides Pharma Science Ltd
No trades
No trades
In-depth trading ideas
Amazing breakout on WEEKLY Timeframe - STARCheckout an amazing breakout happened in the stock in Weekly timeframe, macroscopically seen in Daily timeframe. Having a great favor that the stock might be bullish expecting a staggering returns of minimum 25% TGT. IMPORTANT BREAKOUT LEVELS ARE ALWAYS RESPECTED!
NOTE for learners: Place the breakout levels as per the chart shared and track it yourself to get amazed!!
#No complicated chart patterns
#No big big indicators
#No Excel sheet or number magics
TRADE IDEA: WAIT FOR THE STOCK TO BREAKOUT IN WEEKLY TIMEFRAME ABOVE THIS LEVEL.
Checkout an amazing breakout happened in the stock in Weekly timeframe.
Breakouts happening in longer timeframe is way more powerful than the breakouts seen in Daily timeframe. You can blindly invest once the weekly candle closes above the breakout line and stay invested forever. Also these stocks breakouts are lifelong predictions, it means technically these breakouts happen giving more returns in the longer runs. Hence, even when the scrip makes a loss of 10% / 20% / 30% / 50%, the stock will regain and turn around. Once they again enter the same breakout level, they will flyyyyyyyyyyyy like a ROCKET if held in the portfolio in the longer run.
Time makes money, GREEDY & EGO will not make money.
Also, magically these breakouts tend to prove that the companies turn around and fundamentally becoming strong. Also the magic happens when more diversification is done in various sectors under various scripts with equal money invested in each N500 scripts.
The real deal is when to purchase and where to purchase the stock. That is where Breakout study comes into play.
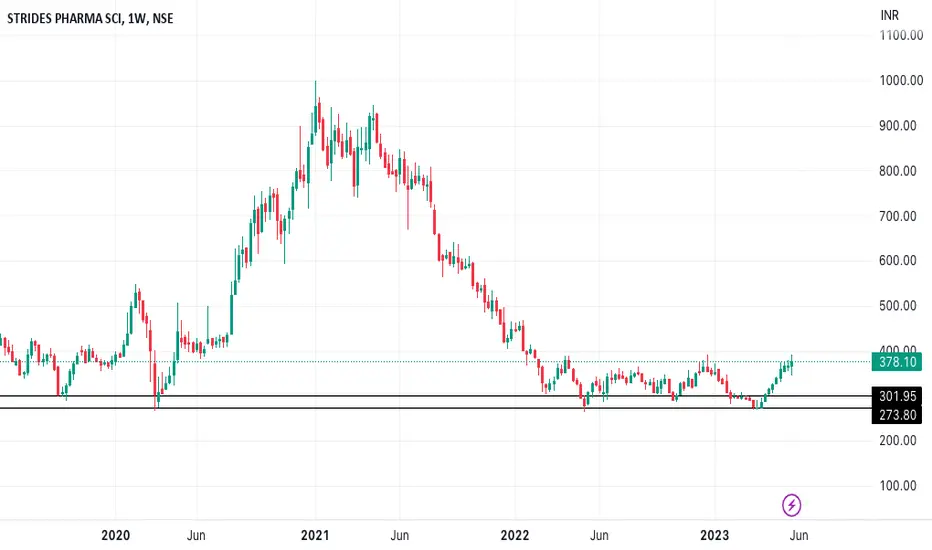
Check this stock which has made an all time low and high chances that it makes a "V" shaped recovery.
> Taking support at last years support or breakout level
> High chances that it reverses from this point.
> Volume dried up badly in last few months / days.
> Very high suspicion based analysis and not based on chart patterns / candle patterns deeply.
> VALUABLE STOCK AVAILABLE AT A DISCOUNTED PRICE
> OPPURTUNITY TO ACCUMULATE ADEQUATE QUANTITY
> MARKET AFTER A CORRECTION / PANIC FALL TO MAKE GOOD INVESTMENT
DISCLAIMER : This is just for educational purpose. This type of analysis is equivalent to catching a falling knife. If you are a warrior, you throw all the knives back else you will be sorrow if it hits SL. Make sure to do your analysis well. This type of analysis only suits high risks investor and whose is willing to throw all the knives above irrespective of any sectoral rotation. BE VERY CAUTIOUS AS IT IS EXTREME BOTTOM FISHING.
HOWEVER, THIS IS HOW MULTIBAGGERS ARE CAUGHT !
STOCK IS AT RIGHT PE / RIGHT EVALUATION / MORE ROAD TO GROW / CORRECTED IV / EXCELLENT BOOKS / USING MARKET CRASH AS AN OPPURTUNITY / EPS AT SKY.
LET'S PUMP IN SOME MONEY AND REVOLUTIONIZE THE NATION'S ECONOMY!
STAR (Strides Pharma Science Ltd.)
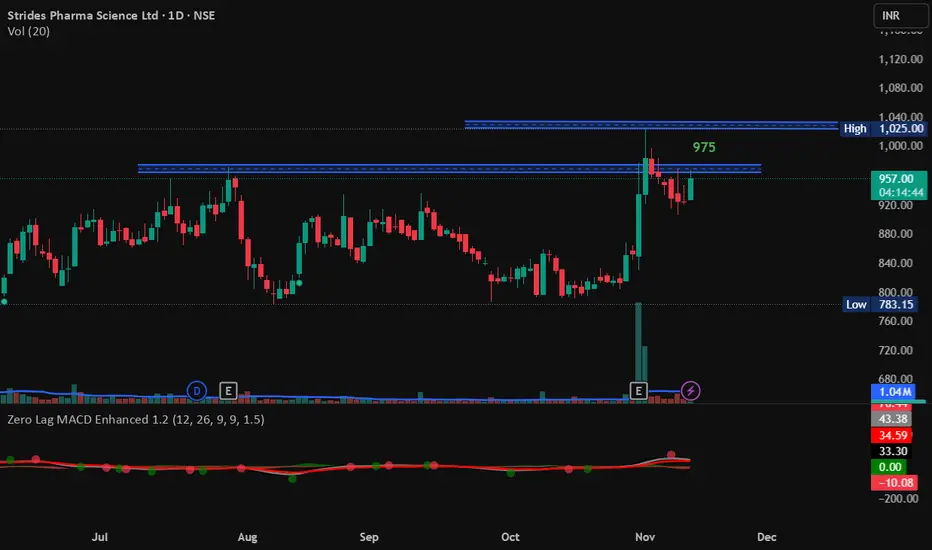
Broke out with Volume.
Contraction prior breakout with lower volume.
Inside the range rallied with volume.
Post the recent high, the stock has consolidated in the 20% price range of 52WH.
ATH break with consolidation.
50 SMA above 100 SMA above 200 SMA
Missed entry, bought at 1048
First target 1330 (30%)
SL 955 (6%)
Review and plan for 11th June 2025 Nifty future and banknifty future analysis and intraday plan.
Positional ideas.
This video is for information/education purpose only. you are 100% responsible for any actions you take by reading/viewing this post.
please consult your financial advisor before taking any action.
----Vinaykumar hiremath, CMT
STAR breakout candidateThis is the chart of Strides pharma science ltd. The stock currently is trading sideways.
Stock has approached the resistance with very high relative volume.
Stock has continuously performed financially well with triple digit earnings growth and margins expansion.
The recent approach to resistance with very high relative volume suggests a high probability for breaking out resistance zone because the stock has very high earnings but not reflected in price hence the reason. Keep watching the stock.
STAR aim for the range 697 to 740Looking at the analysis of **STAR (NSE:STAR)** in the following time frames:
**22-day time frame**, **weekly time frame**, **daily time frame**, and **4-hour time frame**.
The trend suggests a potential movement between the **Support Zone (₹690-₹697)** and the **Resistance Zone (₹740-₹750)**.
This translates to a percentage move of approximately **7.42%** 📊.
Anything below ₹690 can be considered as a stop loss in this scenario.
We are using channel patterns to identify these ranges accurately.
The price is currently consolidating near the support range with a potential bullish reversal.
**Bullish View:** Expecting a breakout above ₹750, leading to further upward momentum.
**Bearish View:** Further decline if the support zone ₹690-₹697 breaks.
The setup shows a very interesting formation with high potential! 🚀
⚠️ **Note:** We should expect further decline if **STAR** breaks the **Support Zone (₹690-₹697)**. ⚠️
🔔 **Be sure to follow the updated ideas.** 🔔
⏰ **STAR Analysis** on multiple timeframes!
Do not forget to put **Stop Loss** for your positions (for every position you want to open).
**Please follow your strategy; this is just my idea, and I will gladly see your ideas in this post.**
✅ **Please do not forget the 'Like' button** add comments ✅ 🙏😊 & Share it with your friends; thanks, and Trade safe.
You may refer to my ideas, minds, scripts, and other details here:
www.tradingview.com
** NSE:STAR **
**Idea snapshot link:**
Analysis of Strides Pharma (NSE: STAR) - 30-Minute TimeframeHead and Shoulders Pattern:
The chart shows a completed head and shoulders pattern, which is typically a bearish reversal pattern indicating a potential decline after an uptrend. The pattern has been completed with the left shoulder, head, and right shoulder visible, followed by a drop confirming the neckline break.
Double Bottom Formation:
Below the head and shoulders pattern, there is a double bottom pattern (labeled as "Bottom 1" and "Bottom 2"). This pattern suggests that after the decline, the stock found support around the ₹1,450 level and began to rise, indicating a potential reversal from bearish to bullish.
The breakout above the neckline of the double bottom is an early bullish signal.
Bullish Flag:
Currently, the stock is forming a bullish flag pattern, which often suggests continuation after an initial uptrend. This is a consolidation phase before a possible breakout to higher levels.
The breakout from this flag could target higher levels around ₹1,600-₹1,650 as marked on the chart.
Targets:
Short-term Target: If the stock breaks out of the bullish flag, the immediate target is around ₹1,600.
Extended Target: With sustained momentum, further targets could be around ₹1,650 and ultimately ₹1,725.
Support and Resistance:
Support Levels: ₹1,500 acts as an immediate support level.
Resistance Levels: The primary resistance is around ₹1,600, with further resistance at ₹1,650.
Volume Analysis:
Volume analysis indicates a notable increase during the breakout from the double bottom, confirming buying interest. Watch for volume spikes accompanying any breakout from the bullish flag for confirmation.
Fundamental Analysis of Strides Pharma
Company Overview:
Strides Pharma is a prominent player in the pharmaceutical industry, focusing on the development and manufacturing of generics and complex products. The company has a strong presence in regulated markets, including the U.S., Europe, and Australia.
Revenue and Earnings:
The company has shown steady revenue growth, supported by new product launches and expanding market share. However, earnings can be volatile due to pricing pressures in the U.S. generics market and regulatory changes.
Recent quarters have shown signs of recovery in margins due to cost optimization and new high-margin product launches.
R&D and Product Pipeline:
Strides Pharma invests significantly in research and development, focusing on niche and complex generics that offer competitive advantages and higher margins. This focus positions the company well for future growth in both established and emerging markets.
Financial Health:
The company maintains a balanced debt-to-equity ratio, but investors should monitor any increase in debt levels, especially for capital expenditure and expansion.
Positive cash flow trends in recent quarters have strengthened its financial position, aiding in further R&D investments and market expansion.
Sector Outlook:
The pharmaceutical sector has strong tailwinds with growing global demand for generic drugs, especially in emerging markets. Strides Pharma, with its broad portfolio and strategic focus, is well-placed to benefit from these trends.
Conclusion:
Technical Outlook: Strides Pharma is showing a bullish setup with a completed double bottom and a current bullish flag pattern. A breakout from the flag could lead to targets at ₹1,600 and potentially ₹1,725 if the momentum continues.
Fundamental Outlook: The company has solid fundamentals, supported by its strategic focus on complex generics and a growing product pipeline. While revenue growth is steady, investors should be aware of market-specific risks such as regulatory challenges.
STRIDES PHARMA SCI LTD S/RSupport and Resistance Levels:
Support Levels: These are price points (green line/shade) where a downward trend may be halted due to a concentration of buying interest. Imagine them as a safety net where buyers step in, preventing further decline.
Resistance Levels: Conversely, resistance levels (red line/shade) are where upward trends might stall due to increased selling interest. They act like a ceiling where sellers come in to push prices down.
Breakouts:
Bullish Breakout: When the price moves above resistance, it often indicates strong buying interest and the potential for a continued uptrend. Traders may view this as a signal to buy or hold.
Bearish Breakout: When the price falls below support, it can signal strong selling interest and the potential for a continued downtrend. Traders might see this as a cue to sell or avoid buying.
20 EMA (Exponential Moving Average):
Above 20 EMA(50 EMA): If the stock price is above the 20 EMA, it suggests a potential uptrend or bullish momentum.
Below 20 EMA: If the stock price is below the 20 EMA, it indicates a potential downtrend or bearish momentum.
Trendline: A trendline is a straight line drawn on a chart to represent the general direction of a data point set.
Uptrend Line: Drawn by connecting the lows in an upward trend. Indicates that the price is moving higher over time. Acts as a support level, where prices tend to bounce upward.
Downtrend Line: Drawn by connecting the highs in a downward trend. Indicates that the price is moving lower over time. It acts as a resistance level, where prices tend to drop.
RSI: RSI readings greater than the 70 level are overbought territory, and RSI readings lower than the 30 level are considered oversold territory.
Combining RSI with Support and Resistance:
Support Level: This is a price level where a stock tends to find buying interest, preventing it from falling further. If RSI is showing an oversold condition (below 30) and the price is near or at a strong support level, it could be a good buy signal.
Resistance Level: This is a price level where a stock tends to find selling interest, preventing it from rising further. If RSI is showing an overbought condition (above 70) and the price is near or at a strong resistance level, it could be a signal to sell or short the asset.
Disclaimer:
I am not a SEBI registered. The information provided here is for learning purposes only and should not be interpreted as financial advice. Consider the broader market context and consult with a qualified financial advisor before making investment decisions.
Strides Pharma Science Ltd. | Momentum Play | Technical AnalysisStrides Pharma Science Ltd. has been in a loss-making phase for the past four years, with losses gradually decreasing since 2021. However, the stock has shown a remarkable upward rally since March 2023, closely following the 20 EMA (Exponential Moving Average).
This stock is purely driven by technical momentum rather than strong fundamentals, making it a higher-risk trade. The consistent rally and adherence to the 20 EMA make it an attractive opportunity for short-term momentum traders.
I recommend waiting for confirmation of support before entering. My strategy involves making entries after a long sideways consolidation, followed by a minimum of three bounces off the 20 EMA line, which signals sustained momentum.
Avoid entering due to FOMO (Fear of Missing Out). If the current rally is too advanced, it’s better to look for other opportunities where the rally is just building up and offering better entry points.
Caution: Since this stock lacks fundamental strength, strict risk management is crucial.