 Long
Long
Tata Chemicals Limited
No trades
No trades
Compare with Tata Chemicals Limited
−85.00 INR
−18.96 B INR
145.84 B INR
156.05 M
Last report date
Jul 27, 2026
Report period
Q1 2026
EPS
−1.35 INR
Revenue
42.55 B INR
Earnings call summary
Q1 FY26 delivered stable revenues and improved profitability, driven by higher volumes, cost efficiencies, and lower input costs, despite flat global demand and oversupplied markets. Outlook for FY26 remains positive with targeted EBITDA improvements and ongoing capacity expansions.
Details
Sector
Industry
CEO
Ramakrishnan Mukundan
Website
Headquarters
Mumbai
Founded
1939
IPO date
Nov 3, 1994
ISIN
INE092A01019
FIGI
BBG000D0Y1K2
Identifiers
ISIN INE092A01019
Tata Chemicals Ltd. is a holding company, which engages in the manufacture and sale of inorganic chemicals. It operates through the Basic Chemistry Products and Specialty Products. The Basic Chemistry Products segment offers soda ash and other bulk chemicals. The Specialty Products segment consists of nutrition solutions and advance materials. The company was founded on January 23, 1939 and is headquartered in Mumbai, India.
Long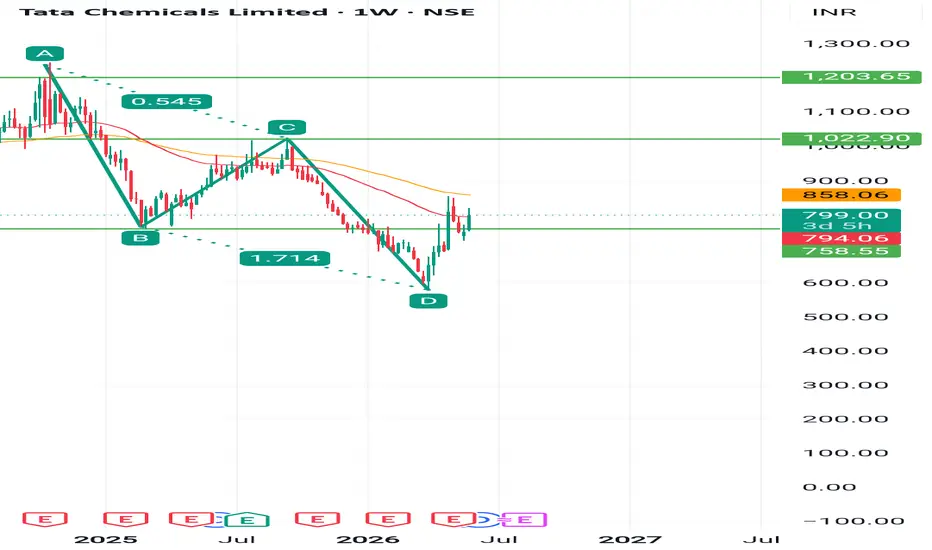
Tata Chemicals LimitedAnalysis of / Tata Chemicals Limited
for long term investors to decide to buy or sell hope it is usefull...

Tata Chemicals Ltd – Start Accumulating at Long-Term Support Zon Tata Chemicals Ltd (Weekly Chart) –
Short-Term & Long-Term View
Short-Term (Trading Perspective):
Price is in a short-term downtrend with a falling trendline.
Currently testing a major demand/support zone at ₹740–780.
Positive scenario: If price holds above this zone and breaks the falling t
Long
TATA CHEMICALS – Liquidity Sweep & Swing Reversal SetupMarket Context:
Tata Chemicals has corrected nearly 45% from its All-Time High, and price is now trading near a key demand region after sweeping recent liquidity. This zone is high-risk but high-reward, suitable for controlled swing trades.
🔍 Key Levels & Structure
All-Time High: 1349
Recent Swin
Long
TATA CHEMICALS on Full Momentum – Don’t Miss the RideTATA CHEMICALS – 4 Hour Timeframe Update
Tata Chemicals is currently forming a broadening pattern and is in the process of completing its 4th leg.
The stock is showing strong momentum, supported by the Supertrend indicator, and continues to make new highs.
Support Zone: 980 – 990
Potential Upsi
Long
Tata Chemical, #tata chem# tata chemical📉 Trend Reversal from ₹790–₹800 Support Zone
'W' pattern formed on daily chart — trend reversal signal.
Bottom range & neckline breakout confirm bullish momentum.
Price consolidating above W base, showing strength.
📈 Bias: Bullish above neckline; potential for further upside.
🗓️ Upcoming Event:
Long
TATA CHEMICALS Ready to FIRE ( LONG TERM IDEA ) !!!TATA CHEMICALS' weekly counts indicate a bullish wave structure.
Both appear to be optimistic, and this stock's invalidation number is 756.
Investing in declines is a smart move for long-term players.
Long-term investors prepare for strong returns over the next two to five years.
TOP PLAYER IN
Long
TATA CHEMICALS Breakout Confirmed - Buy on MomentumEntry Price:
Aggressive Entry: Around CMP (₹900-₹905)
Conservative Entry: On a retest of the breakout zone (₹875-₹885), if the opportunity arises.
Target Price 1 (T1): ₹920
Target Price 2 (T2): ₹945
Stop Loss (SL): ₹865 (Closing basis below the breakout zone and previous support)

TATACHEM | Buy @LTP | SL below 870 | 1st Target 980Disclaimer:
This is not financial advice. Please do your own research or consult with a financial advisor before making any investment decisions. Investments in stocks can be risky and may result in loss of capital.
Long
NATRIUM | Investing | Why BILL GATES is Betting on NATRIUMBill Gates is betting big on Natrium - should you be, too?
Natrium is this next-generation nuclear reactor design that's attracting a lot of attention from people like Bill Gates and other major investors. What's particularly interesting about it is that it combines a fast reactor with a built-in m
Long
See all ideas
Summarizing what the indicators are suggesting.
Neutral
SellBuy
Strong sellStrong buy
Strong sellSellNeutralBuyStrong buy
Neutral
SellBuy
Strong sellStrong buy
Strong sellSellNeutralBuyStrong buy
Neutral
SellBuy
Strong sellStrong buy
Strong sellSellNeutralBuyStrong buy
An aggregate view of professional's ratings.
Neutral
SellBuy
Strong sellStrong buy
Strong sellSellNeutralBuyStrong buy
Neutral
SellBuy
Strong sellStrong buy
Strong sellSellNeutralBuyStrong buy
Neutral
SellBuy
Strong sellStrong buy
Strong sellSellNeutralBuyStrong buy
Displays a symbol's price movements over previous years to identify recurring trends.


Frequently asked questions
The current price of TATACHEM is 674.65 INR — it has increased by 0.07% in the past 24 hours. Watch Tata Chemicals Limited stock price performance more closely on the chart.
Depending on the exchange, the stock ticker may vary. For instance, on BSE exchange Tata Chemicals Limited stocks are traded under the ticker TATACHEM.
TATACHEM stock has fallen by −3.36% compared to the previous week, the month change is a −2.41% fall, over the last year Tata Chemicals Limited has showed a −31.82% decrease.
We've gathered analysts' opinions on Tata Chemicals Limited future price: according to them, TATACHEM price has a max estimate of 815.00 INR and a min estimate of 630.00 INR. Watch TATACHEM chart and read a more detailed Tata Chemicals Limited stock forecast: see what analysts think of Tata Chemicals Limited and suggest that you do with its stocks.
TATACHEM reached its all-time high on Mar 7, 2024 with the price of 1,349.70 INR, and its all-time low was 40.30 INR and was reached on May 17, 2004. View more price dynamics on TATACHEM chart.
See other stocks reaching their highest and lowest prices.
See other stocks reaching their highest and lowest prices.
TATACHEM stock is 1.06% volatile and has beta coefficient of 0.74. Track Tata Chemicals Limited stock price on the chart and check out the list of the most volatile stocks — is Tata Chemicals Limited there?
Today Tata Chemicals Limited has the market capitalization of 171.54 B, it has decreased by −2.22% over the last week.
Yes, you can track Tata Chemicals Limited financials in yearly and quarterly reports right on TradingView.
Tata Chemicals Limited is going to release the next earnings report on Oct 30, 2026. Keep track of upcoming events with our Earnings Calendar.
TATACHEM earnings for the last quarter are −1.35 INR per share, whereas the estimation was 0.95 INR resulting in a −242.11% surprise. The estimated earnings for the next quarter are 10.22 INR per share. See more details about Tata Chemicals Limited earnings.
Tata Chemicals Limited revenue for the last quarter amounts to 42.55 B INR, despite the estimated figure of 40.70 B INR. In the next quarter, revenue is expected to reach 42.69 B INR.
TATACHEM net income for the last quarter is −170.00 M INR, while the quarter before that showed −21.32 B INR of net income which accounts for 0.00% change. Track more Tata Chemicals Limited financial stats to get the full picture.
Yes, TATACHEM dividends are paid annually. The last dividend per share was 11.00 INR. As of today, Dividend Yield (TTM)% is 1.63%. Tracking Tata Chemicals Limited dividends might help you take more informed decisions.
As of Aug 3, 2026, the company has 13.96 K employees. See our rating of the largest employees — is Tata Chemicals Limited on this list?
EBITDA measures a company's operating performance, its growth signifies an improvement in the efficiency of a company. Tata Chemicals Limited EBITDA is 17.54 B INR, and current EBITDA margin is 12.38%. See more stats in Tata Chemicals Limited financial statements.
Like other stocks, TATACHEM shares are traded on stock exchanges, e.g. Nasdaq, Nyse, Euronext, and the easiest way to buy them is through an online stock broker. To do this, you need to open an account and follow a broker's procedures, then start trading. You can trade Tata Chemicals Limited stock right from TradingView charts — choose your broker and connect to your account.
Investing in stocks requires a comprehensive research: you should carefully study all the available data, e.g. company's financials, related news, and its technical analysis. So Tata Chemicals Limited technincal analysis shows the sell today, and its 1 week rating is sell. Since market conditions are prone to changes, it's worth looking a bit further into the future — according to the 1 month rating Tata Chemicals Limited stock shows the sell signal. See more of Tata Chemicals Limited technicals for a more comprehensive analysis.