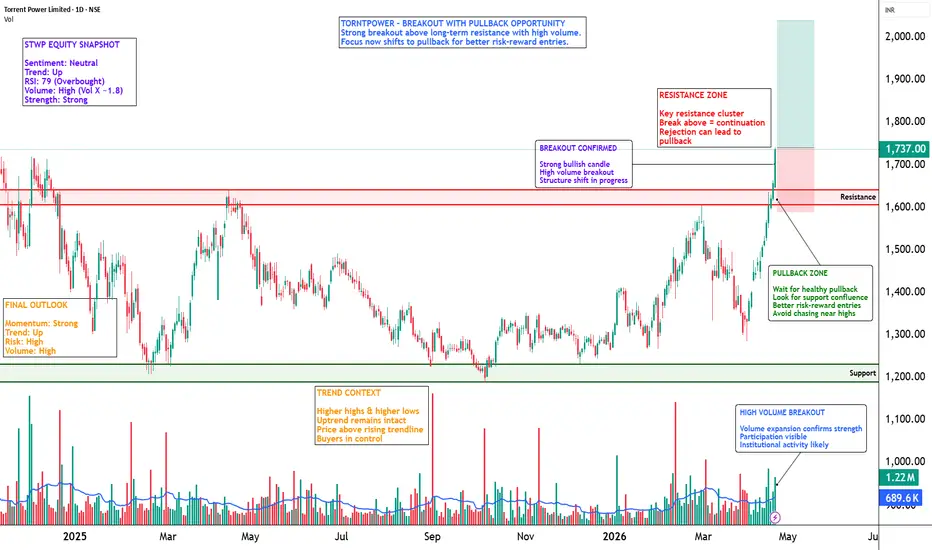
TORNTPOWER – Strong Momentum Expansion After Breakout📊 TORNTPOWER – STWP Equity Snapshot
Ticker: NSE: TORNTPOWER
Sector: Power / Utilities
CMP: 1,737 ▲ (+4.8%)
Learning Rating: ⭐⭐⭐⭐☆ (Momentum Expansion with Elevated Risk)
Chart Pattern Observed: Breakout from Consolidation Range
Candlestick Context: Strong Bullish Expansion Candle with Follow-through
Key Levels – Daily Timeframe
Resistance Areas: 1,770 | 1,803 | 1,866
Support Areas: 1,674 | 1,611 | 1,578
These are zones where price has previously reacted and may act as decision points.
Volume Analysis
Strong volume expansion visible during the breakout leg, indicating active participation. The move shows signs of institutional interest, supporting continuation but also increasing short-term exhaustion risk.
Price Reference Framework
Intraday Reference:
Reference: 1,741
Invalidation: 1,590
Possible Reaction Zones: 1,891 | 2,041
Swing Reference:
Reference: 1,741
Invalidation: 1,476
Possible Reaction Zones: 2,269 | 2,666
Pullback / Opportunity Zones
1,680 – 1,650 → First structure-based support zone
1,620 – 1,580 → Strong demand re-entry area
Below 1,580 → Structure weakens in short term
Momentum entries near highs carry risk; better positioning emerges on pullbacks.
STWP Trade View
Structure has shifted into a strong uptrend with aggressive bullish candles and rising participation. RSI remains in overbought territory, indicating strength but also caution for short-term overheating. Price is extended above base, so continuation is possible, but pullbacks are equally likely before the next leg.
Final Outlook
Momentum: Strong | Trend: Up | Risk: High | Volume: High
Learning Note
Strong breakouts with volume often sustain, but chasing extended moves reduces risk-reward. Structured pullbacks provide better opportunities than emotional entries.
⚠️ Disclaimer
This analysis is generated strictly for educational and analytical purposes only.
This does NOT constitute investment advice, trading advice, or a recommendation to buy or sell any security or derivative instrument.
Readers are advised to exercise independent judgment and consult a SEBI-registered financial advisor before taking any trading or investment decisions.
STWP assumes no responsibility for any financial loss arising from the use of this analysis.
🔼 Boost | ✍️ Comment | 🔁 Share with a learner
👉 Follow STWP for clean chart-reading insights
Stay Calm. Stay Clean. Trade With Patience.
– STWP
Torrent Power Limited
No trades
No trades
In-depth trading ideas
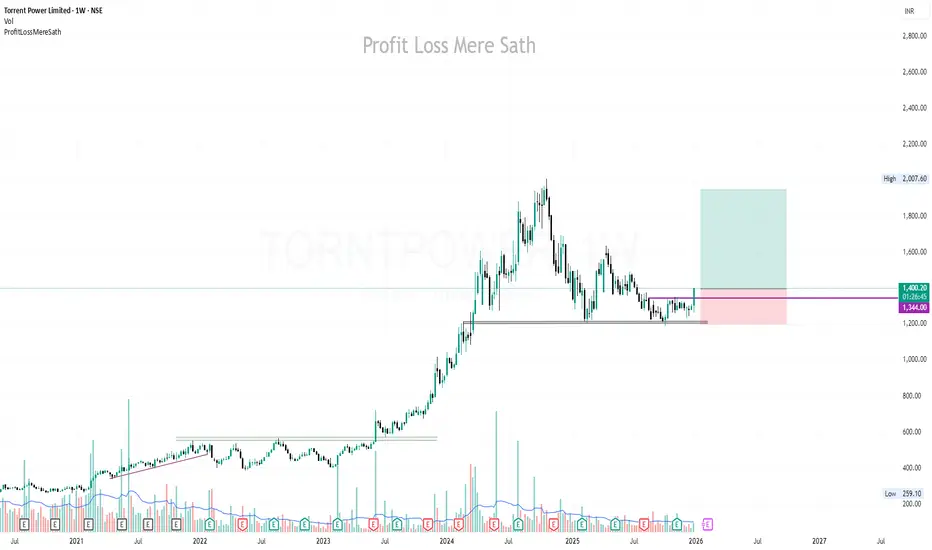
TORNTPOWER | Buy @LTP | SL below 1200 | Targets 1600, 1950Disclaimer (Please Read Carefully):
This is not investment advice. The stocks shared here are purely for educational and informational purposes. Please do your own research or consult with a financial advisor before making any investment decisions.
******************************************************************************************************************
Stock market में सिर्फ risk ही risk होता है। Market में survive करने का एक ही तरीका है, stop loss को पूरी discipline के साथ accept करना। अपनी capital को protect करने का इससे बेहतर कोई तरीका नहीं है।
मैं जो भी stock यहाँ शेयर करता हूँ, वो या तो मेरी existing holding में होता है, या फिर मैं उसी level पर fresh buying या add on करता हूँ जिसे मैं mention करता हूँ।
मैं हमेशा buy करते समय अपने system में stop loss ज़रूर लगा देता हूँ, और मेरे लिए stop loss, target से भी ज़्यादा important होता है।
Target achieve होने के बाद मैं पहले profit book करता हूँ और फिर retest या fresh breakout का इंतज़ार करता हूँ।
मैं सिर्फ breakouts पर buy करता हूँ, कभी भी support पर नहीं। और मैं resistance पर sell भी नहीं करता।
******************************************************************************************************************
The stock market involves risk, risk, and only risk. To survive in the market, accepting stop-loss with discipline and without hesitation. There is no other way to protect you capital.
Any stock I share is either already part of my existing holding or I take a fresh entry at the same level I mention. I always place the stop-loss in my system at the time of buying, and I give the highest importance to stop-loss more than the target. Once the target is achieved, I usually book profit once and then wait for either a retest or a fresh breakout.
I buy only on breakouts, never on supports. I also do not sell at resistance levels.
That is simply my trading style.
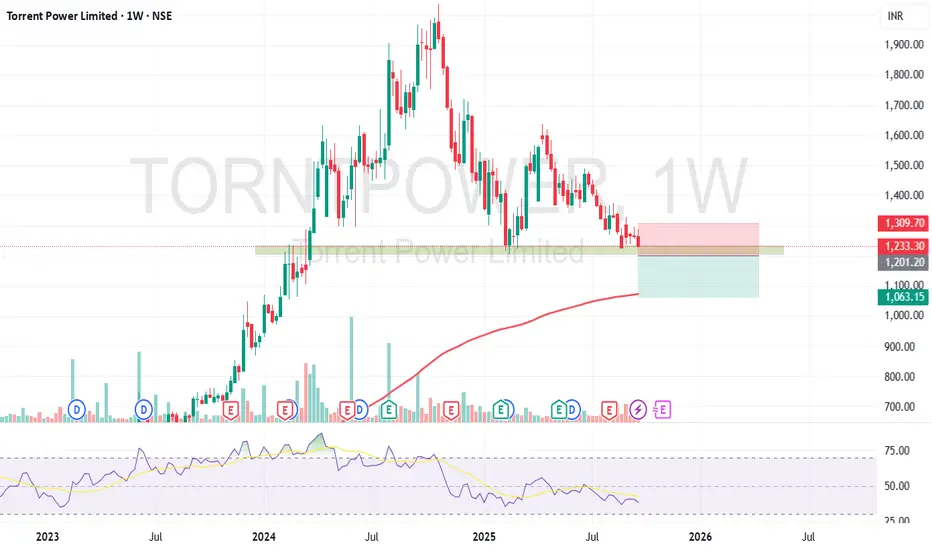
A case Study - Torrent power Probable price projectionThis chart is analysed in two time frames
1. Weekly Time frame
2. Daily time frame
Tools / Indicators used
1. Trend lines
2. pivots
Analysis
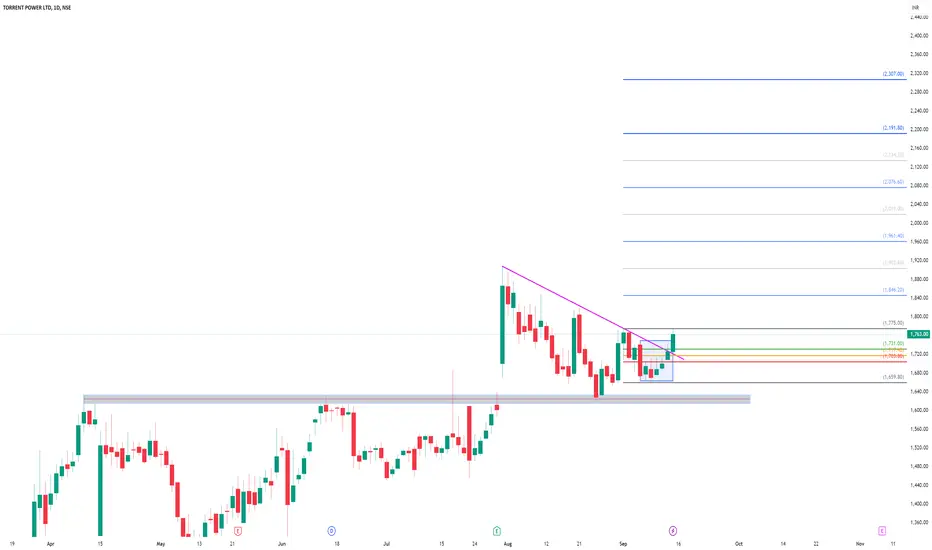
1. IN weekly chart it is clear that the trendline was successfully broken which indicates the presence and interest of buyers at such levels. Implies buy side opportunity
2. IN daily chart it is clear that the trendline was successfully broken . and the price is sustained above pivot levels. which means price is stronger.
case 1:
for sure it is clear that buyers are strong. now price may continue its momentum upside.
case 2:
The probability of price retesting the weekly trend line and Daily pivot also be seen.
Though it may retest or not price may move up.
Short Position BuildupShort Position Buildup
Borrow shares: You borrow shares from a broker-dealer through your margin account.
Sell borrowed shares: You immediately sell these borrowed shares on the open market at the current price.
Wait for price to fall: You anticipate the price of the asset will decrease.
Buy back shares: When the price has fallen, you buy the same number of shares at the new, lower price.
Return shares: You return the purchased shares to the lender to close the position.
Profit: The difference between the higher selling price and the lower repurchase price is your profit.
Swing the TORNTPOWER (NSE)🔍 **Technical Analysis Summary:**
✅ **Trendline Support:**
* The weekly chart shows a **well-respected ascending trendline** stretching from early 2023.
* The current price action at ₹1,390 is approaching this **long-term support zone**, which has consistently provided **bullish rebounds** in the past.
* Price action continues to form **higher lows**, confirming a structurally bullish pattern.
📊 **MACD on OBV (Volume Strength Indicator):**
* The **MACD applied on On-Balance Volume (OBV)** is showing early signs of **bullish divergence**.
* This is particularly important as OBV integrates volume with price movement, and **MACD crossover at low levels** typically indicates accumulation and **potential trend reversal**.
* A bounce in OBV would further confirm strength backed by **smart volume participation**.
⚠️ **Caution Point:**
* The recent candles have shown some **indecision and consolidation**, indicating market participants are awaiting a catalyst.
* **Global cues or negative macroeconomic factors** could temporarily break the trend, but unless a strong bearish breakdown with volume occurs, this trendline remains **technically intact and valid**.
---
💡 **Investment Thesis:**
TORNTPOWER is currently trading near a **strong, multi-touch ascending trendline** that has provided reliable support for over 18 months. The **MACD on OBV** is hinting at a **volume-backed trend reversal**, suggesting a **bullish bounce is likely** if macro sentiment remains neutral or positive.
🎯 **Trading Strategy:**
* **Entry Zone:** ₹1,370–₹1,400 (near the trendline support)
* **Stop Loss:** Below ₹1,300 (on weekly closing basis)
* **Upside Targets:**
* ₹1,550 (short-term resistance)
* ₹1,750+ (medium-term target if the trend continues)
🧠 Final Word:
This setup offers an attractive **risk-reward ratio** for swing traders and positional investors. Technicals favor a bounce — **stay cautious on macro cues**, but the **structure favors accumulation on dips** near the trendline.
TORRENT POWER : Bullish due to forming inverted head & shoulder
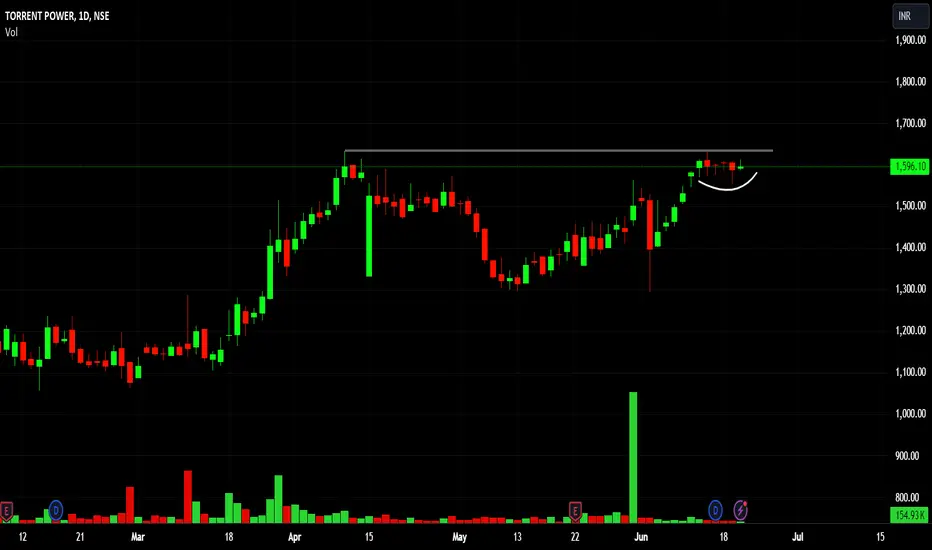
INVERTED HEAD & SHOULDER PATTERN -
the stock has formed an inverted head & shoulder pattern on daily chart indicating strong upward momentum for the stock
TRENDLINE BREAKOUT -
price has broken out of a strong trendline & has taken support on it indicating strong bullish momentum for the stock
TARGET -
price will go till 1629 level
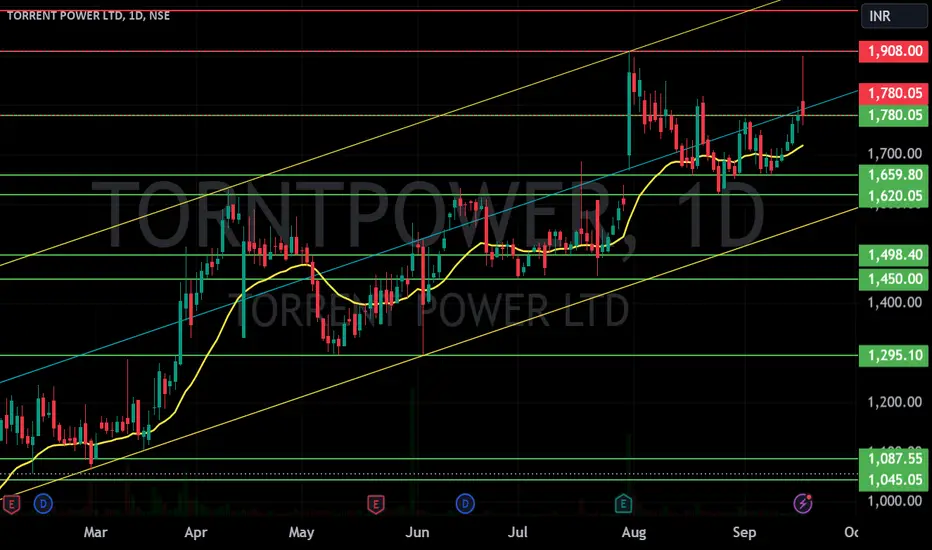
TORRENT POWER LTD S/RSupport and Resistance Levels:
Support Levels: These are price points (green line/shade) where a downward trend may be halted due to a concentration of buying interest. Imagine them as a safety net where buyers step in, preventing further decline.
Resistance Levels: Conversely, resistance levels (red line/shade) are where upward trends might stall due to increased selling interest. They act like a ceiling where sellers come in to push prices down.
Breakouts:
Bullish Breakout: When the price moves above resistance, it often indicates strong buying interest and the potential for a continued uptrend. Traders may view this as a signal to buy or hold.
Bearish Breakout: When the price falls below support, it can signal strong selling interest and the potential for a continued downtrend. Traders might see this as a cue to sell or avoid buying.
MA Ribbon (EMA 20, EMA 50, EMA 100, EMA 200) :
Above EMA: If the stock price is above the EMA, it suggests a potential uptrend or bullish momentum.
Below EMA: If the stock price is below the EMA, it indicates a potential downtrend or bearish momentum.
Trendline: A trendline is a straight line drawn on a chart to represent the general direction of a data point set.
Uptrend Line: Drawn by connecting the lows in an upward trend. Indicates that the price is moving higher over time. Acts as a support level, where prices tend to bounce upward.
Downtrend Line: Drawn by connecting the highs in a downward trend. Indicates that the price is moving lower over time. It acts as a resistance level, where prices tend to drop.
Disclaimer:
I am not a SEBI registered. The information provided here is for learning purposes only and should not be interpreted as financial advice. Consider the broader market context and consult with a qualified financial advisor before making investment decisions.
Plan for 13th December 2024 Nifty future and banknifty future analysis and intraday plan.
Swing trading ideas.
This video is for information/education purpose only. you are 100% responsible for any actions you take by reading/viewing this post.
please consult your financial advisor before taking any action.
----Vinaykumar hiremath, CMT
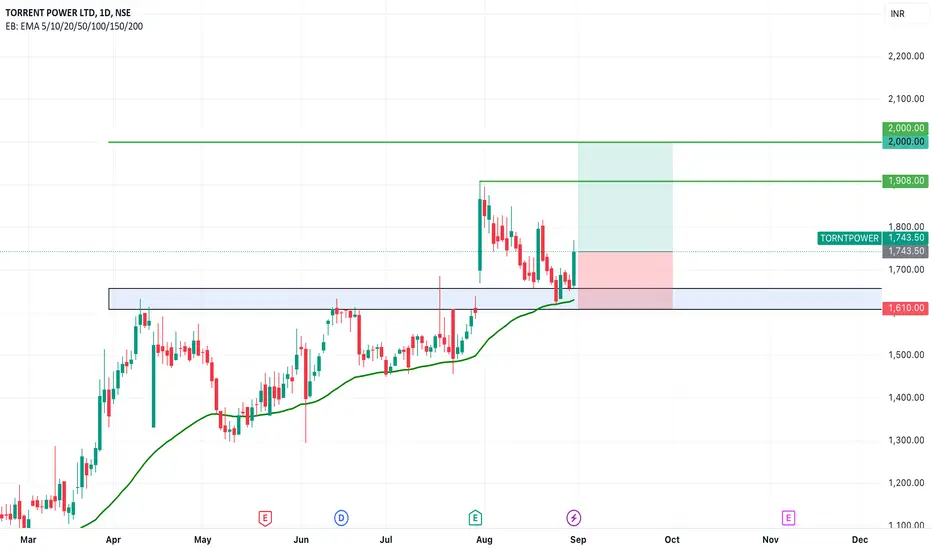
SWING IDEA - TORRENT POWERTorrent Power, a major player in the power sector, is showing strong technical signs of a swing trading opportunity.
Reasons are listed below :
1650 Support Zone : The 1650 level has acted as a strong support zone, and the price is holding steady around this level, indicating potential upside.
Bullish Engulfing Candle on Daily Timeframe : A bullish engulfing candle on the daily chart suggests strong buying momentum, indicating that the stock may reverse from its current support zone.
Double Bottom Pattern : The formation of a double bottom pattern is a bullish reversal signal, indicating the stock may have completed its downtrend and is now primed for an upward move.
0.618 Fibonacci Level Support : The stock has bounced back from the golden Fibonacci retracement level, providing additional support to the bullish thesis.
50 EMA Support : The price is holding above the 50-day exponential moving average, adding strength to the current setup and suggesting the trend is intact.
Target - 1908 // 2000
Stoploss - daily close below 1610
DISCLAIMER -
Decisions to buy, sell, hold or trade in securities, commodities and other investments involve risk and are best made based on the advice of qualified financial professionals. Any trading in securities or other investments involves a risk of substantial losses. The practice of "Day Trading" involves particularly high risks and can cause you to lose substantial sums of money. Before undertaking any trading program, you should consult a qualified financial professional. Please consider carefully whether such trading is suitable for you in light of your financial condition and ability to bear financial risks. Under no circumstances shall we be liable for any loss or damage you or anyone else incurs as a result of any trading or investment activity that you or anyone else engages in based on any information or material you receive through TradingView or our services.
@visionary.growth.insights
TORRENT POWER LTD S/RSupport and Resistance Levels:
Support Levels: These are price points (green line/shade) where a downward trend may be halted due to a concentration of buying interest. Imagine them as a safety net where buyers step in, preventing further decline.
Resistance Levels: Conversely, resistance levels (red line/shade) are where upward trends might stall due to increased selling interest. They act like a ceiling where sellers come in to push prices down.
Breakouts:
Bullish Breakout: When the price moves above resistance, it often indicates strong buying interest and the potential for a continued uptrend. Traders may view this as a signal to buy or hold.
Bearish Breakout: When the price falls below support, it can signal strong selling interest and the potential for a continued downtrend. Traders might see this as a cue to sell or avoid buying.
20 EMA (Exponential Moving Average):
Above 20 EMA: If the stock price is above the 20 EMA, it suggests a potential uptrend or bullish momentum.
Below 20 EMA: If the stock price is below the 20 EMA, it indicates a potential downtrend or bearish momentum.
Trendline: A trendline is a straight line drawn on a chart to represent the general direction of a data point set.
Uptrend Line: Drawn by connecting the lows in an upward trend. Indicates that the price is moving higher over time. Acts as a support level, where prices tend to bounce upward.
Downtrend Line: Drawn by connecting the highs in a downward trend. Indicates that the price is moving lower over time. It acts as a resistance level, where prices tend to drop.
RSI: RSI readings greater than the 70 level are overbought territory, and RSI readings lower than the 30 level are considered oversold territory.
Combining RSI with Support and Resistance:
Support Level: This is a price level where a stock tends to find buying interest, preventing it from falling further. If RSI is showing an oversold condition (below 30) and the price is near or at a strong support level, it could be a good buy signal.
Resistance Level: This is a price level where a stock tends to find selling interest, preventing it from rising further. If RSI is showing an overbought condition (above 70) and the price is near or at a strong resistance level, it could be a signal to sell or short the asset.
Disclaimer:
I am not a SEBI registered. The information provided here is for learning purposes only and should not be interpreted as financial advice. Consider the broader market context and consult with a qualified financial advisor before making investment decisions.
50 SMA Rising - Positional TradeDisclaimer: I am not a Sebi registered adviser.
This Idea is publish purely for educational purpose only before investing in any stocks please take advise from your financial adviser.
It 50 SMA Rising. Suitable for Positional Trading Initial Stop loss lowest of last 2 candles and keep trailing with 50 days SMA if price close below 50 SMA then Exit or be in the trade some time trade can go for several months.
Be Discipline because discipline is the Key to Success in the STOCK Market.
Trade What you see not what you Think
TORNTPOWER1. Anything can happen.
2. You don't need to know what is going to happen next in order to make money.
3. There is a random distribution between wins and losses for any given set of variables that define an edge. No other thoughts
4. An edge is nothing more than an indication of a higher probability of one thing happening over another.
5. Every moment in the market is unique.
BUY TODAY SELL TOMORROW for 5% DON’T HAVE TIME TO MANAGE YOUR TRADES?
- Take BTST trades at 3:25 pm every day
- Try to exit by taking 4-7% profit of each trade
- SL can also be maintained as closing below the low of the breakout candle
Now, why do I prefer BTST over swing trades? The primary reason is that I have observed that 90% of the stocks give most of the movement in just 1-2 days and the rest of the time they either consolidate or fall
Trendline Breakout in TORNTPOWER
BUY TODAY SELL TOMORROW for 5%