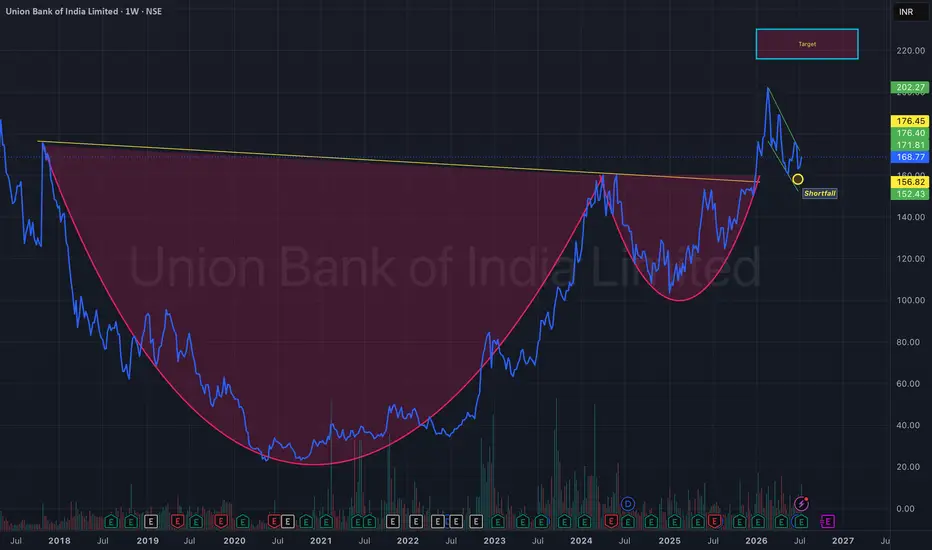
Union Bank of India: Multi-Year Cup Breakout ?Union Bank has completed a multi-year Cup formation on the weekly timeframe by reclaiming its long-term resistance around ₹165–170.
Following the breakout, the stock witnessed a strong impulsive move before entering a controlled pullback. Rather than viewing this as weakness, the current structure
Compare with Union Bank of India Limited
27.05 INR
194.30 B INR
585.43 B INR
1.93 B
Next report date
—
Report period
—
EPS estimate
—
Revenue estimate
—
Details
Sector
Industry
CEO
Asheesh Pandey
Website
Headquarters
Mumbai
Founded
1919
IPO date
Sep 24, 2002
ISIN
INE692A01016
FIGI
BBG000BR5VJ3
Identifiers
ISIN INE692A01016
Union Bank of India engages in the provision of commercial banking services. It also offers personal and corporate loans. The firm operates through the following segments: Treasury Operations, Corporate and Wholesale Banking, Retail Banking Operations and Other Banking Operations. The company was founded on November 11, 1919 and is headquartered in Mumbai, India.
UNIONBANK The Context: The Daily (1D) chart shows a sharp -6.46% drop, closing the session at 163.09. The bears completely took control of the day, pushing price right to the edge of major structural support.
The Demand Zone (Buy Zone): 156.00 – 160.00 (Gray Block). This remains the high-probability interest
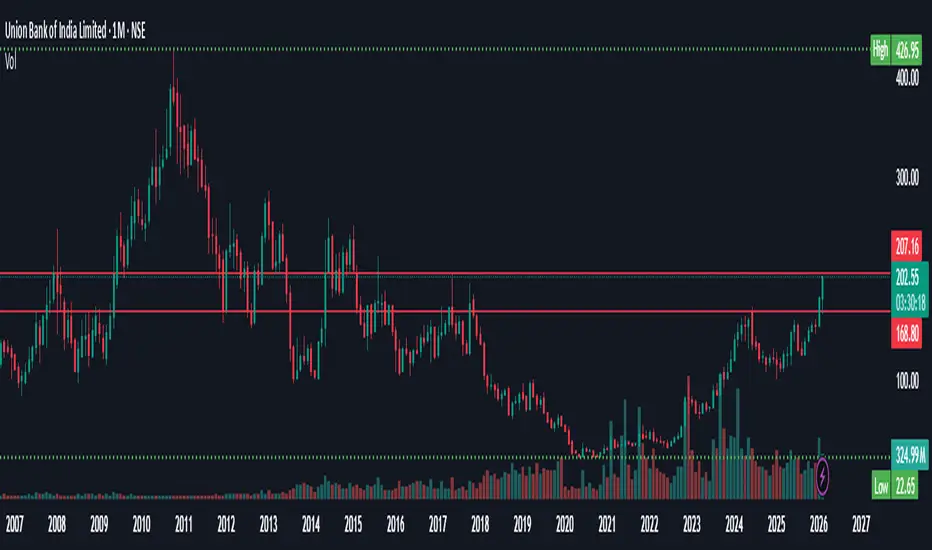
Union Bank – Monthly Timeframe: A Classic Higher‑Timeframe TrendUnion Bank’s monthly chart is showing a powerful structural transition, supported by long‑term moving averages and clean price behavior.
Breakout From Multi‑Year Base
- The stock has broken out of a long consolidation range visible on the monthly timeframe.
- This type of multi‑year base breakout of
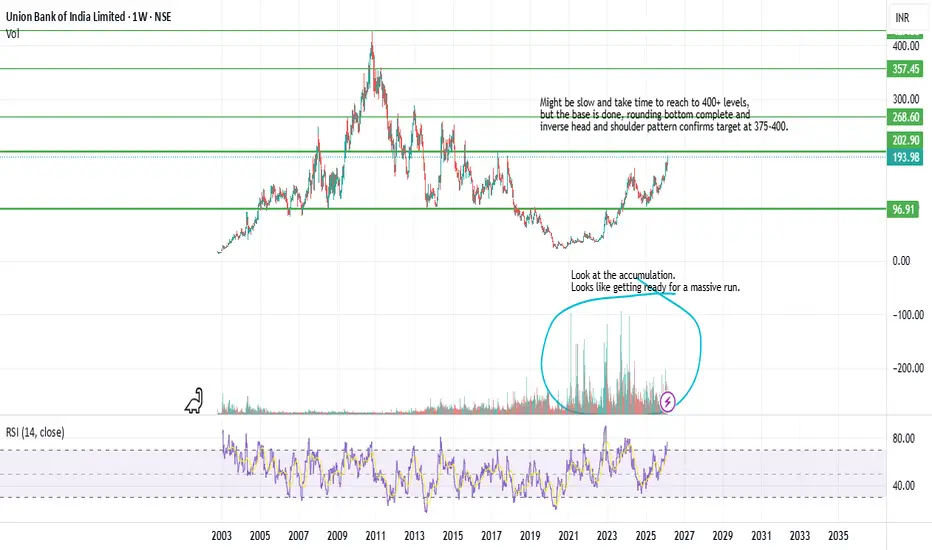
Long on Union Bank - Anticipating Inverse Head and Shoulder BOLooks like bottom is made. The stock is coming back up after having completed a rounding bottom pattern. Based on the depth, target looks like 380-400 range (it might take a while in getting there though) and then might be some stagnation at 400-425 range and then start the journey into bluesky afte
Union Bank of India 🏦🔥 Union Bank – PSU Breakout Loading! 🚀
💰 Deploy: ₹20K
📌 Entry Zone: ₹188–190
⚡ Breakout Level: ₹186
🛑 Stoploss: ₹138
🎯 Targets: ₹244 / ₹255
⚡ Risk–Reward:
➡️ T1: ~1 : 1.1
➡️ T2: ~1 : 1.4
PSU banking momentum building fast 📈
Strong base + breakout structure = bullish setup 🔥
Clean swing trade o
UNION BANK OF INDIAUnion Bank of India Ltd. (CMP ₹176) is a large‑cap public sector bank incorporated in 1919. Headquartered in Mumbai, it provides retail, corporate, MSME, and treasury banking services with a growing digital footprint.
Promoter: The Government of India is the majority shareholder, ensuring strong b
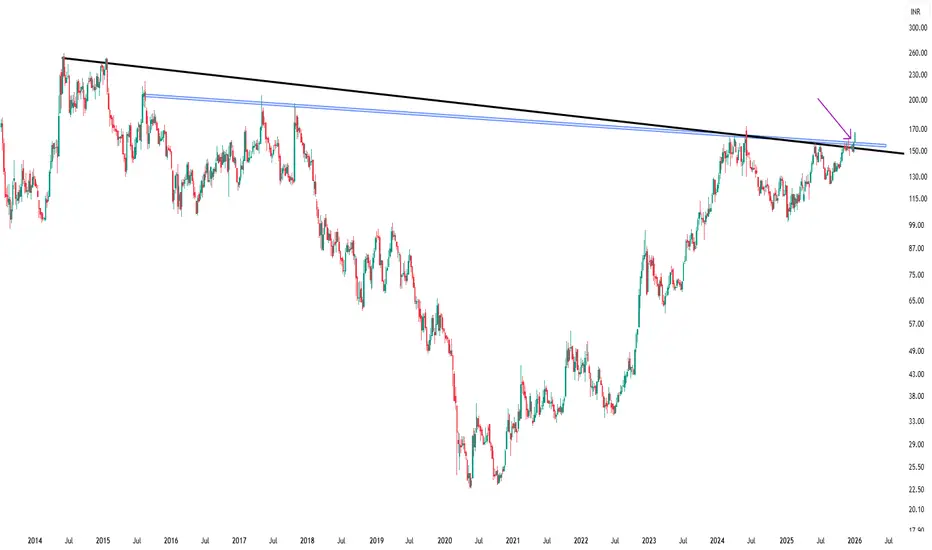
Huge breakout in Union Bank
After it's Q1 results Union bank is trading near it's previous breakout level, and is ready for a huge upside from here.
If we look at the past trends of Union Bank ( See below Images )
We can clearly see after a correction of about 40 to 50%, share rises with a huge breakout and it alway
UNIONBANK | Buy @LTP | SL below 140 | 1st Target 210, 2nd 295******************************************************************************************************************
UNIONBANK | Buy @LTP | SL below 140 | 1st Target 210, 2nd 295
******************************************************************************************************************
Discla
See all ideas
Summarizing what the indicators are suggesting.
Neutral
SellBuy
Strong sellStrong buy
Strong sellSellNeutralBuyStrong buy
Neutral
SellBuy
Strong sellStrong buy
Strong sellSellNeutralBuyStrong buy
Neutral
SellBuy
Strong sellStrong buy
Strong sellSellNeutralBuyStrong buy
An aggregate view of professional's ratings.
Neutral
SellBuy
Strong sellStrong buy
Strong sellSellNeutralBuyStrong buy
Neutral
SellBuy
Strong sellStrong buy
Strong sellSellNeutralBuyStrong buy
Neutral
SellBuy
Strong sellStrong buy
Strong sellSellNeutralBuyStrong buy
Displays a symbol's price movements over previous years to identify recurring trends.
Frequently asked questions
The current price of UNIONBANK is 171.15 INR — it has increased by 0.41% in the past 24 hours. Watch Union Bank of India Limited stock price performance more closely on the chart.
Depending on the exchange, the stock ticker may vary. For instance, on BSE exchange Union Bank of India Limited stocks are traded under the ticker UNIONBANK.
UNIONBANK stock has risen by 2.52% compared to the previous week, the month change is a −1.13% fall, over the last year Union Bank of India Limited has showed a 31.86% increase.
We've gathered analysts' opinions on Union Bank of India Limited future price: according to them, UNIONBANK price has a max estimate of 225.00 INR and a min estimate of 165.00 INR. Watch UNIONBANK chart and read a more detailed Union Bank of India Limited stock forecast: see what analysts think of Union Bank of India Limited and suggest that you do with its stocks.
UNIONBANK reached its all-time high on Oct 27, 2010 with the price of 426.80 INR, and its all-time low was 22.60 INR and was reached on May 20, 2020. View more price dynamics on UNIONBANK chart.
See other stocks reaching their highest and lowest prices.
UNIONBANK stock is 1.74% volatile and has beta coefficient of 1.11. Track Union Bank of India Limited stock price on the chart and check out the list of the most volatile stocks — is Union Bank of India Limited there?
Today Union Bank of India Limited has the market capitalization of 1.31 T, it has decreased by −1.09% over the last week.
Yes, you can track Union Bank of India Limited financials in yearly and quarterly reports right on TradingView.
Union Bank of India Limited is going to release the next earnings report on Nov 4, 2026. Keep track of upcoming events with our Earnings Calendar.
UNIONBANK earnings for the last quarter are 6.99 INR per share, whereas the estimation was 5.30 INR resulting in a 31.80% surprise. The estimated earnings for the next quarter are 6.05 INR per share. See more details about Union Bank of India Limited earnings.
Union Bank of India Limited revenue for the last quarter amounts to 146.40 B INR, despite the estimated figure of 142.78 B INR. In the next quarter, revenue is expected to reach 148.08 B INR.
UNIONBANK net income for the last quarter is 56.42 B INR, while the quarter before that showed 55.04 B INR of net income which accounts for 0.00% change. Track more Union Bank of India Limited financial stats to get the full picture.
Yes, UNIONBANK dividends are paid annually. The last dividend per share was 5.00 INR. As of today, Dividend Yield (TTM)% is 2.92%. Tracking Union Bank of India Limited dividends might help you take more informed decisions.
Union Bank of India Limited dividend yield was 3.05% in 2025, and payout ratio reached 19.64%. The year before the numbers were 3.76% and 20.11% correspondingly. See high-dividend stocks and find more opportunities for your portfolio.
As of Aug 2, 2026, the company has 73.89 K employees. See our rating of the largest employees — is Union Bank of India Limited on this list?
Like other stocks, UNIONBANK shares are traded on stock exchanges, e.g. Nasdaq, Nyse, Euronext, and the easiest way to buy them is through an online stock broker. To do this, you need to open an account and follow a broker's procedures, then start trading. You can trade Union Bank of India Limited stock right from TradingView charts — choose your broker and connect to your account.
Investing in stocks requires a comprehensive research: you should carefully study all the available data, e.g. company's financials, related news, and its technical analysis. So Union Bank of India Limited technincal analysis shows the strong buy rating today, and its 1 week rating is buy. Since market conditions are prone to changes, it's worth looking a bit further into the future — according to the 1 month rating Union Bank of India Limited stock shows the buy signal. See more of Union Bank of India Limited technicals for a more comprehensive analysis.