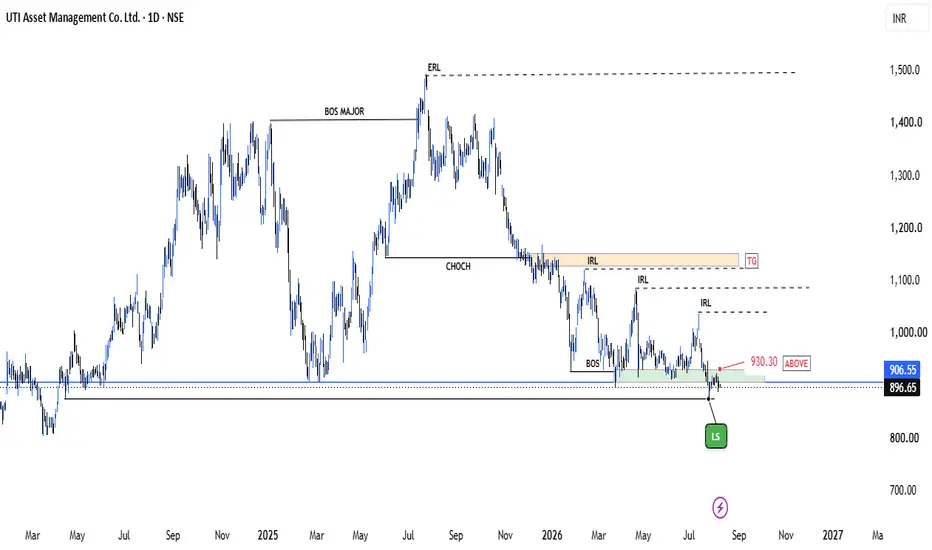
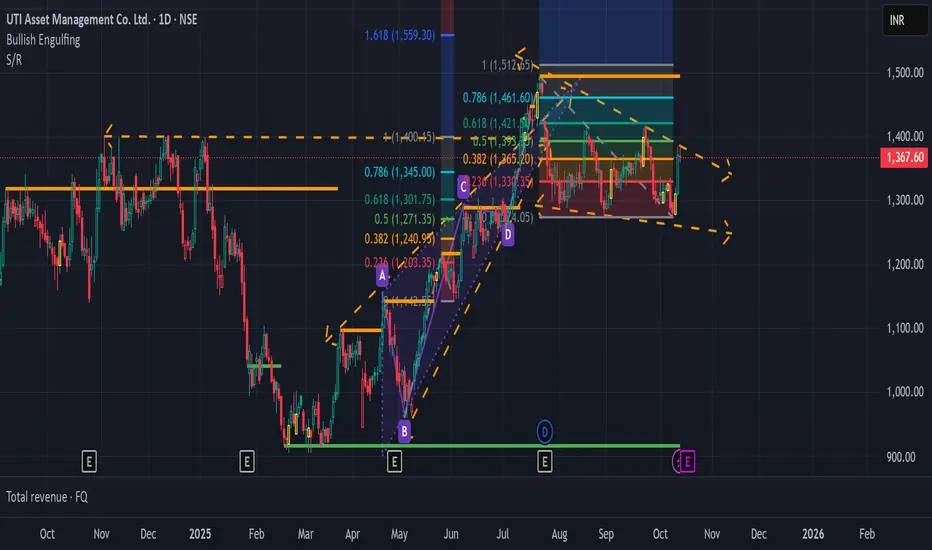
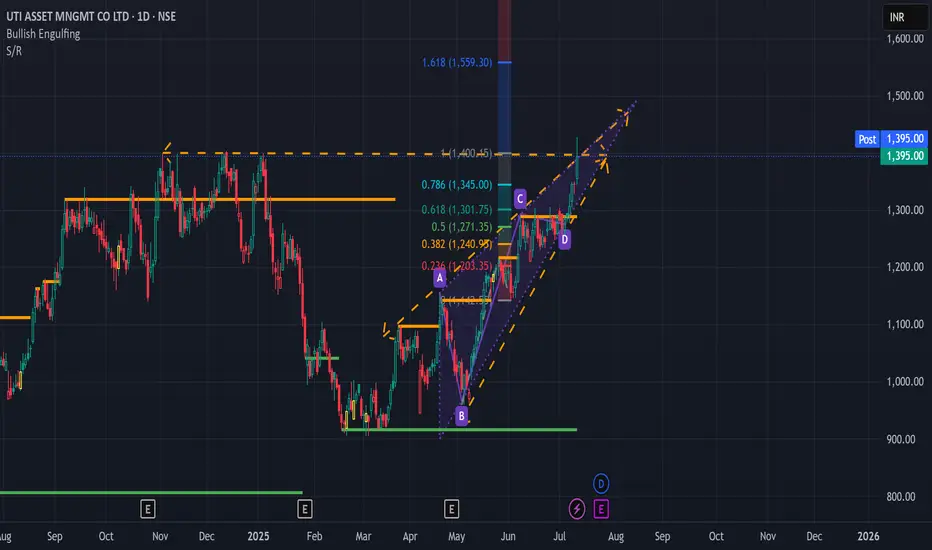
UTIAMC (D) CHARTTechnical Note: Let the market come to your zones and show its hand. Trade safely and manage your risk! Always wait for your own confirmations before entering the market.
Risk Disclaimer: This analysis is for educational purposes only and does not constitute financial advice. Always practice proper risk and position sizing. The market is supreme; no one can make a 100% accurate prediction. Stop Loss Must if you want to be a profitable Trader.
MARKET VIEW:-
Current Bias: BULLISH
Preferred Strat
UTI Asset Management Co. Ltd.
No trades
No trades
In-depth trading ideas
UTIAMCNSE:UTIAMC
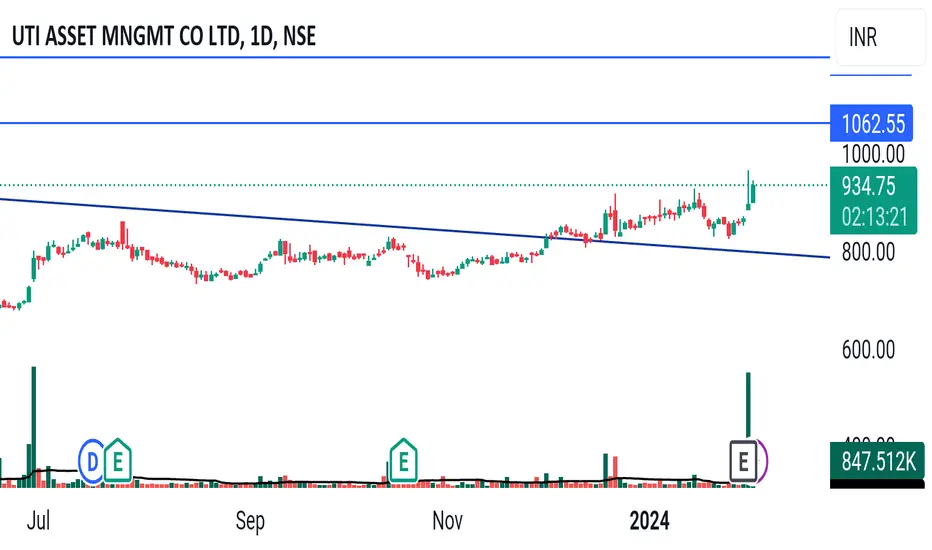
One Can Enter Now ! Or Wait for Retest of the Trendline (BO) Or wait For better R:R ratio
Note :
1.One Can Go long with a Strict SL below the Trendline or Swing Low of Daily Candle.
2. Close, should be good and Clean.
3. R:R ratio should be 1 :2 minimum
4. Plan as per your RISK appetite
Disclaimer : You are responsible for your Profits and loss, Shared for Educational purpose
Value Buy. Monthly Breakout and RetestDouble Digit ROE and ROCE
PEG Ratio ~1
PE in buy zone
DII holdings increased in last quarter
EPS continuously increasing since last 6 quarters
Technical:
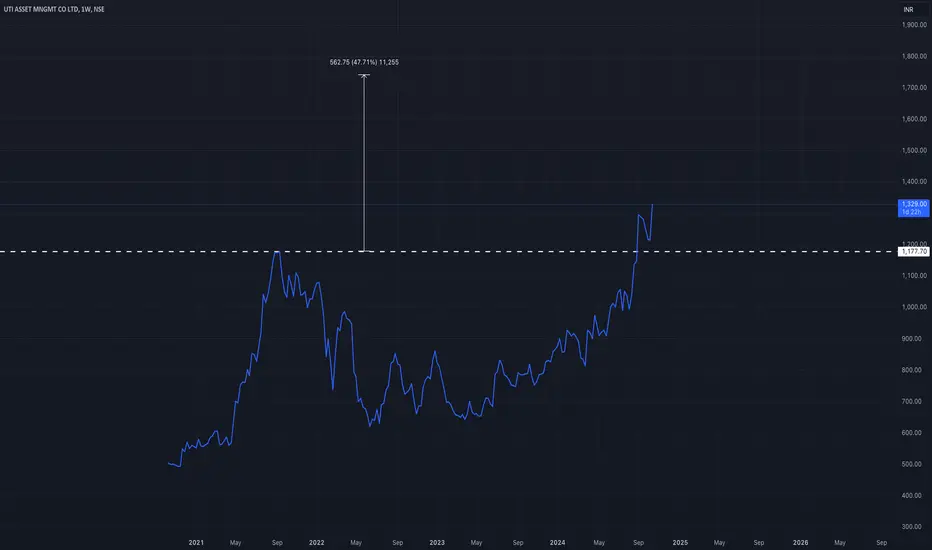
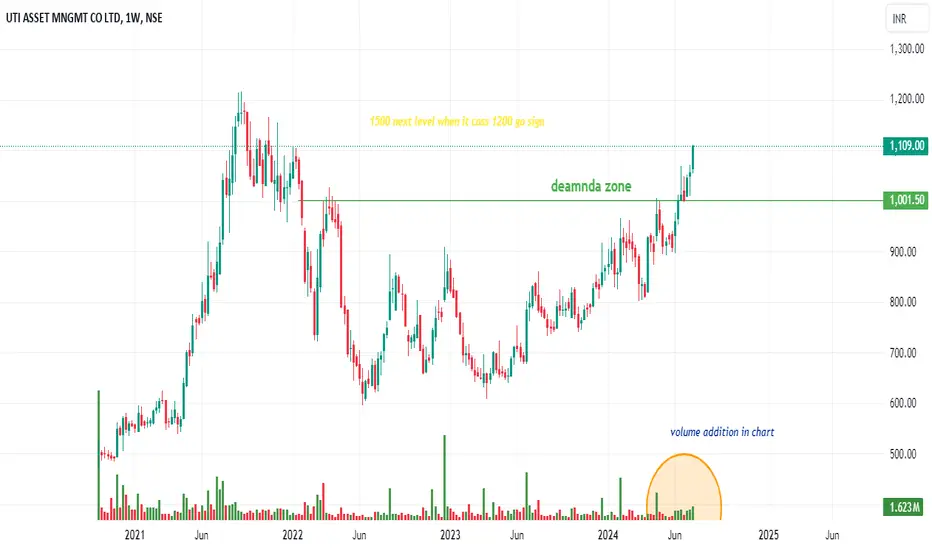
Monthly levels: Price retesting the earlier resistance and now support. From a long term perspective huge potential.
Note: Not SEBI registered. Not a buy/sell recommendation. Only sharing my analysis.
UTI ASSET MNGMT CO LTD SLRSupport and Resistance Levels:
Support Levels: These are price points (green line/shade) where a downward trend may be halted due to a concentration of buying interest. Imagine them as a safety net where buyers step in, preventing further decline.
Resistance Levels: Conversely, resistance levels (red line/shade) are where upward trends might stall due to increased selling interest. They act like a ceiling where sellers come in to push prices down.
Breakouts:
Bullish Breakout: When the price move
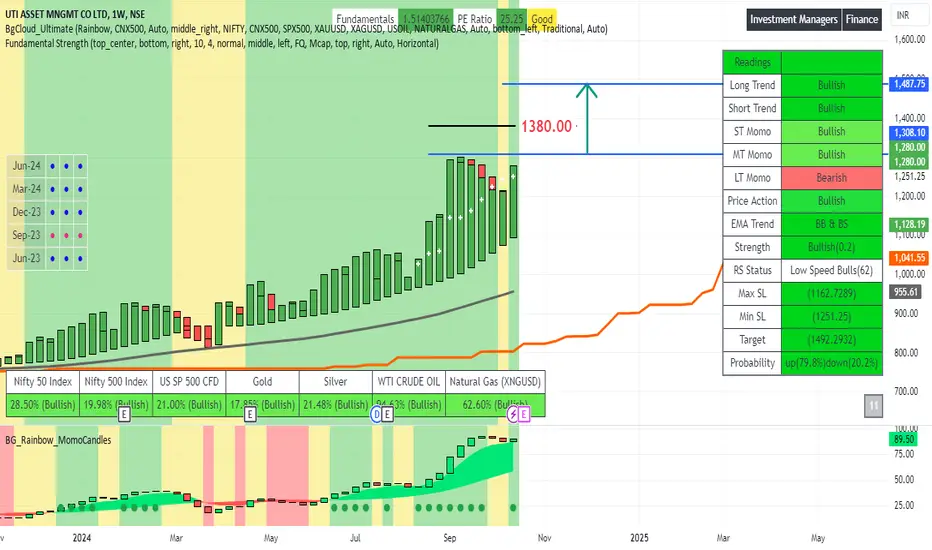
UTIAMC LongMy Template Suggesting me that: This Company is Going to Give a breakout, U can Enter Early; after 1310 Closing(weekly)
and the Left Table is Telling me: All the Fundamentals are Strong and Company is Generating Good Return Against major Indices or Commodities (in Weekly Chart)..
The Right Table is Giving me Target of 1485-90 after Breakout+Closing..
UTI AMC - Ifs and Buts !!UTI AMC is currently displaying a symmetric triangle formation on its weekly chart. Recently, it formed a double bottom pattern on the weekly timeframe, which was followed by a breakout. The stock is currently encountering a minor resistance level. Interestingly, the resistance trend channel and the 50% Fibonacci retracement level align closely, making it a strong barrier for further upward momentum.
Given the circumstances, if UTI AMC consolidates within this resistance zone before continuing
mutaul fundnow in India, the mutual fund industry is getting inflow
retail investors are more active in SIP so mutual fund house are in good condition.
This fund can take advantage of this.
FII's increase in stake from 5.97% to 6.27
The number of share houlders decreases, which is also a positive hand.
Bullish Momentum: UTI AMC Eyeing New Highs🚀 UTI AMC shows promising signs of a bullish run, poised for new highs!
📈 Strong fundamentals, positive market sentiment, and potential catalysts in play.
💡 Dive into the charts and join me in exploring the upward trajectory.
🔍 Not financial advice, just sharing my optimistic outlook. Do your research!