Varun Beverages Ltd.
No trades
No trades
Compare with Varun Beverages Ltd.
9.40 INR
30.36 B INR
209.09 B INR
1.33 B
Next report date
—
Report period
—
EPS estimate
—
Revenue estimate
—
Details
Sector
Industry
Website
Headquarters
Gurugram
Founded
1995
IPO date
Nov 8, 2016
ISIN
INE200M01039
FIGI
BBG00D605FD1
Identifiers
ISIN INE200M01039
Varun Beverages Ltd. engages in the manufacture and sale of beverages. The company products include carbonated soft drinks, non-carbonated beverages and packaged drinking water. It operates through the India and Outside India geographical segments. The company was founded by Ravi Kant Jaipuria on June 16, 1995 and is headquartered in Gurugram, India.
Varun Beverages Ltd.*Varun Beverages Ltd*
P&F on Yearly Basis.
BO above Upper Priceline of Flat to Cross & Sustained. Then sharp upside in the offerings.
Strong Volume Consolidation.
EMAs: Widening Gap amongst 20/50/100/200 levels on Weekly Monthly Basis.
RSI: H>D>W>M. All in Bullish Zone.
*Trail SL with Upside,*
*B
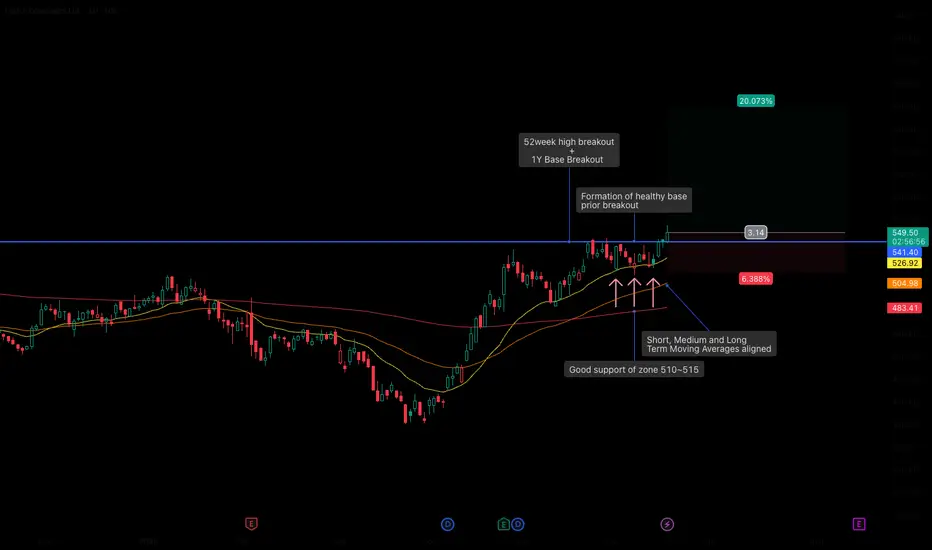
#VBL Technical Review – Bullish Flag & Pole Formation📈 #VBL Technical Review – Bullish Flag & Pole Formation
VBL appears to be forming a classic Bullish Flag & Pole pattern on the daily timeframe.
The stock witnessed a strong vertical rally from the ₹390 zone to around ₹535, creating the “pole” with strong bullish momentum and volume expansion. Afte
VBL LONGI was aways from the markets for few weeks but here i am back again. Market have been very choppy too in recent times hence positions should be taken with keeping all the risk measure in mind.
VBL has been moving good and after a trendline breakout it has retested and now it is again looking good f
Varun Beverages : Placed at Shorting zone for 10-15% DownsideNSE:VBL
Summers are the season for the industry Varun Beverages belong to.
However, stock price seems peaked out at current levels.
Any upside towards 530 will be a good opportunity for Shorting with a SL of 1-1.5%
On Daily chart, an inverted hammer appeared today on 28th April.
We can day
VBL Rounding Top Breakdown?CMP: 395
TF: Daily
The chart set up is self explanatory.
As long as the price trades below 420 (A close above 420 on Daily Basis will be the Stoploss), the stock could head down towards 330 and 260 levels in the coming days.
For now, Momentum indicators show closer to oversold levels and a bounce
vbl chart end Analysis
Primary (Long-term) Trend
Downtrend / Distribution phase
Price peaked near ₹680 and has been making lower highs & lower lows
Long-term investors are still selling into rallies
Structure = Bearish to sideways, not a fresh bull trend yet
👉 Long-term trend has NOT reversed.
Intermediate /
Varun Beverages Limited (VBL) Reedy to explode ? VBL has faced resistance by the 200 EMA 7 times in the past year and also basing out around 430-440 levels, a picture perfect wedge. The break is coming soon and with it an overdue bull run.
Fundamentals also look great, this can be a portfolio stock as well.
Personally i will be treating it as a
VBL : Ready to give you 30% within 06 MonthsHi Friends,
VBL looks promising now & ready for ~30% (648) upward journey. I am anticipating the stock to start its upward journey.
Targets, Stoploss & Entry are mentioned in the chart .
Please feel free to share your views regarding this chart & analysis .
Note : I am not a SEBI registered ad
Varun Beverages Rebound Setup from Strong Weekly Demand ZoneThe price is respecting a major weekly demand zone around 440–460, showing multiple rejection wicks and a positive bounce, indicating buyer accumulation. As long as the price holds above this zone, the structure favors a potential upside toward the previous supply / resistance area near 620–640. A w
See all ideas
Summarizing what the indicators are suggesting.
Neutral
SellBuy
Strong sellStrong buy
Strong sellSellNeutralBuyStrong buy
Neutral
SellBuy
Strong sellStrong buy
Strong sellSellNeutralBuyStrong buy
Neutral
SellBuy
Strong sellStrong buy
Strong sellSellNeutralBuyStrong buy
An aggregate view of professional's ratings.
Neutral
SellBuy
Strong sellStrong buy
Strong sellSellNeutralBuyStrong buy
Neutral
SellBuy
Strong sellStrong buy
Strong sellSellNeutralBuyStrong buy
Neutral
SellBuy
Strong sellStrong buy
Strong sellSellNeutralBuyStrong buy
Displays a symbol's price movements over previous years to identify recurring trends.
Frequently asked questions
The current price of VBL is 457.95 INR — it has decreased by −0.23% in the past 24 hours. Watch Varun Beverages Ltd. stock price performance more closely on the chart.
Depending on the exchange, the stock ticker may vary. For instance, on BSE exchange Varun Beverages Ltd. stocks are traded under the ticker VBL.
VBL stock has fallen by −2.49% compared to the previous week, the month change is a −10.01% fall, over the last year Varun Beverages Ltd. has showed a −6.24% decrease.
We've gathered analysts' opinions on Varun Beverages Ltd. future price: according to them, VBL price has a max estimate of 657.00 INR and a min estimate of 500.00 INR. Watch VBL chart and read a more detailed Varun Beverages Ltd. stock forecast: see what analysts think of Varun Beverages Ltd. and suggest that you do with its stocks.
VBL stock is 1.74% volatile and has beta coefficient of 0.98. Track Varun Beverages Ltd. stock price on the chart and check out the list of the most volatile stocks — is Varun Beverages Ltd. there?
Today Varun Beverages Ltd. has the market capitalization of 1.55 T, it has decreased by −1.29% over the last week.
Yes, you can track Varun Beverages Ltd. financials in yearly and quarterly reports right on TradingView.
Varun Beverages Ltd. is going to release the next earnings report on Jul 28, 2026. Keep track of upcoming events with our Earnings Calendar.
VBL earnings for the last quarter are 2.60 INR per share, whereas the estimation was 2.42 INR resulting in a 7.29% surprise. The estimated earnings for the next quarter are 4.35 INR per share. See more details about Varun Beverages Ltd. earnings.
Varun Beverages Ltd. revenue for the last quarter amounts to 65.74 B INR, despite the estimated figure of 60.56 B INR. In the next quarter, revenue is expected to reach 86.30 B INR.
VBL net income for the last quarter is 8.72 B INR, while the quarter before that showed 2.52 B INR of net income which accounts for 0.00% change. Track more Varun Beverages Ltd. financial stats to get the full picture.
Varun Beverages Ltd. dividend yield was 0.31% in 2025, and payout ratio reached 16.71%. The year before the numbers were 0.16% and 12.58% correspondingly. See high-dividend stocks and find more opportunities for your portfolio.
As of Jul 26, 2026, the company has 29.43 K employees. See our rating of the largest employees — is Varun Beverages Ltd. on this list?
EBITDA measures a company's operating performance, its growth signifies an improvement in the efficiency of a company. Varun Beverages Ltd. EBITDA is 53.14 B INR, and current EBITDA margin is 20.79%. See more stats in Varun Beverages Ltd. financial statements.
Like other stocks, VBL shares are traded on stock exchanges, e.g. Nasdaq, Nyse, Euronext, and the easiest way to buy them is through an online stock broker. To do this, you need to open an account and follow a broker's procedures, then start trading. You can trade Varun Beverages Ltd. stock right from TradingView charts — choose your broker and connect to your account.
Investing in stocks requires a comprehensive research: you should carefully study all the available data, e.g. company's financials, related news, and its technical analysis. So Varun Beverages Ltd. technincal analysis shows the sell today, and its 1 week rating is sell. Since market conditions are prone to changes, it's worth looking a bit further into the future — according to the 1 month rating Varun Beverages Ltd. stock shows the sell signal. See more of Varun Beverages Ltd. technicals for a more comprehensive analysis.
If you're still not sure, try looking for inspiration in our curated watchlists.