Welspun Living Ltd – (Daily): Breakout SetupWelspun Living Ltd – Daily Chart Breakout Setup
After spending nearly 15 months in a broad consolidation range, Price is attempting to break above the upper boundary of a long-term trading range.
Multiple rejections near ₹145 are being challenged again, increasing the probability of a decisive breakout.
Volume participation has started improving during the recent advance, suggesting institutional interest.
A successful close above the resistance zone with expanding volume during the breakout could trigger a fresh markup phase.
✅ Entry: Above ₹146 on a convincing breakout and close.
🛑 Stop Loss: ₹127 (below recent swing support).
🎯 Target Zone: ₹200–202
Approximate R:R = 1:3
This is a trade setup for educational purposes only. Manage risk according to your trading plan and position sizing rules.
Welspun Living Limited
No trades
No trades
In-depth trading ideas
Welspun breakout🔍 Chart Overview
Welspun Living has been in a prolonged downtrend, respecting a descending trendline from the ₹170–180 zone. Price has consistently made lower highs, confirming bearish structure.
Currently, price is approaching a key breakout zone near ₹140–₹142, right at the falling trendline resistance and cluster of moving averages.
📈 Key Observations
✅ Descending Trendline Resistance
Multiple rejections from this trendline
Current price testing this zone again → decision point
✅ Moving Average Confluence
20/50/100/200 SMA cluster around ₹135–₹147
Price attempting to reclaim this zone → bullish sign if sustained
✅ Higher Low Formation
Recent move from ₹110 → ₹140
Indicates building bullish momentum
✅ RSI Strength
RSI ~58 and trending upward
Shows improving momentum without being overbought
🚀 Trade Setup
Bullish Scenario (Preferred)
Entry: Above ₹147 (clean breakout + closing basis)
Targets: ₹155 / ₹165 / ₹175
Stop Loss: Below ₹132
Bearish Scenario (Rejection)
If rejected from trendline:
Downside targets: ₹130 → ₹120
WELSPUN LIVING LTD S/RSupport and Resistance Levels:
Support Levels: These are price points (green line/shade) where a downward trend may be halted due to a concentration of buying interest. Imagine them as a safety net where buyers step in, preventing further decline.
Resistance Levels: Conversely, resistance levels (red line/shade) are where upward trends might stall due to increased selling interest. They act like a ceiling where sellers come in to push prices down.
Breakouts:
Bullish Breakout: When the price moves above resistance, it often indicates strong buying interest and the potential for a continued uptrend. Traders may view this as a signal to buy or hold.
Bearish Breakout: When the price falls below support, it can signal strong selling interest and the potential for a continued downtrend. Traders might see this as a cue to sell or avoid buying.
20 EMA (Exponential Moving Average):
Above 20 EMA(50 EMA): If the stock price is above the 20 EMA, it suggests a potential uptrend or bullish momentum.
Below 20 EMA: If the stock price is below the 20 EMA, it indicates a potential downtrend or bearish momentum.
Trendline: A trendline is a straight line drawn on a chart to represent the general direction of a data point set.
Uptrend Line: Drawn by connecting the lows in an upward trend. Indicates that the price is moving higher over time. Acts as a support level, where prices tend to bounce upward.
Downtrend Line: Drawn by connecting the highs in a downward trend. Indicates that the price is moving lower over time. It acts as a resistance level, where prices tend to drop.
Disclaimer:
I am not a SEBI registered. The information provided here is for learning purposes only and should not be interpreted as financial advice. Consider the broader market context and consult with a qualified financial advisor before making investment decisions.
SWING IDEA - WELSPUN LIVING Welspun Living , a leading company in the home textiles sector, is presenting a compelling swing trading opportunity based on several key technical indicators.
Reasons are listed below :
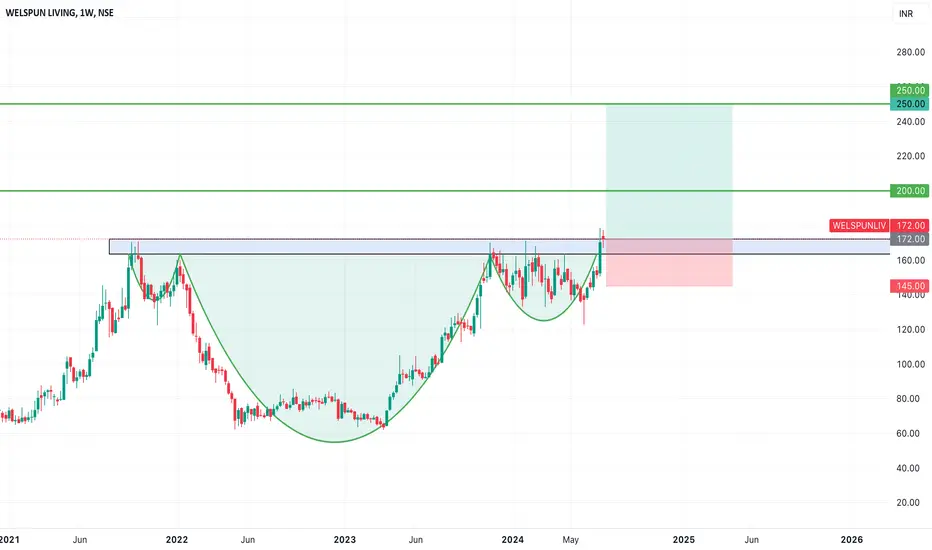
Head and Shoulder Pattern Breakout : The price has broken out of a head and shoulder pattern, indicating a bullish reversal and potential for further upward movement.
170 Resistance Zone Breakout : The 170 level was a significant resistance zone. The price has broken out above this level and is sustaining, indicating strong bullish momentum.
Bullish Marubozu Candle with a Strong Close : The recent formation of a bullish marubozu candle with a strong close signifies strong buying pressure and suggests potential for continued upward movement.
Breaking 3+ Years of Consolidation : The stock is breaking out of a long consolidation phase that lasted over three years, signaling the start of a new bullish trend.
Gradual Increase in Volumes : A noticeable increase in trading volumes confirms the strength of the price move and indicates growing investor interest.
Trading Above 50 and 200 EMA on Weekly Timeframe : The stock is finding support at both the 50-week and 200-week exponential moving averages (EMA), reinforcing the overall bullish sentiment and providing strong support levels.
Trading at All-Time High : The stock is trading at its all-time high, suggesting strong market confidence and potential for further gains.
Target - 200 // 250
Stoploss - weekly close below 145
DISCLAIMER -
Decisions to buy, sell, hold or trade in securities, commodities and other investments involve risk and are best made based on the advice of qualified financial professionals. Any trading in securities or other investments involves a risk of substantial losses. The practice of "Day Trading" involves particularly high risks and can cause you to lose substantial sums of money. Before undertaking any trading program, you should consult a qualified financial professional. Please consider carefully whether such trading is suitable for you in light of your financial condition and ability to bear financial risks. Under no circumstances shall we be liable for any loss or damage you or anyone else incurs as a result of any trading or investment activity that you or anyone else engages in based on any information or material you receive through TradingView or our services.
@visionary.growth.insights
A very good breakout with the strong volumeIf you see this chart RSI both weekly and monthly chart is above 60 and volume also hues in the last candle and resistance also break build the used volume huge volume so this chart is must read carefully you can see very nice successful breakout which already done a new high will be on pipeline
#WELSPUNLIV is breaking out#WELSPUNLIV broke out after >2.7 years of facing resistance. Also, it is forming a cup and handle pattern and looks very bullish as the volumes are also supporting the breakout.
In my opinion, we can long here with a target of 300 and SL of 150.
Do your own research before investing.
Welspun living : CMP 153.66-Stock looking good for swing trade (15-20% ) as well as long term.
-it has made pole and flag pattern on weekly chart and going to make cup and handle pattern with increasing volumes.
-Safe trader take entry after breaking its ATH.
.
-annual Profits are increasing .
-PE ratio 22 is very low as compare to industry PE which 56
-FII holding 7%.
.
.
Only for educational purpose
Do not keep SL more than 10%