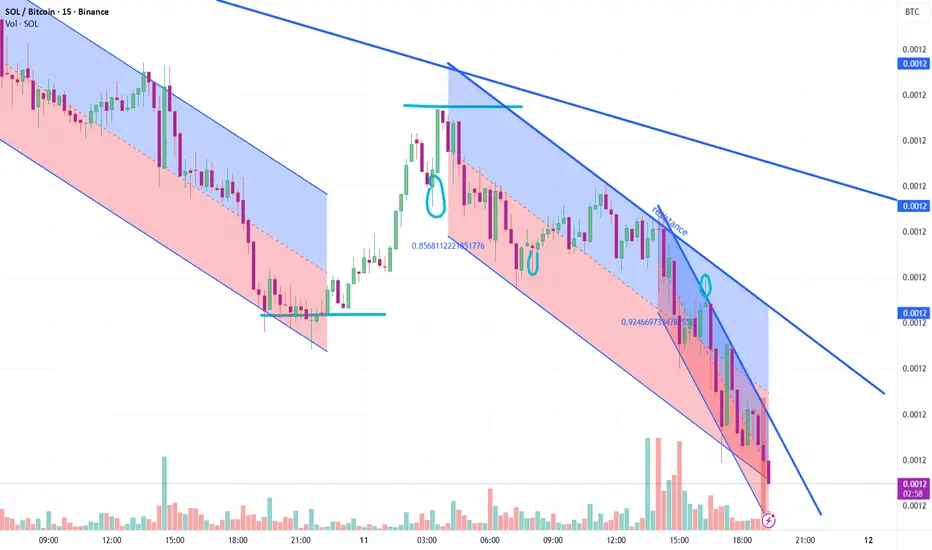
SOL/BTC - Significant Low FormingRight now SOL, in relation to BTC, is looking to form a significant low. If successful, that would mean SOL should begin gaining value against Bitcoin.
To understand this fully, we must first examine what has happened since the bull market top.
The Daily 100 MA
The first point of focus is the 100 moving average on the daily timeframe (red MA). This is where the SOL/BTC top formed at the end of October 2025 (red circle). It then marked the top again in January 2026, once more in May 2026, and again with the daily candle bodies in June 2026.
Now SOL/BTC is once again testing this same key moving average, but this time price is using it as a level of demand rather than supply (green circles). The first test occurred on July 24th, and then yesterday and today (July 29th and 30th), SOL/BTC saw two clean liquidity tests of this level with wicks triggering algo buy orders. For this pair, accumulation shows up as BTC being converted into SOL, which increases SOL's ratio against BTC.
The Downward Channel
The next structure worth outlining is the downward channel (black trendlines) that formed over four months, from February 2026 to the low established in June.
This channel marked many tops to the upside and many lows to the downside. Let's look at the lows first. In February 2026 price saw a low followed by two lower lows (green arrows). At the same time, the RSI saw a low followed by two higher lows (green arrows), forming a clear bullish divergence on the daily timeframe. Shortly after that divergence was established, SOL increased 35% relative to BTC.
Looking at the upper black trendline near the end of June, SOL/BTC saw a breakout and successful retest of the trendline, giving the ratio the strength to begin its massive 23% increase from that retest alone. This is structurally significant for the future of this trend.
The Psychological Level
One final structural note is that the ratio bottomed extremely close to 0.001. That means 1 SOL would be equivalent to 0.001 BTC, or in other words, 1,000 SOL = 1 BTC, an extremely important psychological level for SOL/BTC's macro structure.
The 0.618 Fibonacci Confluence
The final piece worth outlining is that this significant low is also forming right at the 0.618 retracement of SOL/BTC's current trend.
Looking at the move from the low on June 6, 2026 to the high on July 2, 2026, the 0.618 golden retracement level sits at almost the exact same price as the 100 MA and the wick lows established over the past two days. This is nothing to ignore and adds further weight to the theory that SOL is about to begin outperforming Bitcoin, even if only in the short term.
Upside Targets
Right now the upside targets for where this move could reach are the dotted green ray around 0.00129, and the current supply zone (red box) sitting between 0.00133 and 0.00138.
In-depth trading ideas
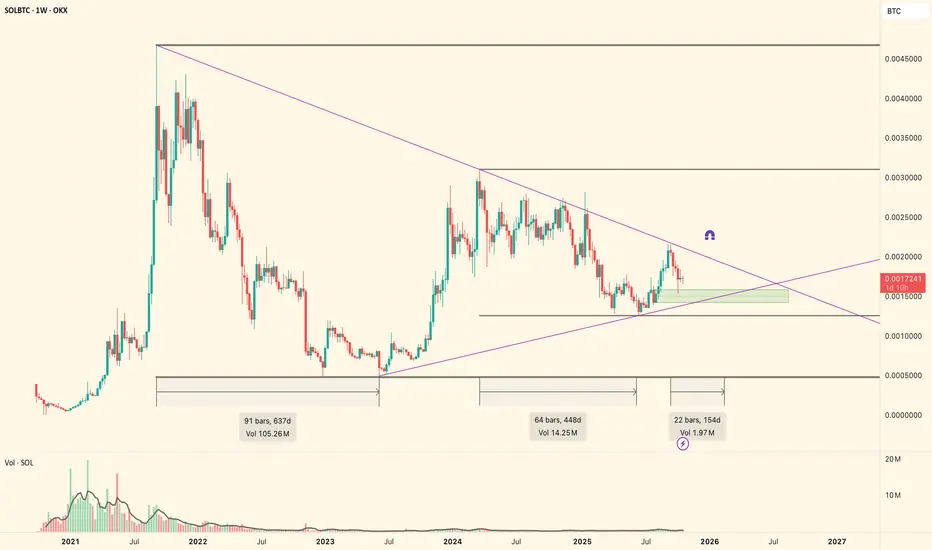
SOL vs BTC has triggered a Head and Shoulders.LA Vape Cabal
Donald Trump
Dave Portnoy
Libra
The band of thieves operating on Solana has stripped away all the opportunities for retail investors. Their relentless stealing has created a bitter experience for newcomers, while the veteran retail investors are barely hanging on.
The SOLBTC chart clearly shows the formation of a head and shoulders pattern, which has been triggered and is poised to significantly diminish satoshi value.
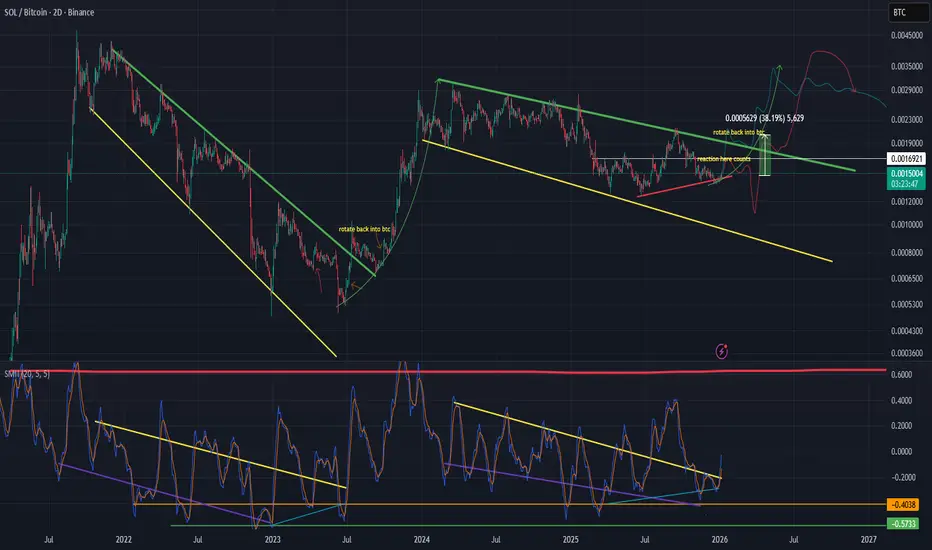
Solana (SOLBTC): Early Signs of Strength Within Wave 4 TriangleSolana continues to display improving relative strength against Bitcoin, with the SOLBTC pair showing a clear shift in momentum after a completed corrective phase. Price action is increasingly constructive, suggesting that buyers are regaining control within a larger higher-timeframe consolidation structure.
On the weekly timeframe, SOLBTC remains within a broad bullish (A)(B)(C)(D)(E) triangle formation in wave 4. This type of structure typically represents a long consolidation phase before a major directional breakout. As long as the triangle remains intact, the broader bias stays bullish, with the market likely preparing for a strong expansion phase once wave 4 completes. Current price behavior continues to respect key structural boundaries, reinforcing the idea that this is still a developing corrective pattern rather than a trend reversal.
On the daily chart, momentum has started to shift more clearly in favor of the bulls. Price action is developing an impulsive advance that can be interpreted as the early stages of a new wave A within a larger ABC structure inside wave (D) of the triangle. This suggests that the current rally may still be in its initial phase, with room for further continuation before any meaningful corrective pullbacks occur.
If this interpretation holds, short-term dips should remain corrective in nature, with buyers likely stepping in on retracements as the structure matures. The broader technical picture remains constructive, especially as SOLBTC continues to rebound from previously identified support levels and confirms the completion of its prior ABC correction.
SOLBTC: Risk Appetite Improving Above the CloudBINANCE:SOLBTC daily
This is an interesting chart for crypto risk appetite.
SOL has pushed above the Ichimoku cloud after a long period of relative weakness against BTC. The move is also supported by the lagging line clearing the cloud, which adds some confirmation that momentum has shifted in SOL’s favor.
That said, the short-term move is now somewhat extended. A pullback toward the cloud, especially around Span B / the upper cloud area, would be a normal place to look for a retest.
If price can hold that area, the structure remains constructive and suggests improving appetite for higher beta crypto exposure.
If price loses the cloud again, the rotation becomes much less convincing and this may simply turn into another failed relative strength attempt.
On weekly Ichimoku we are currently facing Kijun-sen/Base line as resistance under the Cloud.
For now:
Above the cloud = constructive.
Pullback into cloud support = healthy retest.
Lagging line above cloud = momentum confirmation.
Lose the cloud = caution.
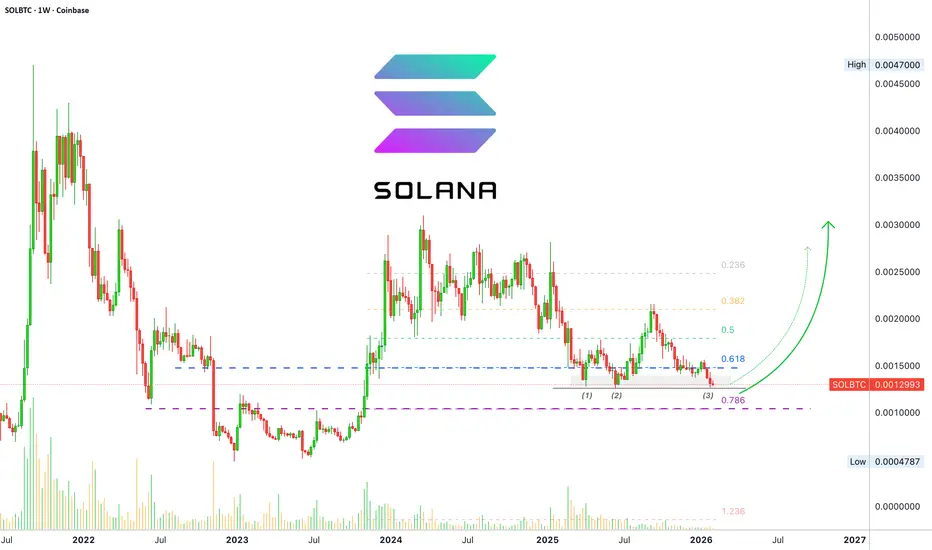
SOLBTC · Mixed but I am bullish · My personal trading experienceI know, I know. I know what you are going to say. That I am always drinking champagne.
Well, maybe or maybe not, but I am only always bullish when the action happens at support.
Here we are looking at Solana vs Bitcoin and I shall explain why this is a mixed bag and why I am bullish nonetheless.
The trading is now sandwiched between 0.618 and 0.786 Fib. retracement levels. Needless to say, since rejection at resistance produced the current chart, and there are several long-term lower highs, we can consider this chart bearish.
Normal, absolutely understandable. But, bullish action always start when prices are low or near support.
Notice the numbers on the chart, 1,2,3. The 1 and the 2 were in the same situation as we are now. In between 0.618 - 0.786 Fib. Bearish but the market turned bullish. Trading volume has gone down to zero but this doesn't reveal a bullish bias, it simply reveals that a strong move will happen next but it can happen to any one side.
Yet, the trend has been bearish based on the lower highs, thus, decreasing volume is a bad signal for the current move which is bearish. It reveals that the bearish move has been losing momentum for years and this in reverse can be read as a bullish signal.
The market is tricky though. A reversal can happen but when?
There can be a crash, just to search for liquidity and then we see growth. There can be growth right away because the action is happening at an already tested and confirmed support.
While there is always risk when making any choice, we buy at support when prices are low. If prices drop, just follow your plan. Some people use a stop-loss, others are ready to wait. What is your plan? How would you approach the market in different scenarios? That is what you need to plan for.
If you ask me, I buy and hold. If prices move lower, I buy more. If prices move higher, perfect, that is a win and I plan to take profits on the way up. This is just one way of course based on spot.
With margin, I enter slow building a position overtime because the market tends to produce as many lows as it can before moving ahead. So I never go 100% in at one time, instead, accumulate slowly with back up funds. If lower, add more. When the market start to move, I just let it run.
Namaste.
Buy accumilation I thought it was going to be an intra day trade for yesterday but itwas one of the lowest volume days in a long time.
We have been getting exhausted on the sells and higher lows. My buy signals just keep flashing.
Might be a possibly bullish move to end the weekly green. We need the volume to show up today/just before weekly close.
I will keep buying as long as my signal keeps flashing have price targets at 1:2
TP around 130 area.
I also want to make it clear i getthe buy signals on Sol/Btc and execute on Sol/Usdt.
This poat does not constitute financial advice it is just simply my humble perspective.
$SOL/$BTC (DAILY): GOLDEN POCKET bound and UPTRENDCRYPTOCAP:SOL vs CRYPTOCAP:BTC looks ripe on the WEEKLY, so let's zoom in on the DAILY for a better idea.
First of all, the 200 MA, the green upcurving KEY moving average, has held as additional support level in confluence with the GOLDEN POCKET.
We saw a good bounce and now it looks ready for some WAVE 3 explosive action, as soon as the imnediate resistance is overcome.
BULLISH MACD crossover, this chart should become super bullish once above the yellow 50 MA, my main short-term momentum boundary of sorts.
Beyond the TA, I also expect a usual SELL-THE-NEWS added selling pressure after the SOLANA #etf has gone live today.
Regardless, if the charts signal BULLISHNESS, I will take my LONG set-up above $206 (hopefully not before the FOMC, I would rather avoid new positions in the lead-up to FED'S decision tommorow.
👽💙
$SOL/$BTC (WEEKLY): BULLISHNESS brewing, MONEY WAVE next?CRYPTOCAP:SOL or CRYPTOCAP:BTC in the upcoming weeks and months, mid-term thesis. Last checks before I pull the trigger on SOLANA long (above $206, as per my previous posts).
So the WEEKLY chart first, these alt vs btc are my reliable, additional foundations in high-probability trading set-ups.
Important to note that SOLANA corrected for 15 months between MARCH 24 and JUNE this year, and since late JUNE we saw a big reversal (DOUBLE BOTTOM) followed by a local top last month. HIGHER HIGH after EQUAL LOWS, bullish.
Last 5-6 weeks, Solana has been correcting, hit a common retracement level called the GOLDEN POCKET, which suggests that the correction could be marked as WAVE 2.
In this case, WAVE 3, my favourite MONEY WAVE, up next. HIDDEN BULLISH divergence flashing makes this much more likely as well.
The light-blue box overhead is resistance, once above, I think SOL will absolutely rip up.
Need a look into smaller timeframes, but this WEEKLY is showing some serious BULLISHNESS brewing.
👽💙
$SOL / $BTC 50WMA Reclaimed - Alt Season Confirmed!Ladies and Gentlemen,
CRYPTOCAP:SOL / CRYPTOCAP:BTC has officially closed the Week above the 50WMA and is back within the POI.
Double bottom confirmed this setup.
Along with the longest cup and handle I’ve ever seen lol.
Let the rotation for Alt Season begin!
SOLBTCSOLBTC is on the brink of a HVF compliant RH3. We expect a small pullback to wind up before breaking out against BTC. Alts outperforming BTC is bull market conditions.
Too late now to catch the current leg, don't FOMO in. Keep in weekly review to find the right price to go big.
Fundamentals:
- Chose coin
- Doller weakness environment
- Rate cuts expected after weak economic data
Will Solana Recover? SOLBTC Reveals the AnswerThe truth is that we can find the answer by looking at SOLBTC (Solana vs Bitcoin). If we have a bearish SOLBTC then we know the market is about to tank and about to do so wildly. But, with a bullish SOLBTC we know Solana to be bullish and related altcoins as well. Let's dive into this chart and see what it has to say.
SOLBTC peaked March 2024. A peak is always followed by a correction and this time it took a while before support broke. SOLBTC went into distribution and crashed earlier to reach long-term support. The support zone established appeared just below 0.618 and right above 0.786 Fib. retracement. SOLBTC activated the lowest prices since November 2023.
This last part represents the rounded bottom on the chart between April and August 2025. Notice how SOLBTC is trading back above 0.618 Fib. retracement. This makes this a very strong bullish setup.
Back in September 2021, SOLBTC peaked and produced a drop. The drop or bear market resulted in a huge rounded bottom and from this bottom a recovery, the recovery leads to a bullish cycle and wave. Currently we are in this bullish cycle.
The recent drop is a long-term higher low. We are now entering a new recovery phase and this will lead to massive growth. Seeing SOLBTC being extremely bullish long-term, we know SOLUSDT (Solana vs Tether) is also set to grow. There you have your proof.
By the way, SOLBTC is now good for a LONG trade. I will give this chart a closer look.
Namaste.
$SOLBTC Broke down. Same with $SOLETH. Will it rebound? We peaked in CRYPTOCAP:BTC.D chart as we predicted here.
CRYPTOCAP:BTC weathering the storm: CRYPTOCAP:BTC.D close to 66%. CRYPTOCAP:BTC to 160K. for BITSTAMP:BTCUSD by RabishankarBiswal — TradingView
Since then, Altcoins have shown signs of strength and CRYPTOCAP:ETH.D is bouncing back with BITSTAMP:ETHUSD at 4000 $. Please check my CRYPTOCAP:ETH.D blog here.
CRYPTOCAP:BTC.D : Cycle tops are in. CRYPTOCAP:ETH.D : Bounce form the all-time lows for CRYPTOCAP:BTC.D by RabishankarBiswal — TradingView
CRYPTOCAP:SOL being one of the large caps within the Altcoin must participate for the Altcoin summer to happen. But when we plot the BINANCE:SOLBTC and BINANCE:SOLETH then we see a broken chart with a fall from the cliff. On July 6th I wrote theta §SOLBTC looks bearish and we might find it difficult to break out of the range 0.0025 to 0.00125.
BINANCE:SOLBTC : Little strength to show for. for BINANCE:SOLBTC by RabishankarBiswal — TradingView
I put the BINANCE:SOLETH on the same chart and I was surprised how perfectly fit between the Fib retracement level. 😊 Now we would like to see where this chart goes and where does it bounce back. We see that the favorite range where BINANCE:SOLETH spends most of the time is between 0.053 to 0.04. Currently the ratio is at 0.044. My estimate is that the ratio will bounce back from the psychological level of 0.04 and then bounce atleast to 0.06 which is the mid-point of the upward slopping channel on $SOLETH.
Verdict: Altcoin summer is on. BINANCE:SOLETH is short term bearish but medium term bullish with 0.06 as target.
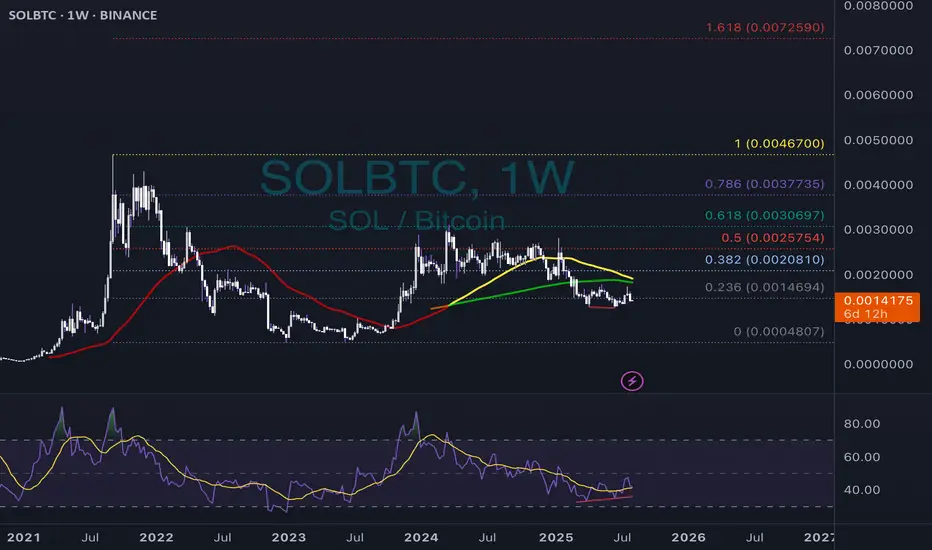
Sol/Btc✨ Solana vs Bitcoin — a quiet moment before the move?
📍 First week of August 2025
From the roaring highs of 2021,
Solana slowly faded under Bitcoin’s shadow…
Now resting around 0.0014 BTC,
breathing quietly, perhaps gathering strength:
🔸 RSI shows a bullish divergence — momentum building.
🔸 Moving averages (red & yellow) still overhead, but the gap is narrowing.
🔸 Key resistances:
▫️ 0.0020 → 38.2% Fib
▫️ 0.0025 → 50% Fib
▫️ 0.0030 → the golden 0.618 Fib.
🔮 Scenarios:
1️⃣ Break above 0.0020 → a fresh wave toward 0.0030 and beyond.
2️⃣ Rejection → a revisit to 0.0012 ~ 0.0014 BTC zone to reload.
📌 For now, the market holds its breath…
Will Solana awaken?
Or remain in Bitcoin’s shadow a little longer? 🌙
SOLBTC - Still Showing Strength Sol finally catching up to the recent momentum we have seen with other crypto assets such as BTC, ETH, and XRP.
Looking at the SOLBTC chart we can see that we are trying to breakout of the second resistance structure. As long as price does not close the daily below this trendline then it should act as a new level of support.
The orange trendline at the top will be key for the BTC pair as well as the USD pair and would be our extension target for a large pump in price to the upside.
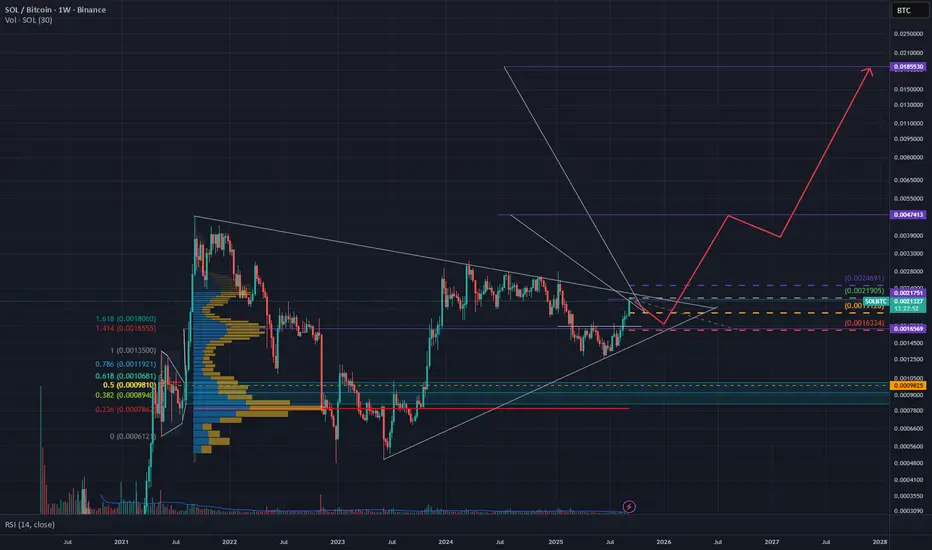
SOL/BTCI've been talking smack about SOL/BTC, because it has a gap below, and I just assumed that when BTC goes for $1M, Sol would get drained in sats. I have to admit though that it's holding up better than I thought. I've said in past posts that I predicted that about 20 coins will "hold in sats" when BTC.D runs for 95% gap fill. Maybe SOL can survive after all.
$SOLBTC: Little strength to show for. In the crypto space we time and again regularly focus on the CRYPTOCAP:BTC and the CRYPTOCAP:BTC.D chart and we have time and again predicted that CRYPTOCAP:BTC.D will touch at least 66% in this Crypto cycle. This CRYPTOCAP:BTC Dominance can be interpreted not only as the CRYPTOCAP:BTC superiority but the weakness of Altcoins. Most of it comes from the big caps like CRYPTOCAP:ETH and $SOL.
On June 23 we wrote about the BINANCE:ETHBTC failed breakout, and we put forward the case why the chart looks bearish.
BINANCE:ETHBTC failed multiyear breakout. for BINANCE:ETHBTC by RabishankarBiswal
The second largest Altcoin CRYPTOCAP:SOL is also not showing any strengths either. The BINANCE:SOLBTC chart is still range bound within the 0.618 and 0.786 Fib retracement levels. It has failed to break out of this channel, and it is boxed within the downward sloping wedge which also is not bullish for the crypto pair. The best case is BINANCE:SOLBTC sweeps the 0.5 Fib levels at the highs and 0.786 at the lows. That means BINANCE:SOLBTC valuation will be 0.0025 at its upper range and 0.001125 at its lower bound.
Verdict: BINANCE:SOLBTC range bound between 0.0025 to 0.00125 with downward bias.