Bitcoin Near A Critical Turning Point on 2HBitcoin Recovers Into A Fresh Supply Zone After Aggressive Selling
Bitcoin has staged a steady recovery after experiencing an aggressive bearish expansion that erased the previous bullish structure. The rebound has been constructive, but price is now approaching a fresh intraday supply zone, which marks the origin of the latest selling pressure and represents an area where sellers may attempt to regain control.
The current recovery reflects improving short-term buying momentum, yet the broader bearish structure remains intact until this resistance is successfully reclaimed. The highlighted supply zone also coincides with the previous breakdown area, making it a technically significant level where market participants are likely to reassess positions.
This resistance zone now becomes the key area to monitor, as the upcoming reaction will likely determine whether Bitcoin develops a stronger recovery or resumes its prevailing bearish move.
Speculative Outlook
If buyers successfully absorb the selling pressure inside the highlighted supply zone and produce sustained bullish closes above resistance, Bitcoin could extend its recovery toward higher liquidity levels, indicating that short-term market sentiment is shifting back in favour of the bulls.
However, if sellers defend the supply zone with strong rejection candles and bearish confirmation, the current rally may remain a corrective pullback, increasing the probability of another decline toward the recent swing lows. Confirmation through price action and volume will remain essential before anticipating the next directional move.
In-depth trading ideas
BTCUSD Bullish Reversal from Discount ZoneBTCUSD is approaching a key demand area after a strong intraday decline, with price reacting near the discount zone and the previous daily low (PDL). The chart highlights a potential bullish recovery if buyers defend this support and reclaim higher intraday structure.
The marked bullish zone represents an area where buying interest may increase. A sustained move above the equilibrium level could shift short-term momentum in favor of buyers, opening the possibility of a retest of the previous daily high (PDH) and, if momentum continues, the premium liquidity area.
The recent decline into support may also be viewed as a liquidity sweep before a potential recovery. However, if price fails to hold the highlighted support zone and closes below it with continued selling pressure, the bullish scenario becomes less likely and additional downside movement may follow.
This analysis is based on market structure, liquidity concepts, and key support and resistance levels. It is intended for educational purposes only and should not be considered financial or investment advice. Always wait for your own confirmation and apply proper risk management before making any trading decisions.
Profit Is the Effect, Not the Daily JobMany traders open the charts focused on the payout, the challenge target or the amount they need this month.
That creates pressure before the first setup even appears.
Your daily job is not to force an outcome from the market. Your job is to produce the causes:
1️⃣ Wait for your session.
2️⃣ Take only the setup written in your plan.
3️⃣ Keep risk fixed.
4️⃣ Accept the planned loss without trying to repair it immediately.
5️⃣ Record the decision honestly.
Profit is a possible byproduct of executing an edge over a large sample. It is not something one trade owes you.
The more desperately you need today’s trade to work, the harder it becomes to execute it neutrally.
🪞 The Market Exposes the Operator
One loss should not change who you think you are.
A losing trade does not make you a failure. A winning trade does not make you a genius. Both are single events inside a much larger sample.
But when your self-worth is attached to the account, every loss feels personal. That is when traders revenge trade, move stops, close winners early or size up to prove something.
You are not the last trade.
The useful question is not:
“What does this result say about me?”
It is:
“Did I execute my edge correctly?”
That question gives you something you can actually improve.
🛠️ Replace Motivation With Structure
You do not need to feel perfect before every session. You need an operating system that protects you when you do not.
✅ Before the session
- Check sleep, stress, focus and emotional pressure
- Trade one defined window
- Know the maximum number of attempts
- Read your recent mistakes before opening the chart
✅ Before the trade
- Is this the written setup or an emotional urge?
- Did manipulation happen?
- Is confirmation complete?
- Is the risk fixed and acceptable?
- Would I take this trade if my previous trade had never happened?
✅ After the trade
- Screenshot the setup
- Record whether every rule was followed
- Write down boredom, FOMO, hesitation or revenge
- Stop when the daily limit is reached
✅ Every Saturday
Review when the market is closed and the emotion is gone.
Do not only study P&L. Study behavior:
- Where did I negotiate with the plan?
- Which loss triggered urgency?
- Which valid setup did I hesitate on?
- Which bad trade began with “close enough”?
- What one rule will prevent the same mistake next week?
This is how psychology becomes practical. Not through another motivational quote, but through evidence, repetition and guardrails.
📍 THE BOTTOM LINE
You probably do not need more trading psychology advice.
You need to practise one model until it becomes familiar. You need rules that remove decisions under pressure. You need to journal the urge before it becomes an expensive click. And you need to review your behavior when you are calm enough to tell yourself the truth.
The goal is not to become emotionless.
The goal is to stop letting temporary emotion rewrite a permanent plan.
❌ None of this guarantees profits or a payout. Trading always involves risk. Structure simply gives your edge a fair chance to show up over time.
Adapt useful, Reject useless and add what is specifically yours.
David Perk
🚀Boost | 🔁 Share | 💬 Comment | ✅Follow for more Education
Bitcoin Retests Supply After Sharp SelloffBitcoin Retests Fresh Supply Following An Aggressive Selloff
Bitcoin experienced a sharp impulsive decline after failing to hold its previous consolidation, allowing sellers to take complete control of the short-term trend. Following the selloff, buyers managed to generate a corrective recovery that has now carried price back into a fresh intraday supply zone, which represents the origin of the latest bearish expansion.
The recovery reflects short-term buying interest, but the market remains below the area where heavy selling previously entered. Unless buyers can absorb the remaining supply and reclaim this resistance, the current rally is likely to remain corrective within the broader bearish structure.
The highlighted supply zone now becomes the most important level to monitor, as the next reaction here will likely determine whether Bitcoin resumes its decline or develops a stronger bullish recovery.
Speculative Outlook
If sellers successfully defend the highlighted supply zone and bearish confirmation develops through rejection candles or lower highs, Bitcoin could resume its downward movement and retest the recent swing lows, reinforcing the current bearish momentum.
However, if buyers absorb the available supply and produce sustained bullish closes above the highlighted resistance, the recovery could extend toward higher liquidity levels, signaling that short-term market sentiment is beginning to shift in favour of the bulls. Confirmation through price action and volume will remain essential before anticipating a sustained directional move.
Distance Matters More Than DirectionMost traders spend far more time deciding where they think the market is going than considering how far the market has already travelled.
This is one of the reasons good analysis often produces disappointing execution.
Direction is only one part of the equation. Distance is equally important because every trend eventually reaches a point where additional progress becomes increasingly difficult. A market that has already travelled a considerable distance without meaningful retracement behaves very differently from one that has only recently begun expanding, even if both are moving in exactly the same direction.
This concept becomes particularly important during strong trends.
After weeks of higher highs, buying still feels logical because the trend remains intact. Yet each additional impulse pushes price further away from areas where efficient positioning exists. Traders continue focusing on direction while ignoring how much of the move has already occurred.
The market begins demanding more effort for smaller reward.
Pullbacks become emotionally difficult because they appear larger than before. Breakouts lose momentum more quickly. Volatility increases without producing meaningful progress. None of these changes necessarily end the trend immediately, but they often signal that the reward available to new participants is gradually shrinking.
Markets rarely move forever without resetting expectations.
Eventually, price either retraces to rebuild participation or transitions into a period of consolidation where buyers and sellers establish a new area of value. Both outcomes serve the same purpose. They reduce the distance between current price and efficient opportunity.
This is why experienced traders constantly evaluate location within the broader move instead of looking only at the current trend.
Being correct about direction means very little if the majority of that direction has already happened.
Sometimes the better trade is not finding the next trend.
It is waiting for the market to shorten the distance back to opportunity.
BTC: Bullish Breakout Confirmed Market Context
The asset has been trading within a well-defined descending channel, characterized by lower highs and lower lows. After a sharp sell-off toward the lower boundary, price action tested a key Strong Support demand zone ($62,346 – $62,907). A bullish reaction at this level suggests that selling pressure is weakening, allowing buyers to step in near the channel bottom.
Technical Reasoning
Support Confirmation: Price swept past liquidity inside the $62,346 – $62,907 support area and triggered a strong buy response, confirming demand at structural support.
Breakout Setup: The trade thesis relies on a bullish Break of Structure (BOS) above the immediate Minor Resistance ($63,213 – $63,389).
Target Levels: A confirmed breakout above this minor resistance shifts short-term momentum upward, opening a pathway toward the descending channel's upper boundary near Minor Resistance ($64,488), with a secondary macro expansion target in the Strong Resistance zone ($66,800 – $66,947).
Bullish & Bearish Scenarios
Bullish Scenario: A clean hourly closure above $63,213 validates entry, driving price toward $64,488. Holding above $64,488 enables a continuation leg toward the primary target at $66,800–$66,947.
Bearish Scenario: Failure to reclaim $63,213 followed by a breakdown beneath the demand zone indicates pattern continuation within the broad descending channel.
Invalidation
The long setup is invalidated if price breaks below the Strong Support lower boundary at $62,346, as this would signal structural continuation to the downside.
Risk Management Note
When price reaches the intermediate target at $64,488, it is prudent to take partial profits and adjust the stop loss to breakeven (B/E) to mitigate downside risk ahead of the descending channel resistance line.
Educational Takeaway: Trading reversals at channel boundaries requires waiting for structural confirmation (such as a minor resistance break) rather than catching a falling price, ensuring risk is clearly defined against structural levels.
B T C : ($63 043 Buy Limit)For today's Trade on (Bitcoin) we will be looking to have a (Buy Stop Trade) at the price of ($63 043) as we can see that for the past few days the (Bears) have managed to push (Price) to the (Downside) from the (High Price) of ($65 044) all the way down to ($63 043) so this will be a good time to wait patiently for the price to return to the (Downside) and then we shall (Capitalize) and ride the (Potential UpTrend)
The way we will (Capitalize) on this trade is by waiting for some (Bullish Momentum) to show and then we add some more (Buy Confirmations) before taking the (Trade) as we are looking to enter at a (Good Price) by (Buying) the (Dip) and riding the (Bullish Momentum) and (Bullish Wave) to the (Upside)
The price of the (Buy Limit) will be at ($63 043) and we have a (Take Profit) of ($64 401) with the (Stop Loss) being ($62 082) and any opportunity that presents itself to close (Partial Profits) it will be used to (Secure Profits) as are still (Scalping) together with the (Long Term Direction) in mind and it is recommended to (Adjust) the (Stop Loss) to (Entry) whenever there's a good chance to help (Protect) the (Pips/Points)
(Bitcoin) looks cautiously bullish but still fragile ,(BTC) is trading around the ($63,000–$65,000) area, and the market appears to be waiting for the U.S. Federal Reserve’s decision and guidance. (Bitcoin) has recovered from its late-(June weakness), but it is still dealing with important (Resistance) and hasn’t fully confirmed a (Strong Uptrend) yet.
⬇️ Previous Trades Below ⬇️
BITCOIN Final Bearish Leg to $50000 is starting..Bitcoin (BTCUSD) is close to the next, and quite possibly final, Bearish Leg of the current Bear Cycle. The previous three were all confirmed by a break below their respective Higher Lows trend-line. The January 2026 High got rejected when it reached its 0.382 Fibonacci retracement level on the 1D MA100 (green trend-line), while the May 2026 High got rejected just after reaching its 0.618 Fib on its 1D MA200 (orange trend-line).
With the current Leg already reaching its 0.382 Fib from the previous High and its 1D MA100 marginally above, it will either make one last spike upwards limited to $70000 max or will confirm the new downtrend by breaking below its Higher Lows trend-line.
Either way, it appears that a $50000 would be a conservative target as not only would it make contact with the 1W MA350 (red trend-line), which is where the 2022 Bear Cycle bottomed, but would almost be a -25% decline, smaller than the previous one, just like that Leg was compered to the January one.
Are you also expecting such a Bearish Leg to take place next and hit at least $50000 or not? Feel free to let us know in the comments section below!
---
** Please LIKE 👍, FOLLOW ✅, SHARE 🙌 and COMMENT ✍ if you enjoy this idea! Also share your ideas and charts in the comments section below! This is best way to keep it relevant, support us, keep the content here free and allow the idea to reach as many people as possible. **
---
💸💸💸💸💸💸
👇 👇 👇 👇 👇 👇
Bitcoin Bullish Scenario | 62K Support to 70.8K Liquidity TargetThis BTC/USD 4H chart presents a professional price action and market structure analysis, highlighting the current bullish formation through an ascending channel pattern, key support and resistance levels, and potential liquidity targets.
Bitcoin has formed a clear sequence of higher lows, showing buyers are defending lower price areas and maintaining bullish momentum. The ascending channel structure indicates that price is respecting dynamic support and resistance, with the lower trendline acting as a strong buying area and the upper trendline representing a potential rejection zone.
The chart highlights the important 62,173 support level, which acts as a key structural area. A successful hold above this zone can maintain bullish continuation, while a breakdown below support may signal weakness and a possible deeper retracement toward demand areas.
The 67,191 resistance level represents a major obstacle where sellers may react. A confirmed breakout above this level could open the path toward the 70,879 strong high / liquidity target zone, where previous highs and resting liquidity are located.
Market structure analysis:
Ascending Channel: Shows bullish trend continuation with higher highs and higher lows.
Channel Support: Dynamic support where buyers may defend price.
Channel Resistance: Area where profit-taking and selling pressure may appear.
62K Support: Key demand and retest zone.
67K Resistance: Breakout confirmation level.
70.8K Target: Major liquidity area and potential expansion zone.
The projected move represents a possible bullish continuation scenario, but confirmation through price action and volume is required. This analysis is created for educational purposes to understand trend structure, support/resistance, liquidity zones, and breakout setups using professional trading concepts.
BTCUSD: Massive Bear Flag, Huge Bearish Wave Setup!Hello There,
welcome to my new analysis about BTCUSD on the 4-hour timeframe perspective. BTCUSD is still in a highly crucial phase, which could lead to the bearish situation to accelerate in the upcoming times. In this current dynamic, I have spotted pivotal signs that are highly important to consider. Especially if further bearish pressure unfolds, this could lead to a trade on the short side to profit from falling prices.
As when looking at my chart, we can watch there how BTCUSD is trading within this bearish descending channel development. It has a massive bearish resistance within the descending trendline from where it already pulled to the downside and accelerated heavy bearish pressure. Right now, it is approaching this line again and is likely to set up the next bearish wave from this point of view.
The crucial phase of this whole formation will come when BTCUSD bounces below the lower boundary of the formation and forms this bearish setup seen in my chart. Once this has been completed, BTCUSD is going to activate the bear flag target zone as marked in my chart. If bearish volume should increase, this is going to accelerate the bearish dynamic.
In this manner, thank you a lot for watching!
The support is highly appreciated.
VP
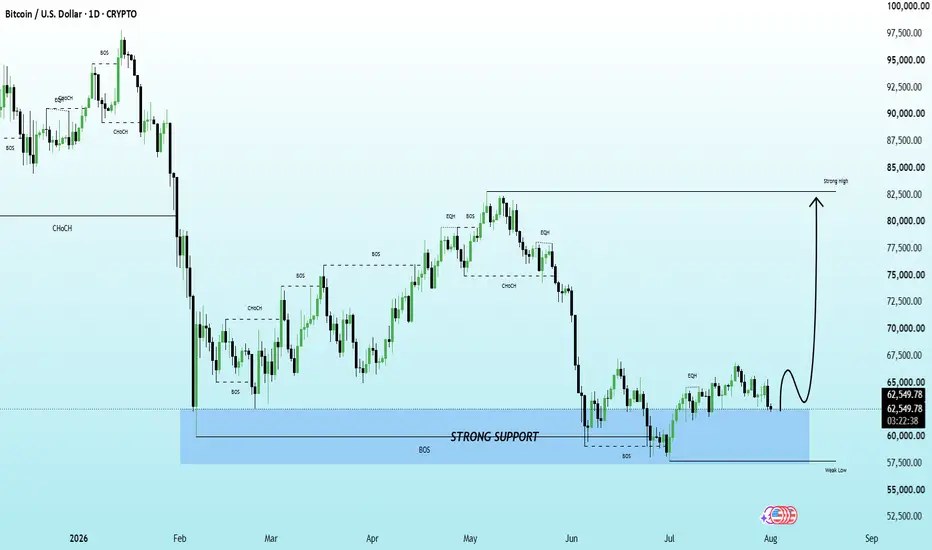
BTCUSD | Strong Support Holding – Bullish ScenarioBitcoin is currently trading above a major support zone after sweeping liquidity and showing signs of stabilization. As long as this support remains intact, the bullish outlook stays valid.
A successful hold above the highlighted demand area could lead to a strong recovery toward the higher liquidity and previous swing highs. I’ll wait for confirmation before looking for long opportunities.
Key Levels:
🔹 Strong Support: 57,500–62,000
🔹 Bullish Target: 82,000+
🔹 Bias: Bullish 📈
⚠️ This analysis is for educational purposes only and not financial advice. Always wait for confirmation and use proper risk management.
Bitcoin’s Yield Curve Is Flashing a Warning | 2 Incomplete CycleFirst, I want to briefly explain what I mean by the Bitcoin yield curve.
In any market, the yield curve can be viewed as a representation of demand and the market's ability to sustain continued growth.
I will try to avoid a long explanation and keep it simple.
Look at gold and the S&P 500. Over all these years, their prices have continued to move along a curve and follow a consistent market structure.
Look at gold. It has experienced healthy cycles, regular corrections, and sustainable new highs. This structure demonstrates strong demand, even after decades of market activity.
But crypto has shown two inefficient cycles, with two incomplete tops and weakening candle structures: one in 2021 and another in 2025.
In 2021, Bitcoin should have reached $100,000, but the market failed to touch that level. In 2025, we were unable to reach $200,000 and enter the true euphoric phase or the top of the cycle.
The biggest problem is that, despite the arrival of countless companies, institutions, and major Bitcoin ETFs, and despite massive amounts of capital flowing into the market, Bitcoin still ended up trapped in a defective cycle.
Another important issue is that almost all of the capital was concentrated in Bitcoin rather than flowing into altcoins.
But there is an even bigger problem: the value of money changes from cycle to cycle.
For example, the $126,000 cycle top in 2025 had the purchasing power of only around $98,000 in 2020 — a difference of $28,000 in real value.
You can see this across all the cycles. Even after accounting for inflation, Bitcoin has still failed to perform as a truly inflation-resistant asset.
I could continue explaining my reasoning for days, but there is an even bigger issue.
If governments do not enter the Bitcoin market during this cycle and help pull us out of this defective cycle structure, it may eventually be too late for Bitcoin.
And perhaps reaching a new all-time high could become nothing more than a false hope.
If you do not understand what I am talking about, send this image and text to an AI. It will certainly be able to help you understand exactly what I mean.
This is not financial advice.
Sincerely,
Amir Ghasemi
The Cost of Changing Your Chart Too OftenEvery trader eventually reaches a point where confidence in their analysis begins to fade. A few losing trades occur, market conditions become more difficult, and suddenly the chart that felt perfectly adequate a week ago no longer seems good enough.
The natural response is to start changing things.
A moving average is removed. A new indicator is added. Support and resistance are drawn differently. Timeframes change. Before long, the chart no longer resembles the one that produced the trader's best results.
The problem isn't experimentation. Every trading approach should evolve over time. The problem is making structural changes before enough evidence exists to justify them.
Financial markets produce random outcomes even when a strategy has a genuine edge. Five losing trades do not necessarily mean something is broken. They may simply represent a perfectly normal distribution of results.
When traders change their analytical framework too quickly, they create a different problem. Instead of testing one approach thoroughly, they begin testing dozens of incomplete approaches. None of them survive long enough to reveal whether they actually work.
This creates an endless cycle.
Every new chart feels promising because it hasn't experienced failure yet. Once losses appear, confidence disappears and another round of changes begins. Eventually, the trader stops building experience with markets and starts building experience with chart customization.
Consistency requires stability.
A framework should only change when the trader has collected enough information to identify a genuine weakness, not because recent results created emotional discomfort. That distinction is difficult because emotions respond immediately while useful data requires time.
Professional traders often use remarkably similar charts for years.
Not because they believe their tools are perfect, but because they understand that consistent observation creates better judgment than constantly searching for a better-looking chart.
Sometimes the fastest way to improve your analysis is to stop changing it.
The Best Technical Analysis Removes InformationMany traders begin their trading journey believing that better analysis comes from gathering more information. New indicators are added, additional confirmations are introduced, and every chart slowly becomes more complicated than the last.
The assumption feels logical.
If one tool provides useful information, then five tools should provide even better information. Over time, however, the opposite often happens. Every additional variable creates another opinion, another confirmation to wait for, and another opportunity for conflicting signals to appear.
Instead of increasing clarity, complexity begins reducing it.
The strongest technical analysis usually works in reverse.
Rather than asking what can be added to the chart, experienced traders ask what can be removed without changing the quality of the decision. This process forces attention back toward the variables that actually influence execution.
Price structure.
Liquidity.
Participation.
Context.
These elements existed before indicators were created, and they continue existing regardless of which tools traders choose to use. Indicators can certainly provide useful supporting information, but they rarely replace the need to understand how the market itself is behaving.
There is another advantage to simplification.
Cleaner analysis creates greater consistency. When the same framework is applied every day, decisions become easier to compare over time. Mistakes become easier to identify because they are no longer hidden beneath dozens of conflicting variables.
The objective is not having the most sophisticated chart.
The objective is building a framework that consistently highlights the information that actually changes decision-making.
A useful question to ask after every trading session is simple.
If one element disappeared from the chart tomorrow, would the quality of my decisions change?
If the answer is no, it probably never deserved a place there in the first place.
Good technical analysis is rarely about seeing more.
It is about removing everything that prevents you from seeing what already matters.
BTCUSD | Institutional Supply in ControlBTC is trading beneath a key institutional supply zone while maintaining a bearish higher-timeframe market structure. A rejection from premium pricing may drive price toward internal demand and external sell-side liquidity. Traders should wait for confirmed market structure and liquidity validation before considering trade execution
Why a Losing Month Is Not a Broken StrategyThe month ends. You open your journal, or your exchange, or whatever place you keep the truth, and the number at the bottom is red. Not catastrophically red. Just red.
And within about four seconds, a thought arrives that has ended more trading careers than any single bad trade ever has: Something is wrong with my strategy.
You start scrolling. You start comparing. You start looking at other people posting green months and wondering what they know that you do not. By the end of the week you are testing something new, and the thing you spent eight months learning is sitting in a folder you will never open again.
🔵 A Month Is Not a Sample. It Is a Snapshot.
Here is the uncomfortable arithmetic. Depending on how you trade, a month might contain ten trades. Maybe twenty. Maybe six. That is not enough information to judge anything. It is barely enough to judge a coin flip.
If you flip a fair coin twenty times, you will sometimes get thirteen tails. Nobody looks at that and concludes the coin is broken. Everyone understands intuitively that twenty flips is simply too few to reveal what the coin actually is.
But when the same thing happens to your equity curve, the intuition vanishes. You do not think "small sample". You think "failure".
Across our own live record we have taken 798 trades at a 59.5 percent win rate. That means 323 of those trades closed as losses. Three hundred and twenty three. Inside a record that works.
Those losses did not happen despite the strategy. They happened because the strategy was being used. Now consider how those 323 losses are distributed. They are not spread out politely, one after every winner. They arrive in clusters. Some of those clusters are large enough to eat an entire month.
That is not malfunction. That is what a 59.5 percent win rate physically looks like when you live inside it instead of reading it as a summary.
🔵 Losses Do Not Arrive in Order
This is the part that breaks people, and it is worth sitting with. A win rate is a long-run average. It tells you nothing about sequence. A strategy that wins six times out of ten will still hand you five losers in a row, and it will do it more often than you expect.
The market does not owe you an even distribution. It does not shuffle your outcomes into a comfortable pattern so your monthly review looks tidy. It delivers them in whatever order it feels like, and sometimes the order is brutal.
You already accept this in other domains. A striker who scores in one match out of three is excellent, and nobody panics when he goes four games without scoring. Everyone understands the average will reassert itself.
In trading, the panic arrives anyway, because it is your money and the calendar has a hard edge on the thirty-first.
🔵 What a Broken Strategy Actually Looks Like
We are not saying strategies never break. They do. But they break differently than you imagine. A broken strategy does not produce one red month inside a rising curve. It produces a win rate that trends downward across many months. The edge does not vanish overnight; it erodes. The setups that used to resolve cleanly start failing more often, and the failure rate keeps climbing quarter after quarter.
That is a slope. It shows up over a long horizon and it is visible in the win rate itself, not in the profit and loss of a single month.
A healthy strategy in a bad month looks completely different. The win rate is stable across the long record. One month dips below the average. The next several return to it. The curve keeps making higher lows. One of those is a signal to stop. The other is a signal to keep going.
The tragedy is that traders quit the second one constantly, because on a single month's view, the two are indistinguishable.
🔵 You Cannot Diagnose Anything Without a Record
Here is why most traders cannot tell the difference between the two situations above.
They have no record. They have a vague memory of the last few weeks, a strong emotional impression of the most recent loss, and a feeling. Feelings are terrible at statistics. A feeling will tell you that you have been losing constantly when your actual numbers say you are slightly above breakeven.
Without a long, honest log of your own trades, every losing month feels like evidence of collapse, because you have nothing to measure it against. You are judging the coin without ever having counted the flips.
The trader who knows their own numbers can survive a red month. The trader who does not, cannot. This is not a complicated fix. It just requires that you write things down before you have an opinion about them.
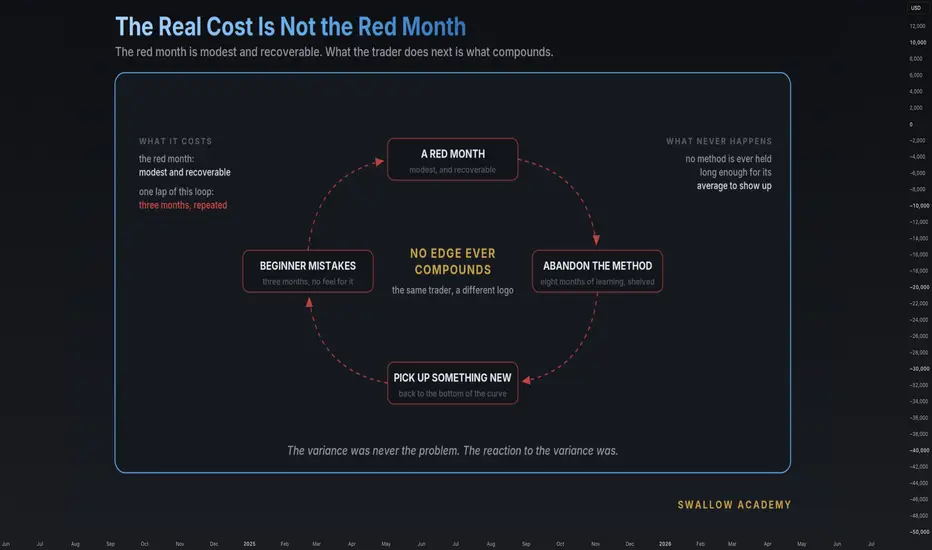
🔵 The Real Cost Is Not the Red Month
Here is what actually damages accounts. The red month costs you a modest, recoverable amount. What follows it costs far more.
You abandon a strategy you had genuinely started to understand. You pick up something new. You spend the next three months at the bottom of a fresh learning curve, making beginner mistakes with a method you have no feel for. Then that method has a bad month, because every method has bad months, and you abandon that one too.
This is the cycle. Not one bad strategy after another, but the same trader repeatedly discarding functional edges at exactly the moment when the numbers were about to normalise. The variance was never the problem. The reaction to the variance was.
🔵 Final Take
A losing month is a data point. It is not a verdict. Your job at the end of a red month is not to rebuild everything. It is to ask one narrow question: has my win rate actually declined across a meaningful number of trades, or did I simply have a normal cluster of losses land inside an arbitrary thirty-day window?
Almost always, it is the second one. And almost always, the trader who stays with a working method through that month is the one still trading a year later. The strategy did not break. The calendar just ended at an inconvenient place.
Losses are not proof that something failed. They are proof that you showed up and did the work under real conditions, where being wrong is part of the cost of being right often enough. Keep the record. Read the slope, not the snapshot.
Swallow Academy
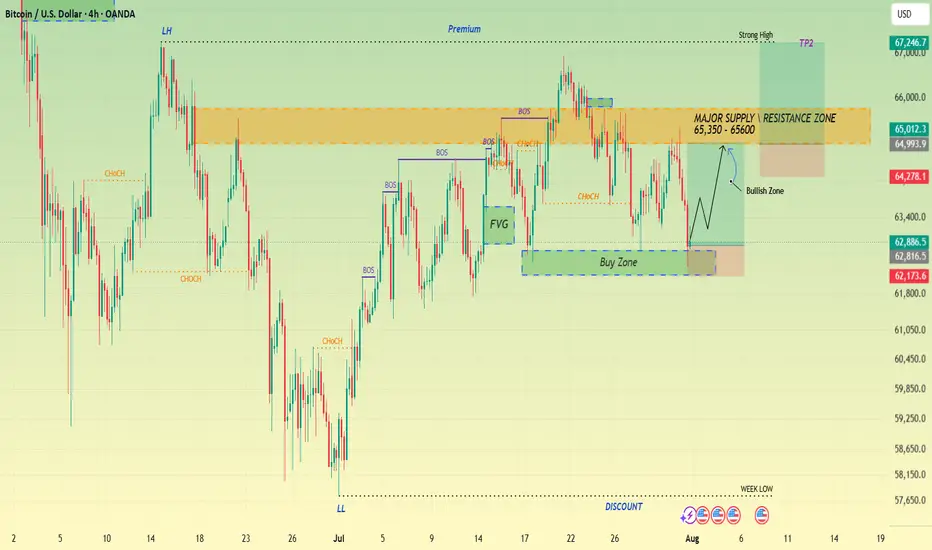
Bitcoin Bounces From Discount Zone, Eyes TP2 Near 67,247The 4H BTCUSD chart shows Bitcoin working through a clear Premium/Discount range structure, a core concept in Smart Money Concepts trading. Price recently swept the Week Low, forming a Lower Low (LL) deep in the Discount zone, before reversing sharply through a series of confirmed BOS (Break of Structure) and CHoCH (Change of Character) signals — a textbook accumulation-to-markup sequence.
This recovery carried price all the way back up to test the Major Supply/Resistance Zone (65,350–65,600), where it printed a Lower High (LH), signaling sellers were still active at this premium level. Following this rejection, price pulled back into the Buy Zone, an area between roughly 62,175 and 62,817 that aligns with prior demand and a fresh Fair Value Gap (FVG) left behind during the impulsive move up.
Currently trading at 62,886.5, up 0.15% on the session, Bitcoin is showing a clean reaction from this Buy Zone, now labeled the Bullish Zone on the chart — suggesting smart money may be stepping back in for another leg toward the highs.
The projected path outlines a stepped continuation, first working back toward the Major Supply Zone before attempting a breakout, with TP2 marking a target near 67,246.7 — fresh territory beyond the recent Strong High.
From a risk management perspective, the key invalidation level is a decisive break below the Buy Zone (under 62,175). Such a move would suggest the discount reaction has failed and could open the door for a retest of the Week Low.
For now, structure favors a bullish recovery from this demand zone, with traders watching for confirmation before targeting the supply zone breakout and TP2.
Do you think Bitcoin will break through the Major Supply Zone this time and reach TP2, or will we see another rejection at the highs?
BTCUSD | 1H Technical OutlookBTCUSD | 1H Technical Outlook
Based on the chart structure, Bitcoin remains bearish after rejecting from the previous supply zone and trading below the broken trendline. Price is attempting a short-term bounce, but the overall structure still favors a continuation toward the highlighted demand area unless buyers reclaim nearby resistance.
📉 Bearish Scenario (Preferred)
Current Price: ~63,650
🎯 Target 1: 62,500 – 62,600
Major demand/support zone.
First area where buyers may react.
🎯 Target 2: 61,450 – 61,600
Next liquidity objective below the current demand.
Stronger higher-timeframe support if selling pressure continues.
📈 Bullish Invalidation
If price closes and holds above 63,850 – 64,000, bearish momentum would weaken and a recovery toward 64,600 – 65,000 becomes more likely.
BTCUSD | 1H | Technical Analysis
Bitcoin is trading below a previously broken trendline after a rejection from a higher-timeframe supply area. The current rebound appears corrective while price remains under nearby resistance, keeping the short-term structure tilted to the downside.
The first level to monitor is the demand zone around 62,500, which aligns with prior buying interest and may provide temporary support. A decisive move below this area could expose the next downside objective near 61,450, where another significant support region is located.
On the upside, buyers would need to reclaim and hold above the recent resistance zone to reduce bearish pressure and improve the probability of a broader recovery. Until then, the market continues to favor caution while reacting around key technical levels.
Key Levels
Resistance: 63,850 – 64,000
Support 1: 62,500 – 62,600
Support 2: 61,450 – 61,600
The Illusion of ControlEvery trader wants control.
We analyze charts, draw levels, test strategies, and follow the news—all in the hope of predicting the market's next move. While preparation is essential, it's easy to fall into the illusion that we can control what the market does.
The truth is, we can't.
Markets are driven by millions of participants, institutional flows, economic events, unexpected news, and countless variables that no trader can fully predict. No amount of analysis can eliminate uncertainty.
What we can control is how we respond.
We control the quality of our analysis, the setups we choose, the size of our positions, where we place our stop-loss, how we manage risk, and whether we stick to our trading plan. These decisions shape our long-term results far more than trying to predict every market move.
One of the biggest mistakes traders make is confusing a profitable trade with a good decision. A trade can make money despite poor execution, just as a well-executed trade can end in a loss. Success isn't about controlling outcomes—it's about consistently making high-quality decisions.
Professional traders don't aim to control the market.
They focus on controlling their process.
In this article, we'll explore why the desire for certainty can become a trader's biggest weakness, how to separate what you can control from what you can't, and why accepting uncertainty is one of the most valuable skills in trading.
Because trading isn't about controlling the market.
It's about controlling your decisions while letting the market do what it will.
*BTC/USD Bullish Recovery from Trendline Support – Eyes on $65.5
BTC/USD is showing signs of a bullish recovery after finding support at the ascending trendline and holding above the key consolidation zone. Price recently pulled back from higher levels but continues to respect the long-term uptrend, suggesting buyers remain active. The highlighted resistance zone near **$66.8K–$67.0K** remains the major barrier, while the current rebound points toward a retest of the recent swing highs. A sustained move above the nearby resistance could strengthen bullish momentum and open the door for further upside.
🎯 **Target:** **$65,500** (initial bullish target)
🚀 **Extended Target:** **$66,800–$67,000** (major resistance zone)
B T C : ($63 043 Perfect Profit)Bitcoin had been in a short-term decline, falling from around ($65,044) to ($63,043) the expectation was that this (Decline) was nearing exhaustion and that (Bulls) would step back into the market.
The strategy was to (Buy) the (Dip) rather than chase the price higher
the trade plan was the following
Entry - (Buy Limit) at ($63,043)
Stop Loss - ($62,082)
Take Profit - ($64,401)
Bitcoin retraced into the planned buy zone around ($63,043)
(Bulls) defended that support area, creating (Bullish momentum)
As buying pressure increased, the price reversed upward.
The bullish move continued until it reached the (Take Profit) at ($64,401), where the trade automatically closed in profit.
(Take Profit) was hit because the analysis correctly identified that:
(Sellers) were losing momentum after the decline.
The ($63,043) area acted as a strong support level,(Buyers) entered the market, causing a rebound.
The rebound was strong enough to reach the predefined (Take Profit Level).
Overall, this was a well-executed (Buy) the (Dip) trade as we waited for price to reach support, entered with a defined (Stop loss), and exited at the planned (Profit Target) instead of relying on emotion.
⬇️ Previous Trades Below ⬇️
The Trap of High Leverage: Why More Control Means Less ProfitYou open a position with 50x. The margin required is tiny. The position size on screen is large. For a moment it feels like you have finally found the shortcut — the same profit, from a fraction of the account.
Ten minutes later the price moves 1.4% against you and the trade is gone. Not stopped out. Liquidated.
The direction was right. You were early by twenty minutes. This is the most expensive misunderstanding in retail trading, and it is worth being precise about why it happens.
🔵 Leverage Is Not Power. It Is Collateral Efficiency.
Leverage does not make your trade bigger. Position size makes your trade bigger. Leverage only decides how much of your capital the exchange locks as margin to hold that position. That is the entire function.
Leverage does not increase your profit. It decreases the distance between you and being wrong.
A trader who understands this uses 5x and 50x for the same trade with the same outcome. A trader who does not think 50x is five times better.
🔵 The Control Illusion
Higher leverage feels like precision. Smaller margin, tighter entries, more positions available at once. It feels like you are operating the market with finer instruments.
What is actually shrinking is your tolerance for normal price behaviour.
Bitcoin can move 2% in an hour on nothing at all. No news, no structural change, no invalidation of your idea. At 50x, that ordinary noise is a total loss. You have not been beaten by the market. You have been removed from it before it had a chance to resolve.
🔵 The Part That Surprises People: Same Risk, Different Survival
Here is where most traders discover they had the relationship backwards.
Both traders wanted to risk $100. Trader A chose the position size from the stop distance and used only as much leverage as the exchange required. Trader B chose the leverage first and let the position size follow.
Trader A loses $100 when wrong. Trader B loses $500 when the market breathes. A stop loss is a decision you make. A liquidation is a decision the exchange makes for you. That is the whole difference between trading and gambling, and leverage is where the line gets crossed.
🔵 The Cost You Do Not See on the Chart
There is a second drain, and it is quieter. Trading fees and funding are charged on the size of your position, not on the margin you posted. Ten times the leverage means ten times the fees and ten times the funding on the same amount of your own money.
You are paying a premium for the privilege of being liquidated faster. This is also why the fee structure of the exchange you use stops being a detail and starts being part of your edge.
🔵 What It Does to Your Head
The mechanical damage is measurable. The psychological damage is worse.
High leverage forces you to be right immediately. There is no room for the trade to develop, so you stop analysing and start monitoring. You watch the position instead of the market. You move your stop to give it air, then move it again. You take a 0.3% profit because the unrealised number felt like real money.
High leverage does not turn a bad trader into a good one. It turns a thinking trader into a reacting one.
Every good habit you have — patience, planning, letting a thesis play out — requires time. High leverage is the removal of time.
🔵 How Professionals Actually Use It
They do not choose leverage. They calculate size.
The sequence is always the same: find the setup, place the invalidation level where the idea is genuinely wrong, decide what that loss is worth in dollars, and let those two numbers produce the position size. Leverage is then whatever number the exchange needs to hold that position. Often it is low. Sometimes it is higher on a tight-stop scalp. It is never the starting point.
That is the tell. Amateurs ask how much leverage should I use. Professionals ask where is my stop, and what is that worth.
🔵 Final Take
Leverage is not the enemy. It is a legitimate tool for using capital efficiently, and used properly it is close to invisible in your results
The trap is the feeling. More leverage feels like more control, more speed, more seriousness. What it actually buys is less room, higher costs, and a shorter fuse on your own patience.
Set your stop first. Let the stop set your size. Let the exchange worry about the margin. Be wrong on purpose, in small amounts, for a long time. That is the whole job.
Swallow Academy
Bitcoin Distribution AheadBitcoin has already swept daily buy-side liquidity and is now trading beneath a major Daily Fair Value Gap. Unless buyers reclaim this premium zone with conviction, the current structure favors a distribution phase before any meaningful continuation higher.
Liquidity has been taken. Now watch where price gets rejected.
Market Structure
• Daily buy-side liquidity has already been raided.
• Price is trading into a premium Daily FVG.
• Higher-timeframe draw shifts toward sell-side liquidity if rejection confirms.
• Expect increased volatility around these levels.
Bearish Scenario
🔴 Rejection from the Daily FVG.
🔴 Market rotates toward internal sell-side liquidity.
🎯 TP1: First Daily Sell-Side Liquidity.
🎯 TP2: Major Daily Sell-Side Liquidity.
🎯 Final Target: Ultimate Discount Objective (DOL).
Execution Plan
✅ Wait for bearish confirmation inside the Daily FVG.
✅ Avoid chasing price after the initial move.
🛑 Invalidation above the Daily FVG.
🎯 Scale profits at each liquidity objective.
Not financial advice. Trade your own plan.