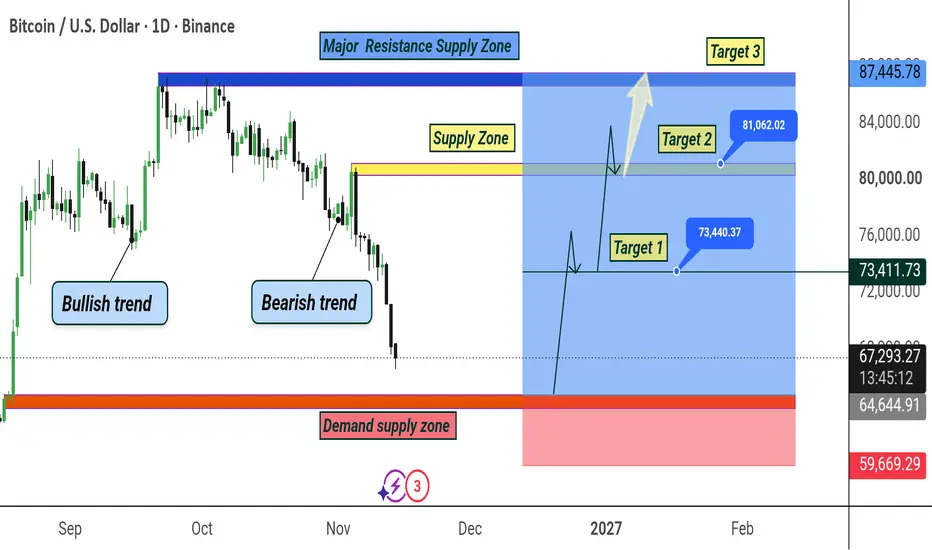
BTCUSD | The Liquidity Sweep Before a Potential RecoveryDaily Market Outlook | Key Levels & Price Action Analysis
Market Bias: Conditional Bullish Recovery
Current Price: 64,352
Timeframe: Daily (1D)
1. Market Overview
Bitcoin is currently experiencing significant bearish pressure after rejecting the upper liquidity zone around 86,515.
The market has broken below its previous support structure, turning the 75,000–76,200 region into an important resistance area.
However, the current price action is approaching a historically important demand and
In-depth trading ideas
btcusd | weekly demand zone potential bullish reversal & upsideBTCUSD WEEKLY ANALYSIS | WHY SELLING STARTED NEAR 75K & WHY 58K COULD TRIGGER A BUYING REACTION
Bitcoin's weekly chart is showing a significant bearish correction after failing to maintain its bullish structure near the higher resistance levels. Price is currently trading around 65,395, while the major weekly demand zone is located near 58,899.
Let's break down the market structure and understand why sellers gained control and why the 58K region could become an important buying opportunity.
1
BTCUSD Daily Analysis Liquidity Sweep Potential Bullish ReversalBTCUSD Daily Analysis – Liquidity Sweep, Bearish Structure and Potential Recovery
Bitcoin is currently trading around 64,786 on the daily timeframe. The chart shows a clear shift from bullish momentum into a bearish market structure. However, price is now approaching an important demand and liquidity area that could become a decision point for the next major move.
Let’s break down the important candle formations and what they may indicate.
1. Initial accumulation and bullish expansion
The fi
What the Perpetual Futures Premium RevealsBitcoin can trade at slightly different prices in the spot and perpetual futures markets, even when both instruments reference the same underlying asset. These differences are usually small, but their direction and persistence can provide useful information about demand for leveraged exposure.
The distinction begins with how the instruments work.
Spot Bitcoin represents the underlying asset, while a perpetual futures contract allows traders to gain price exposure without owning Bitcoin directly
BITCOIN: Pullback While Major Triangle-Fractal is Still Intact!Hello Community,
welcome to my new analysis of BITCOIN from a monthly timeframe perspective. While the whole crypto market dumped to the downside in recent times, the cycle I mentioned previously hasn't been invalidated yet. A lot of liquidations happened within the market, with BITCOIN massively declining to the downside; however, there is still the possibility for BITCOIN to recover again and start a new cycle.
When looking at my chart we can watch there how BITCOIN several times formed thi
BITCOIN Sooo.. The entire August-Sept rally is gone. Surprised?Bitcoin (BTCUSD) closed last week below its 1W MA200 (orange trend-line), effectively losing all the gains of the entire August - September rally. A move that was largely fabricated on lower than standard volume and no concrete news (as we've been pointing out for months), is now completely gone. Closing a 1W candle below the 1W MA200 again is just the icing on the cake.
The only Support level that currently stands in the way of lower prices is the Higher Low trend-line that is coming straight
Liquidation Heatmaps Are Not Guaranteed TargetsLiquidation heatmaps have become popular among crypto traders because they provide a visual estimate of where leveraged positions could face liquidation. Large concentrations above or below the current price often attract attention, especially when traders expect Bitcoin to move toward areas containing substantial potential liquidations.
The information can be useful, but heatmaps are frequently interpreted with more certainty than the underlying data supports.
Most liquidation heatmaps are est
Don't Chase Shorts Into Macro SupportDon't Chase Shorts Into Macro Support: BTC Nears 64–65K Pattern Target, Is a Liquidity Rebound to 74K Next?
Traders rushing to chase short positions as Bitcoin slides aggressively from its 87,000 USD peak down to 68,299 USD need to exercise extreme caution near the approaching demand floor! Examining the 1D chart objectively, the initial breakdown impulse from the Head and Shoulders formation is nearing its measured exhaustion zone.
Let's dissect the technical tape:
A textbook Head and Should
BTCUSD H4 | SSL Sweep & Bullish Reversal?BTCUSD H4 – Liquidity Sweep, D1 Demand Reaction & Potential Bullish Recovery
📊 MARKET STRUCTURE: UNDERSTANDING THE RECENT DECLINE
Bitcoin has experienced a significant bearish move, declining from the 80K+ region toward the major Daily Demand Zone.
This decline was not simply random selling pressure. The H4 chart shows a sequence of bearish Breaks of Structure (BOS), indicating that sellers maintained control over the market structure.
But the most interesting development is happening around
MACD (26,12) + BOLLINGER BANDS – EXPLOSIVE MOMENTUM & VOLATILITYDiscover a more structured approach to technical market analysis with the powerful combination of MACD (26,12) and Bollinger Bands. This strategy brings together momentum analysis, volatility behavior, trend development, and potential breakout identification to help traders better understand changing market conditions.
Financial markets continuously move through different phases, including consolidation, accumulation, volatility contraction, and strong directional expansion. Recognizing these p
How to Identify Liquidity Sweeps Using Buyer & Seller PowerUnderstanding Liquidity Sweeps & Buyer/Seller Power | Smart Money Trading Concept
Financial markets often move toward important liquidity levels before showing a potential reversal or continuation. Understanding these movements can help traders make better decisions and avoid entering trades too early.
In this educational chart, I am explaining the combination of two important trading concepts: Liquidity Sweep Detection and Buyer/Seller Power Analysis.
The purpose of this approach is to under
BITCOIN hit its 1W MA200 again! They said it would never happen!A month ago (see charts below), we signaled a medium-term correction Bitcoin (BTCUSD) after it broke below its 1D MA50, giving a 1W MA200 Target around $68000:
At the time our view was met with huge skepticism, denial and mockery, but 7 weeks later BTC reached our Target. The reason that enabled us to predict this was because the market has been following very closely the late 2022 - early 2023 Cycle bottoming process, which has been an Inverse Head and Shoulders (IH&S) pattern that mad
The Hidden Risk of Low-Float AltcoinsA cryptocurrency can have a multibillion-dollar valuation while only a relatively small percentage of its total token supply is available for trading. This structure is particularly common among newer altcoins, where large allocations remain locked for investors, teams, foundations, or future ecosystem incentives.
The distinction between circulating supply and total supply matters because it can significantly influence how a token behaves after launch.
Imagine a new cryptocurrency with one bill
Token Unlocks Do Not Always Cause SellingToken unlocks are frequently discussed as bearish events because they increase the amount of cryptocurrency that can potentially enter circulation. When a large allocation becomes available to investors, team members, or early contributors, traders naturally become concerned that the additional supply will create selling pressure.
The concern is reasonable, but the actual impact depends on much more than the number of tokens being unlocked.
Consider a cryptocurrency with a circulating supply of
BTCUSD Weekly Analysis Key Support Resistance & Next Market Move BTCUSD WEEKLY ANALYSIS – WHY BITCOIN DROPPED FROM $75K TO $67K & WHY A RECOVERY COULD COME NEXT
BITCOIN (BTCUSD) – WEEKLY TIMEFRAME
CURRENT MARKET STRUCTURE: BEARISH CORRECTION
Bitcoin has experienced significant selling pressure, falling from the $75,000 region towards $67,000. The important question is whether this decline is just a temporary correction or the beginning of another major bearish leg
Our analysis covers the technical reasons behind the decline, global economic pressure, i
BTCUSD – Bearish Market StructureCRYPTO:BTCUSD
Bitcoin (BTCUSD) continues to demonstrate a strong bearish market structure on the 30-minute timeframe, with sellers maintaining control following a significant decline from the 75,000 resistance region.
The market has established a consistent sequence of lower highs and lower lows, reflecting sustained selling pressure and weakening bullish momentum.
Despite the recent recovery from the 61,947 liquidity low, the overall structure remains bearish. The current price action suggest
bitcoin’s comeback starts at $66K?BTCUSD is trading around $67,088 on the 4H timeframe after an aggressive bearish move from the $85,000 region. Price has entered a major demand/support zone around $65,500–$66,500, where a potential recovery could develop.
The broader market structure remains bearish, with price trading below the Ichimoku cloud and previous support levels turning into resistance. However, the current support zone could provide an opportunity for buyers to regain control if sufficient demand emerges.
Key bullis
BTCUSD: Sell-Side Liquidity Sweep and Reversal Setup (4H)Bitcoin has been trading inside a descending channel on the 4H, printing lower highs and lower lows with multiple BOS along the way. Price has now dropped into the weak low and sell-side liquidity near 72,600, a classic area where stops get swept before a potential reversal.
Trade idea: Long
Buy area: 72,600 down to 72,000
Invalidation: a 4H close below 71,898
Target: 76,091
Why this level matters
Price tapped the channel's lower boundary and the sell-side liquidity pool.
The sweep of the weak l
Btc Market Structure:
BTCUSD has been moving through a clear transition from a previous bullish trend into a bearish corrective phase. After reaching the major resistance area around 87,000–88,000, price began forming lower highs and lower lows, confirming increasing bearish pressure.
Major Resistance / Supply Zone:
The main resistance and supply area is located around 80,000–82,000. This zone previously acted as a strong rejection area and is an important level to watch if Bitcoin begins a recovery
B T C : ($72 800 Buy Limit)BTCUSD – Bullish Market Outlook
Bitcoin is showing a potential bullish reversal, with the chart presenting a possible Elliott Wave formation that supports further upside movement. The price structure suggests that BTCUSD may have completed its corrective Wave 4 around the $72,600 support region, potentially preparing for a bullish Wave 5 continuation.
The projected structure indicates that buyers could regain control and push Bitcoin towards the $75,600 resistance area. The highlighted demand
BTCUSD Strategic Outlook Update📌 My take
Price is trading under the ★★★★ 8.0/10 VERY STRONG band at 75,800 to 77,800 after rejecting it in early November, and the October sweep at ~87k is now the failed high that defines the whole structure. The tape has printed a clean staircase of lower highs and lower lows since then, and nothing between spot and 59,000 is defending the downside. I expect the leg to extend through late December into January, work the 22-retest shelf at 59,000 to 60,500, and flush into 50,000 to 52,000 — a
BITCOIN: Since Bearish Drop, Important Channel is Forming!Hello Community,
Welcome to my new analysis of Bitcoin on the daily timeframe. In recent times, BITCOIN has shown massive bearish price action, which has confirmed several bearish lower lows within the structure. Now, this whole dynamic is highly crucial for the upcoming outcomes and the continued price action. Therefore, I have identified all the underlying factors necessary to consider.
When looking at my chart, we can see how BITCOIN is trading within this massive descending channel format
Bitcoin - Approaching the final support again!👑Bitcoin ( CRYPTO:BTCUSD ) still remains above the support:
🔎Analysis summary:
For the past couple of weeks, Bitcoin has just been creating quite a lot of volatility. But looking at the higher timeframe, Bitcoin is also once again approaching its major support area. If Bitcoin creates some bullish confirmation, the underlying bullrun will continue.
📝Levels to watch:
$60,000 and $120,000
Keep your #LONGTERMVISION🙏
— Phil (@TheTraderPhil)
BITCOIN The simplest strategy in existence.Bitcoin (BTCUSD) has one simple room that macro investors should follow and is in fact our most popular publication: The Golden Bull Cycle ratio. Simply put, Buy 17 months (517 days) before the Halving (when the Cycle bottoms) and Sell 18 months (548 days) after the Halving (when the Cycle tops).
That's the simplest strategy in existence and is virtually all a BTC investor should know. What does this specifically mean for us now? November marks 17 months before the expected April 2028 Halving,