BTC30m | Bearish Divergence vs High-Confluence Demand. Who Wins?#BTC has entered a critical decision zone where multiple technical factors are converging.
Momentum is weakening, but price is approaching an area where buyers have several reasons to defend.
This isn't about predicting the next move—it's about letting the market reveal its intent.
📊 Confluence Zone
🟢 Minor Demand
First area where buyers are expected to react.
Holding this zone preserves the short-term bullish structure.
🟡 Fair Value Gap (FVG)
A potential imbalance waiting to be mitigated.
Often attracts price before the next impulsive move.
📐 50% – 61.8% Fibonacci Retracement
A classic institutional retracement area.
Adds weight to the demand zone below.
📉 Bearish RSI Divergence
Momentum is fading while price previously made higher highs.
A warning signal—not a standalone reason to short.
📈 Trading Scenarios
🟢 Bullish
Buyers defend Minor Demand and the FVG.
Price respects the 50–61.8% retracement.
RSI begins to recover.
Probability increases for a move back toward the recent swing highs.
🔴 Bearish
Minor Demand fails.
FVG is fully filled without a strong reaction.
Sellers gain momentum, increasing the probability of a deeper correction.
One signal creates an idea. Multiple confluences create conviction.
The highest-probability trades rarely come from a single indicator. They emerge when market structure, liquidity, momentum, and price location align.
For now, my bias remains constructive while BTC trades above the Fair Value Gap, but I'll wait for confirmation before committing to the next move.
What's your view?
📈 Will buyers defend this confluence zone?
📉 Or does the bearish divergence lead to a deeper pullback?
Share your analysis below. 👇
In-depth trading ideas
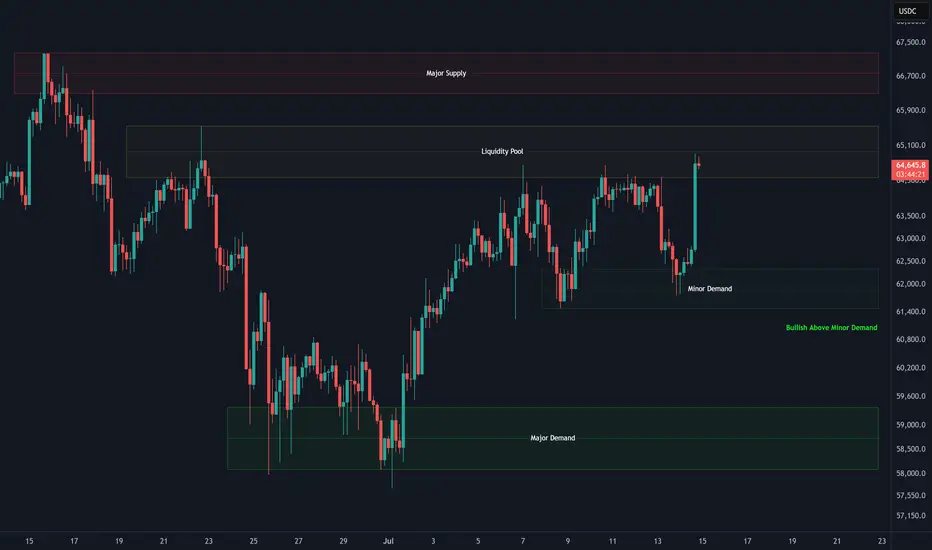
BTC 4H | Liquidity Pool in Sight. Will Buyers Push Into Supply?#BTC has successfully defended the Minor Demand zone, shifting short-term momentum back in favor of buyers.
The next objective is clear.
📍 Liquidity Pool
This area contains resting orders that often attract price before the market decides its next major move.
📊 Key Levels
🟢 Minor Demand
Successfully defended by buyers.
As long as price remains above this zone, the short-term structure stays constructive.
🟡 Liquidity Pool
Immediate upside objective.
Expect increased volatility as price approaches this area.
🔴 Major Supply
The next higher-timeframe resistance.
This is where I'll be watching closely for either continuation or rejection.
🟢 Major Demand
If buyers lose control of Minor Demand, this becomes the next high-probability support.
📈 Trading Scenarios
🟢 Bullish
Minor Demand continues to hold.
Liquidity Pool is cleared.
Buyers challenge Major Supply.
🔴 Bearish
Liquidity sweep into resistance.
Rejection from the Liquidity Pool or Major Supply.
Rotation back toward Minor Demand.
Liquidity is a destination, not a guarantee of continuation.
Smart money often moves price toward liquidity before revealing its true intention.
Right now, BTC remains constructive while trading above Minor Demand, but I'll only increase bullish conviction if buyers can maintain strength after the Liquidity Pool is tested.
What's your view?
📈 Break through liquidity and continue toward Major Supply?
📉 Liquidity sweep followed by rejection?
Let's discuss below. 👇
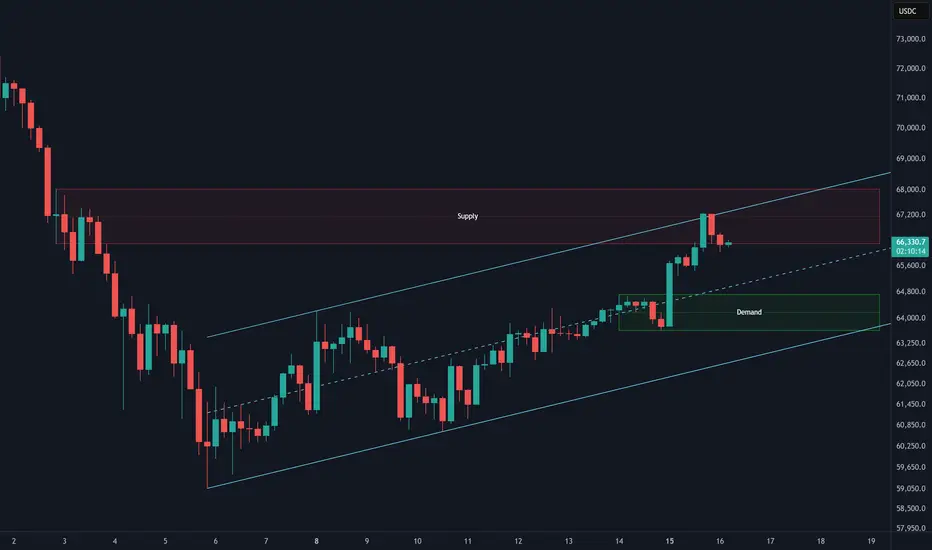
BTC traders are watching the WRONG levels.While retail chases candles, smart money watches liquidity.
📉 4h Trend: Bearish
📈 30m: Ascending Triangle
🎯 Liquidity above 64.5k
🎯 Major Supply: 64.5k - 66.3k
The highest probability setup isn't predicting direction.
It's waiting for price to reach key liquidity zones and letting the market show its hand.
Remember:
❌ Impatience pays the market.
✅ Patience gets paid by the market.
#BTC #Bitcoin
Why Most Traders Enter Too LateBy the time social media gets excited, liquidity has usually been taken.
#BTC just swept into a key liquidity zone and started pulling back.
The lesson?
Don't trade where everyone sees opportunity. Trade where risk is smallest.
✅ Liquidity above was targeted
✅ Reaction followed immediately
✅ Now the market reveals its true intention
The chart speaks first.
Most traders listen too late.
The Best Traders Don't Chase This Move#BTC is sitting inside a supply zone after a strong impulse from demand.
Most traders see momentum.
I see a decision point.
If buyers absorb supply here, higher prices become likely. If not, patience will offer a better entry.
Location matters more than candles.
That's one lesson that can change your trading forever.
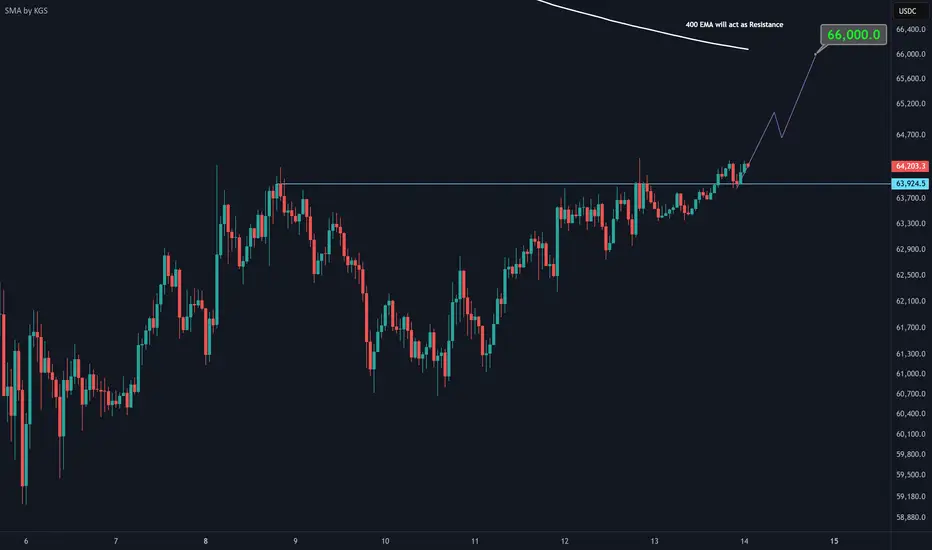
BTC Just Retested the Breakout LevelMost traders celebrate the breakout.
Professionals watch the retest.
#BTC broke above 63.9K and has now returned to test it as support. This is where the market reveals whether the breakout was real or just another trap.
✅ Resistance → Support
✅ Support → Opportunity
✅ Risk remains clearly defined
The best trades aren't found in the breakout.
They're found in the confirmation.
Trade reactions, not predictions.
A Simple Trading Lesson From BTCDon't chase breakouts.
Wait for the market to prove the breakout is real.
#BTC has broken above a major resistance zone and is now attempting to hold it as support.
That's where high-quality trades are found:
✅ Clear level
✅ Defined risk
✅ Logical target
Trading gets easier when you stop predicting and start reacting.
The chart whispers before it moves. Learn to listen. 📈
The Market Just Told You Its Short-term DirectionMost traders focus on indicators.
Professionals focus on levels.
#BTC has reclaimed a key support zone and is now building acceptance above it. As long as this level holds, the path of least resistance remains higher.
📌 Support becomes opportunity when defended.
📌 Risk is defined before the trade is taken.
📌 Patience is what turns analysis into profits.
My eyes are on the 66K liquidity zone next.
Trade levels. Ignore emotions.
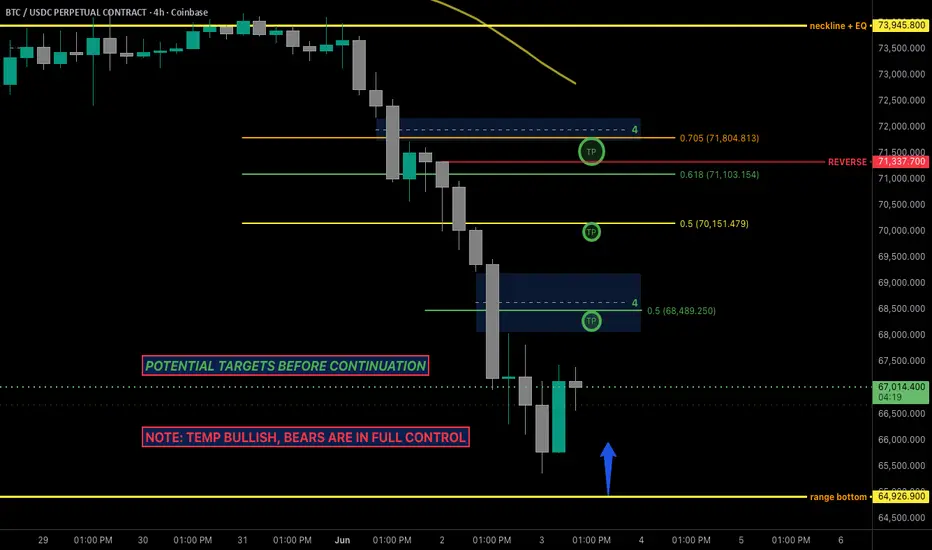
BTC 4H: Temporary Relief Rally Before further DownsideBTC remains bearish on the 4H with sellers firmly in control. A relief rally into key Fibonacci resistance levels is possible, but unless the reversal zone is reclaimed I expect downside continuation toward the range lows.
I have included potential areas to target.
Not financial advice. Trade your own plan and manage risk accordingly. 🫡
BTCUSD Weekly Price Action OutlookThe weekly time frame momentum has shifted from bullish to bearish. However, looking at the three bearish candles, the bearish hammer candle shows that buyers stepped in and attempted to push price higher. The following week’s candle is bearish, but it still does not show clear signs of strong bearish momentum yet.
Based on my analysis, I believe price may simply be correcting before another bullish run. The next confirmation I would be looking for is price holding above the bottom gap and forming green weekly candles in the coming weeks. That would be the first sign that this move was potentially just a correction before price trends back upward again.
Price action is the first thing I am analyzing.
BTC 4H Outlook: Playing The Current Range
So far the bearish scenario continues to play out well. Price rejected the HTF resistance / range EQ region and respected the trendline breakdown.
At the moment, price still looks range-bound to me rather than full bearish continuation just yet.
Reclaim the range EQ and I’ll reassess. Until then, bears still have control in my opinion.
For now:
Range high remains resistance Range low remains support Patience until clear breakout confirmation
BTC/USDT Technical Analysis, Trade setup review, 2026-05-17BTC/USDT Technical Analysis, Trade setup review, 2026-05-17
This is a trade review / educational breakdown of a LONG idea on BTC/USDC spot (Binance).
Key levels used:
• Entry area: 78,355.19
• Target (TP): 80,314.07 → +2.50%
• Stop area: 77,571.64 → -1.00%
• R/R: 2.50 : 1
What the bot observed (whale detection – 3/6 methods):
• Iceberg orders
• Market sweep
• Statistical bid imbalance: 67.4%
• Pattern label: WHALE ACCUMULATION
I will update this idea with the actual outcome (hit TP / hit SL / manual close).
BTC MomentumOn the weekly time frame, there is a long lower wick, showing strong rejection from lower prices. Zooming into the daily time frame, the overall structure still looks bullish and remains in an uptrend, but this week’s momentum is starting to look bearish. The bands appear close to flipping red on the daily, and the daily FVG has already been mitigated, with price breaking below the bottom of the gap.
The daily swing low could potentially be tested, considering how close price currently is to those levels. Price may also begin showing signs of divergence over the coming days, which could lead to a deeper pullback within the overall uptrend.
$BTCUSDC 3D Multi-year RSI descending trendlineThe 3-day RSI has not yet touched the descending trendline, so there is potentially more room to the upside. Previously, after a pullback, once the RSI touched the trendline, there was a healthy relief rally before the price eventually crashed lower into a deeper correction, which would represent the bearish long-term setup. However, if the 3-day RSI eventually breaks above the trendline, I would expect a bull market rally to follow. This would represent the bullish long-term setup.
Fibonacci Extension ValleyFibonacci extension from JOAT indicator drops into the Nadaraya-Watson Channel, and price has traded at the bottom edge of the channel; this is often a reliable buy indicator.
On the 1 hour chart, I am going long here with leverage.
I will set a trailing stop once price reaches the top of the NW channel.
BTC long entry - Trading the channelRecently, I have been entering trades with a shorter duration with leverage. I have learned that trading this channel has provided reliable trades
RSI oversold on 5000R chart
Bottom of the channel
Buy dot
Most of my trades target $1500 - $2000 rise or fall in BTC. I will monitor the trade and close once price moves outside the trend channel on the top side.
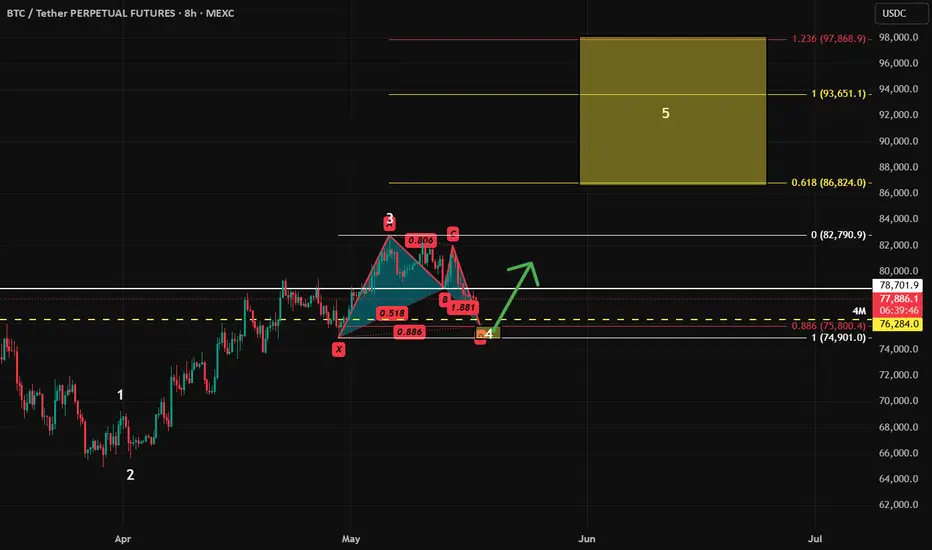
#BTC : The Expanding Flat Correction & The Anatomy of a Reversal🚀Overview
Welcome back, traders. Today we are taking a deep dive into one of the most misunderstood and highly deceptive corrective structures in the market: **The Expanding Flat**.
When you see retail traders getting chopped to pieces by fake breakouts and brutal stop-hunts, they are usually trapped inside this exact pattern. However, for those who understand Elliott Wave theory and market geometry, this structure offers one of the highest-probability setups for catching a massive bullish reversal.
Let’s break down the mechanics of this chart, step-by-step, and map out the impending explosive move.
📐 The Technical Breakdown: A-B-C Geometry
We are operating within a macro uptrend, meaning our primary bias is long. What we are currently observing is a complex consolidation phase designed to reset market equilibrium before the next major leg up.
Unlike a standard zigzag correction, an Expanding Flat is characterized by a 3-3-5 sub-wave structure that actively sweeps liquidity on *both* sides of the market.
Wave A (The Initial Shakeout): We see a standard 3-wave decline (a-b-c). This establishes the initial corrective range and shakes out the first layer of weak hands.
Wave B (The Bull Trap): This is where the psychological warfare begins. Wave B unfolds as another 3-wave structure (a-b-c) but pushes *higher* than the origin of Wave A. This triggers breakout alerts, sucks in late retail buyers, and sweeps topside liquidity.
Wave C (The Final Flush): Once the late buyers are trapped, the market aggressively reverses into a sharp, 5-wave impulsive decline (1-2-3-4-5). Crucially, Wave C breaks *below* the bottom of Wave A. This triggers stop-losses, liquidates over-leveraged longs, and creates peak fear in the market.
🎯 Fibonacci Confluence & Structural Integrity
Notice the red horizontal levels marked at the top of the chart. These are the critical Fibonacci extension levels for Wave B: **1.14, 1.27, and 1.68**.
In an Expanding Flat, Wave B must retrace more than 100% of Wave A. The 1.14 to 1.27 extension zone is the mathematical sweet spot for market makers to engineer a fakeout high before initiating the Wave C markdown. By capping the B-wave within these precise Fib boundaries, the algorithmic nature of this correction is confirmed.
🧠 The Psychological Edge
Trading is just as much about emotional regulation as it is about charting. The Expanding Flat is the ultimate test of trader psychology:
1. Greed: Faking a breakout to the upside (Wave B) to trigger FOMO.
2. Fear: Dropping the price to a new lower low (Wave C) to trigger panic selling.
By identifying the 5th sub-wave of Wave C, we are stepping in precisely when retail capitulation is at its highest. You aren't just buying a dip; you are buying the engineered exhaustion of the sellers.
🛠️ Forward Outlook & Trade Execution
We are currently watching the terminal phase of Wave C. The 5th sub-wave is finalizing, indicating that the corrective sequence is complete and the overarching macro uptrend is ready to resume with a powerful impulsive wave.
The Game Plan:
Anticipation: Look for price action to stabilize here at the Wave C lows.
Confirmation: We want to see a violent rejection of these lower levels, followed by a break of local market structure to the upside (a lower-timeframe 5-wave impulse up).
Invalidation: A sustained, high-volume breakdown significantly below the terminal point of Wave C would invalidate this specific Elliott Wave count and require a reassessment of the macro trend.
Patience pays. Let the market prove the bottom is in, and prepare for the ride up.
Trade safe, manage your risk, and trade what you see, not what you feel.
---
Nathnael Biruk. @cryptotalk_et
BTCUSD: The $86K Liquidation Trap (Sweep & Dump Protocol)Retail operators are currently cheering the push above the $82K moving average, misinterpreting it as a structural macro shift. Our MTF Probability Engine flags this movement not as a breakout, but as an engineered kinetic trap.
To understand the algorithmic footprint, you must look at the Volumetric Gravity.
⚖️ The Liquidity Asymmetry:
Currently, there is a massive 4.3-to-1 asymmetry in the liquidation pools:
⏬ South Vector ($72K): $14.2 Billion in exposed Long liquidations.
⏫ North Vector ($91K): $3.3 Billion in exposed Short liquidations.
The ultimate magnetic target for Smart Money is $72K. But algorithms rarely move in a straight line. They require massive buy-side liquidity to offload (sell) their heavy positions without crashing the price prematurely.
🧱 The $86K MGI Fusion Zone (The Trap):
How do institutions generate that buy-side liquidity? By engineering a "Bull Trap."
They push the price through the $82K resistance, targeting the localized heatmap cluster at $86,000. This calculated spike achieves two objectives:
It liquidates and sweeps the "early shorters" (forcing them to buy to cover).
It triggers retail FOMO ("The bull market is back!"), flooding the book with fresh buy orders.
🎯 The Matrix Execution:
Once the price sweeps the $86K zone, our Kinetic Oscillator will track the exact moment of Absolute Exhaustion (>85% Score). That is where the real institutional distribution happens, followed by the violent kinetic dump toward the $72K liquidity pool.
Stop buying retail breakouts. Start trading the institutional sweep.
Are you front-running the trap, or are you the liquidity?
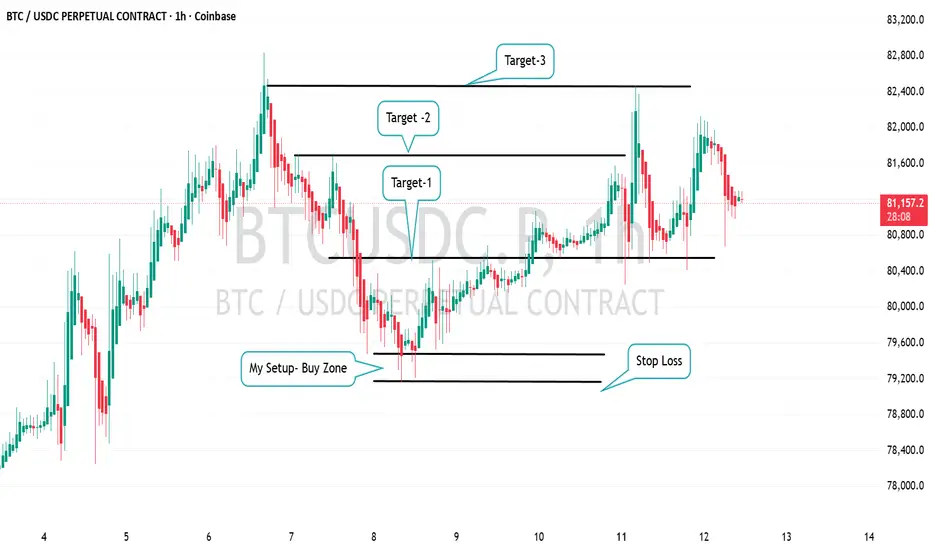
BTCUSDC Long Setup | Buy Zone Activated🚀 BTCUSDC Long Setup | Buy Zone Activated
Market: BTCUSDC Perpetual Contract
Timeframe: 1H
Bias: Bullish 📈
BTC is currently holding a strong intraday support area after a healthy pullback. Price reacted perfectly from the marked buy zone, showing signs of buyer absorption and continuation potential.
📌 Trade Setup
Buy Zone: 79,200 – 79,500
Stop Loss: Below support structure
Target 1: 80,500
Target 2: 81,600
Target 3: 82,400+
🧠 Technical Analysis
Strong rebound from demand/support area
Higher low formation on lower timeframe
Momentum building toward resistance breakout
Risk-to-reward setup remains attractive for intraday swing continuation
🔥 Bullish Confirmation
If BTC sustains above 80,500, momentum can accelerate toward higher targets quickly.
⚠️ Risk Management
Avoid chasing after extended candles
Better entry on pullback/retest near support
Use proper position sizing and SL discipline
📊 Educational analysis only — not financial advice.
#BTC #Bitcoin #BTCUSDC #Crypto #TradingView #PriceAction #CryptoTrading #BitcoinTrading #SupportAndResistance #Scalping #SwingTrading
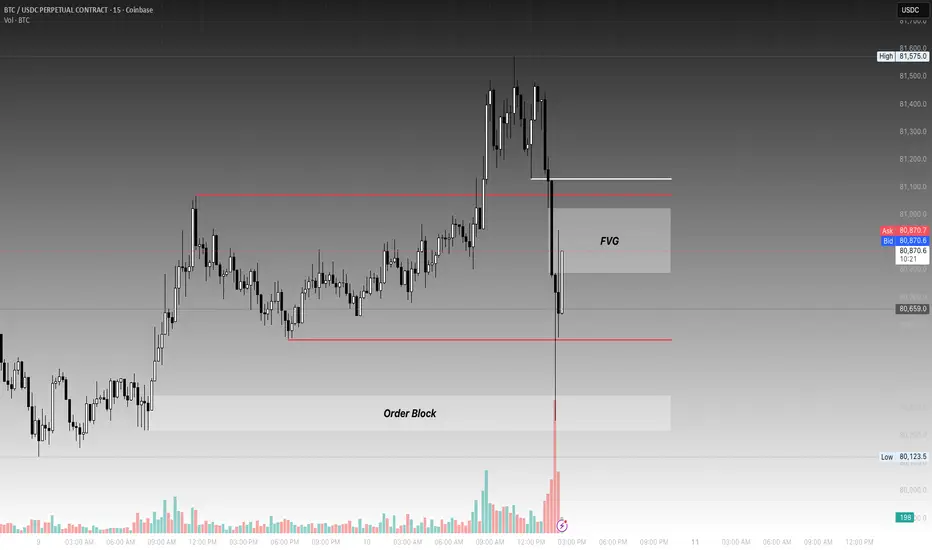
BTC Analysis 15 min Time-FramePrice just came back down and left a gap. It could potentially move back up to fill the imbalance since the move happened too quickly. Price has created an imbalance, and key levels are now being tested. The order block was tested, the swing low was tested, and the price consolidated above the first sweep at 81k before moving back inside with the bands flipped red.