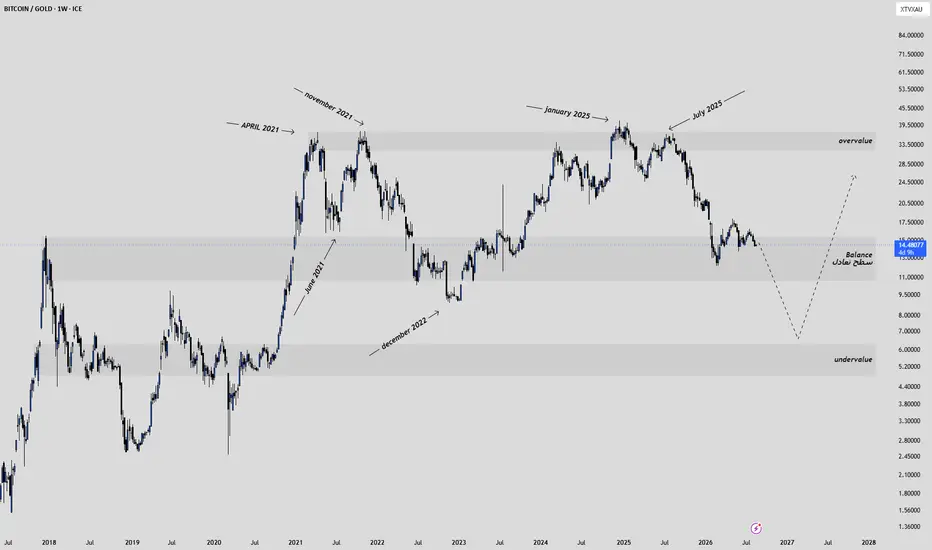
Bitcoin vs. Gold: The Market Relationship Most Traders Overlook
Most Bitcoin analysis starts with BTC/USD.
That makes sense — but it also means we may be ignoring another chart that can reveal something completely different about the market.
Bitcoin priced in Gold.
Instead of asking whether Bitcoin is simply moving higher or lower in dollar terms, BTC/Gold asks a more interesting question:
Is Bitcoin gaining or losing relative strength against Gold?
Right now, the weekly chart is approaching an area that could make that question particularly relevant.
In-depth trading ideas
Bitcoin Taking Some Shine From GoldLast week was not an ideal backdrop for Bitcoin. Not only did the Clarity act not pass in Congress, but the Fed had a hawkish rate hike. This unsettled gold as the metal sold off on that announcement but interestingly, Bitcoin held up quite a bit better, as has been the case ever since the announcement of larger Treasury buybacks from the US Treasury.
Last week finished with a bullish engulf in Bitcoin and that strength has so far continued through early trade this week. Meanwhile, gold remain
BTCXAU-SELL strategy daily chart reg. channelBTC is way above it's level, and requires heavy adjustment downward. GOLD has retrieved, whilst BTC is hanging high. The cross rate has potential 16.30 area which means a larger move lower for BTCUSD as a result.
Strategy SELL currejnt 17.75-17.90 and take profit near 16.40 area for now.
Bitcoin to Ounce of Gold on Monthly Time FrameConsecutive divergences caused the chart to be corrected
Given that this chart shows the trend of Bitcoin relative to gold, it should be noted that gold is always in the category of low-risk assets, while Bitcoin and other digital currencies are in the category of high-risk assets.
And given that we are witnessing wars in different parts of the world and these wars may continue, perhaps this chart indicates that investors around the world currently prefer to have low-risk assets with high liquid
Bitcoin / Gold: The Rotation MapThe chart highlights three key zones:
Overvalue — where Bitcoin is relatively expensive versus Gold and risk appetite is already elevated.
Balance — the market’s equilibrium zone.
We are currently here, where price is largely moving sideways and the market is still deciding between protection and risk.
Undervalue — the zone where Bitcoin becomes increasingly attractive relative to Gold.
The broader idea is simple:
Risk-Off → Gold
When risk is no longer acceptable, capital seeks pro
Ehyah Domain# Ehyah Domain — One Market. Many Observable Layers.
## What if no single market approach is meant to show you the whole market?
Market Structure. Volume Profile. Supply & Demand. Auction Market Theory. DOM/liquidity. Order flow. Fibonacci. Fundamentals. Valuation. Macro. Positioning.
These are only examples.
Each attempts to reveal **one part of the same underlying market**.
Some may reveal that part well. Some may contain unnecessary noise. Some claims may fail completely when tested.
Th
9 Year Structure: Measuring Bitcoin's Monetary Strength to GoldBTC/Gold Ratio: A Nine-Year Structural Framework for Measuring Bitcoin's Monetary Strength
Introduction
Most Bitcoin charts are measured against fiat currency. While useful, fiat-denominated charts are influenced by inflation, monetary policy, and changes in the purchasing power of the dollar.
This study instead examines the BTC/Gold ratio—the number of ounces of gold one Bitcoin can purchase.
Gold has served as a monetary benchmark for thousands of years. Measuring Bitcoin against gold attemp
BTCXAU- SELL strategy Daily chart GANNBTC is holding up, whilst GOLD has moved below the $ 4,000 area. This is significant, and also looking at the pattern of this cross BTCXAU, I feel we may test 14.1100 coming sessions. This means BTCUSD will catch up and test of $ 51 seems possible.
Strategy SELL between 14.8500-15.11 and take profit near 14.12 initially.
BTCXAU- SELL strategy 4 hourly chart GANNWe currently have an ascending wedge, and I feel a downward continuation pattern. We are support by 14.80-15.00 area, and for now this is key levels before we embark on the downside.
The indicators are supportive short-term and a move to 15.50 is possible.
Strategy SELL into strength between 14.90-15.35 and take profit near 13.80 for now.
BTCXAU Daily Chart ;TradeWithMky hello team
in daily time frame I am strongly in bullish powerfull activities that recently saw in higher time frame and also many sign like 4H and daily timeframe that shown that price could reach higher by the time pass 16.9 BTC XaU
if price confim above this zone we are facing with strong uptrend that could reach higher high and make some new ATHs
we have a IMBalance zone that should retouch as soon as possible with at least shadow and it could happen in short time
The Future of Earth Reflected in the Gold-Bitcoin ChartSometimes markets feel lifeless, confusing, and heavy — but that’s exactly when the story begins to unfold.
In this chart, we may be witnessing a potential rise in Bitcoin’s price or a drop in gold’s value after a long period of stagnation. It signals a time when the crypto market could start recovering, when some tokens — like Aave — might even break new highs.
Meanwhile, the American people are striving to bring calm and reduce global tensions. Their collective power is rarely mentioned, yet
BTCXAU Bounce to ~140 in next 18 monthsAs with renewal of last business cycle, BTCXAU bottoming in lower accumulation channel bounced and ran to 2 fib extension within year and half.
Repeat would put BTCXAU near 140; with gold between $3.8k-$5k that would imply BTC run to $500k-700k in the next 18 months.
When the good entry points are left behindHow simple was my recommendation: buy gold, sell Bitcoin!
If you followed my advice, you're feeling great! You're doing well, and so am I.
But seeing a signal and acting on it are not the same.
Let's compare the price of Bitcoin in October 2025 to now. How much has it lost?
Now let's look at gold. How much has it grown? And what can we learn from the Bitcoin/Gold ratio?
On October 14, 2025, when I penned my forecast , Bitcoin was valued at roughly $113,400, while gold hovered around $4,12
Bitcoin / Gold (BTC/XAU) – Monthly Chart OutlookTVC:BTCXAU is pulling back into the mid-range of the long-term consolidation that has held since 2021. Price is currently trading around 22, while spot TVC:GOLD is near $4000 and BITMEX:XBT near $90,000.
The pair recently lost the 20-month EMA, showing weakening momentum after multiple failed attempts to break the upper boundary of the range near 41. As long as BTC/XAU remains below the EMA, the risk leans toward continued mean reversion inside the horizontal structure.
The key support zo
BTCXAU-BUY strategy weekly chart GANN SQThe BTCXAU combo looks interesting. We are currently slightly below the support area, but considering RSI and low fisher form, we may see a chance to return back to 23.5 > 25.88 recovery.
This suggest we see higher BTCUSD and a correction in GOLD first back towards $ 4,000/oz.