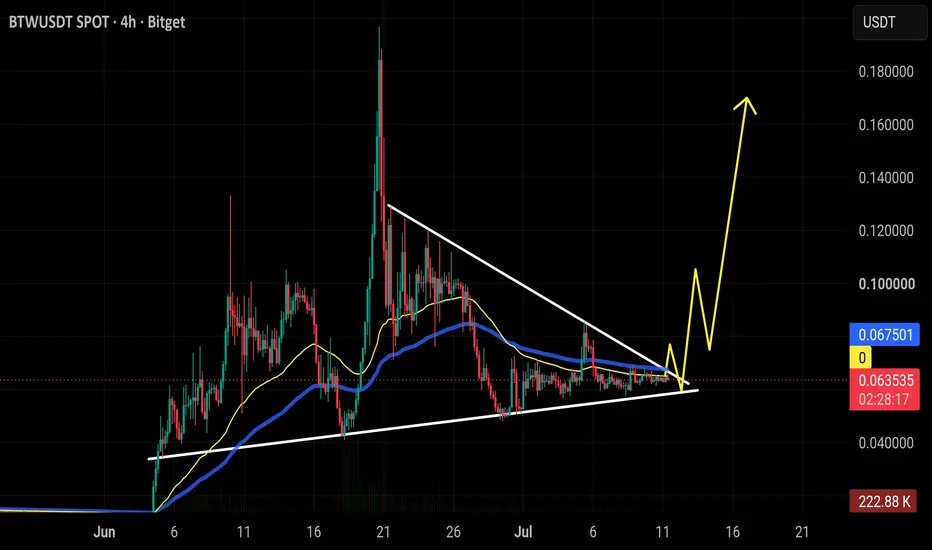
BTWUSDT Forming Bullish MomentumBTWUSDT is forming a clear bullish momentum pattern, a classic bullish wave signal that often indicates an upcoming breakout. The price has been consolidating within a narrowing range, suggesting that selling pressure is weakening while buyers are beginning to regain control. With consistent volume confirming accumulation at lower levels, the setup hints at a potential bullish breakout soon. The projected move could lead to an impressive gain of around 90% to 100% once the price breaks above the wedge resistance.
This bullish momentum pattern is typically seen at the end of downtrends or corrective phases, and it represents a potential shift in market sentiment from bearish to bullish. Traders closely watching BTWUSDT are noting the strengthening momentum as it nears a breakout zone. The healthy trading volume adds confidence to this pattern, showing that market participants are positioning early in anticipation of a reversal.
Investors' growing interest in BTWUSDT reflects rising confidence in the project's long-term fundamentals and current technical strength. If the breakout confirms with sustained buying volume, this could mark the start of a fresh bullish leg. Traders might find this a valuable setup for medium-term gains, especially as the momentum pattern completes and buying pressure continues to accelerate.
โ
Show your support by hitting the like button and
โ
Leaving a comment below! (What is You opinion about this Coin)
Your feedback and engagement keep me inspired to share more insightful market analysis with you!
BTW Perpetual LinearSwap Contract
No trades
No trades
In-depth trading ideas
๏ปฟ$BTW already delivered. A 67% pump GETTEX:BTW already delivered. โ
The setup played out exactly as expected, and we're now up over 67% from the entry.
This is why I always say to trust the setup instead of chasing random pumps. Patience pays.
If you took this trade with me, congratulations. Lock in profits if needed and manage your risk.
One more clean winner for the community. ๐๐
The Next $BTW Rally Could Start From HereThe Next BTW Rally Could Start From Here .... ๐
GETTEX:BTW continues to hold inside the rising support zone, and this trendline has already been respected multiple times. As long as buyers keep defending this area, the overall structure remains positive. The market is taking a break after the previous move, which is normal before the next expansion.
The first level I'm watching is around 0.075. If price breaks and holds above it, the next targets become 0.097 and 0.133. Those are the key resistance areas where momentum could increase if volume starts coming in.
I'm watching how price reacts around this support because this level is the key for the current structure. The next few candles will be important, so let's see how buyers respond.
$BTW is still holding its structure and trading right at the tipGETTEX:BTW is still holding its structure and trading right at the tip of the triangle.
The price hasn't broken out yet, but it's getting very close. A clean 4H close above the descending trendline could be the trigger for the next move higher.
As long as the rising support continues to hold, the bullish setup remains valid. The breakout looks like it's only a matter of time if buyers keep the pressure on.
$BTW is up 38% since the breakout, and the setup continues to plGETTEX:BTW is up 38% since the breakout, and the setup continues to play out as expected.
After the move higher, price came back and retest the breakout level, held support, As long as this support holds, the bullish structure remains intact, with buyers now looking to push price back above the key EMAs and continue the trend higher.
$BTW has been quietly coiling inside a symmetrical triangle afteGETTEX:BTW has been quietly coiling inside a symmetrical triangle after its strong impulsive move earlier this cycle.
Price is now approaching the apex of the pattern, where volatility usually returns. A confirmed breakout from here could be the trigger for the next leg higher.
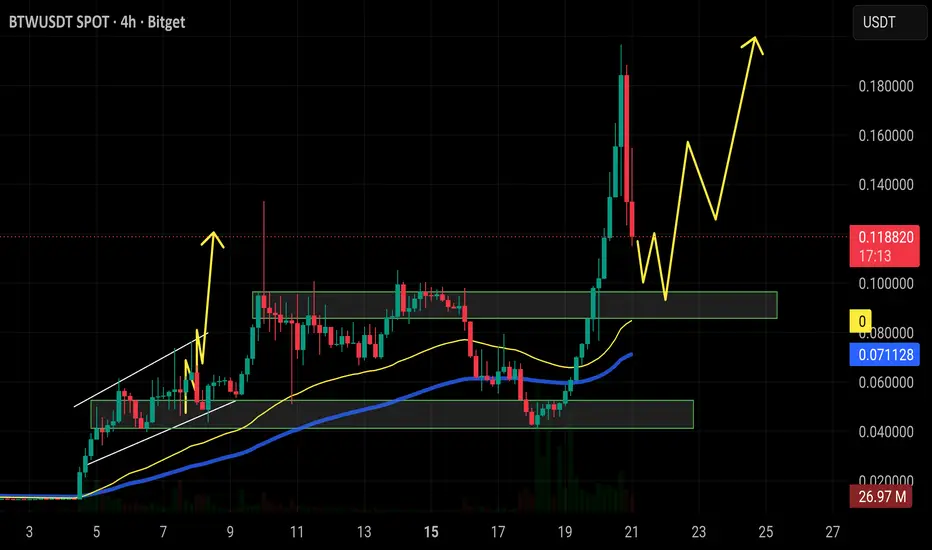
$BTW update, the setup played out nicely with price rallying as GETTEX:BTW update, the setup played out nicely with price rallying as much as 67% from the highlighted support zone. After the strong move, GETTEX:BTW is now consolidating above a key support area between $0.075 and $0.086. As long as this zone continues to hold, the bullish structure remains intact and another push toward higher levels remains on the table.
BTW/USDT - Bull Flag, Is the Next Rally About to Begin From ThisBTW/USDT on the 30-minute timeframe is currently forming a Bull Flag pattern after experiencing a strong impulsive rally. Following the sharp upward move, price has entered a structured correction phase within a descending channel (flag), which is historically considered a bullish continuation pattern.
๐จ Price is currently holding above a Strong Demand Zone, highlighted by the yellow block between 0.0857 โ 0.0773.
This area is one of the most critical zones in determining whether the bullish trend will continue or if a deeper correction will take place.
---
๐ฉ Bull Flag Pattern Explanation
๐ Flag Pole
The aggressive price surge from the lower levels toward the recent peak around 0.18+ has formed a strong flagpole.
โ
Shows strong buyer dominance.
โ
Serves as the foundation for potential upside projections if a breakout occurs.
---
๐ Flag Formation
After the sharp rally, price entered a healthy consolidation phase inside a descending channel bounded by:
๐ด Red Resistance Trendline
๐ก Yellow Support Trendline
This structure is known as a Bull Flag, a pattern that often appears before the primary uptrend resumes.
---
๐จ Strong Demand Zone
๐ Zone: 0.0857 โ 0.0773
This area serves as:
๐ก๏ธ A key buyer defense zone
๐ฐ A potential accumulation area
๐ A launchpad for a breakout attempt
โ ๏ธ A bullish invalidation zone if broken decisively
As long as price remains above this area, the bullish breakout scenario remains valid.
---
๐ฏ Key Levels
๐ข Major Support
๐น 0.0857
๐น 0.0773
---
๐ฅ Immediate Resistance
๐ธ 0.1006
---
๐ Bullish Targets
๐ฏ 0.1255
๐ฏ 0.1450
๐ฏ 0.1905
๐ฏ 0.2051 (Previous High)
---
๐ Bullish Scenario
The bullish case becomes stronger if:
โ
Price continues holding above the 0.0857 โ 0.0773 demand zone
โ
A breakout occurs above the red descending resistance trendline
โ
Price reclaims and closes above 0.1006 resistance
โ
Buying volume increases significantly
If the breakout is confirmed, the next upside targets could be:
๐ 0.1255
๐ 0.1450
๐ 0.1905
๐ 0.2051
These targets align with the classic Bull Flag projection based on the previous flagpole's height.
---
๐ป Bearish Scenario
The bearish scenario becomes active if:
โ Price loses the 0.0857 โ 0.0773 demand zone
โ A breakdown occurs below the channel support
โ Selling volume increases substantially
If the major support zone fails, the Bull Flag structure becomes invalid, opening the door for a deeper correction toward lower support levels.
โ ๏ธ Avoid FOMO entries before a confirmed breakout occurs.
---
๐ Conclusion
๐ฅ BTW is currently trading at a critical decision point.
The combination of:
๐ฉ Bull Flag Pattern
๐จ Strong Demand Zone (0.0857 โ 0.0773)
creates a highly attractive technical setup for traders and investors.
๐ As long as support remains intact, the probability of a breakout toward 0.1255 โ 0.2051 remains strong.
๐ However, if support is lost, the bullish scenario will be delayed and a deeper correction could follow.
โณ The next few trading sessions will likely determine the direction of BTW's next major move.
---
โ ๏ธ Disclaimer: This analysis is for educational purposes only and should not be considered financial advice. Always conduct your own research and apply proper risk management before making any trading decisions.
#BTW #BTWUSDT #BullFlag #BullishBreakout #CryptoAnalysis #TechnicalAnalysis #Altcoin #AltcoinSeason #CryptoTrading #BreakoutSetup #PriceAction #SupportAndResistance #CryptoMarket #ChartAnalysis #BullishPattern #TradingCommunity #RiskManagement #CryptoSignals
$BTW has already delivered a strong 33% move from this support GETTEX:BTW has already delivered a strong 33% move from this support zone and is now retesting the 99 EMA. As long as the $0.073 area continues to hold, a recovery back toward the $0.09-$0.10 resistance zone remains possible. If support fails, the next key demand area sits around $0.052-$0.042, where buyers could step in again. ๐๐ฅ
$BTW has already shown what it can do after reclaiming the 99 EMGETTEX:BTW has already shown what it can do after reclaiming the 99 EMA, exploding from the demand zone into a strong impulsive move. The current pullback looks like a healthy retest of the breakout area, and as long as the $0.09-$0.10 zone holds as support, another leg higher toward new highs remains a strong possibility. ๐๐ฅ
BTWUSDT โ Awakening From AccumulationHey there!! How you doing in this bloody market?
June 5, 2026
๐ BTWUSDT โ Awakening From Accumulation
BTW is showing one of the earliest signs of a potential trend reversal after spending months in a compressed accumulation range.
These are often the types of structures that produce the strongest percentage moves once liquidity returns and resistance begins to break.
๐ง Stage 1 โ Early Stage 2 Transition
BTW appears to be completing a long accumulation phase:
โ Downtrend โ exhausted
โ Selling pressure โ absorbed
โ Base formation โ completed
โ Breakout attempt โ underway
After trading sideways for weeks around the $0.02โ$0.04 region, price is now showing its first meaningful expansion in volume.
๐ Current Setup
Price: ~$0.042
BTW is now:
Reclaiming the primary accumulation range
Breaking above short-term resistance
Printing its highest volume in months
The recent surge suggests fresh participation is entering the market.
๐งฑ Key Levels
Support:
$0.039โ$0.042 โ breakout / flip zone
$0.013 โ macro accumulation support
Resistance / Targets:
$0.066 โ first major resistance
$0.092 โ secondary expansion target
$0.30 โ macro liquidity objective
๐ฏ Scenario
โ
Bullish Case (Stage 2 Trigger)
If BTW:
Holds above the breakout zone
Builds acceptance above $0.04
Maintains elevated volume
โ A move toward $0.066 and potentially $0.092 becomes increasingly likely.
A successful breakout would mark the first significant trend change since the prolonged consolidation began.
โ ๏ธ Weak Case
Failure to hold current levels:
โ Return into accumulation
โ Additional base-building required
(No major structural damage unless the $0.013 support zone is lost)
๐ Final Thought
BTW is not fully trending yet โ
but it's beginning to do something more important:
๐ Transition from dormancy to participation.
The combination of long accumulation, expanding volume, and a breakout attempt creates a setup worth monitoring closely.
If confirmation follows:
โก accumulation โ breakout โ expansion
And that's where the strongest revaluations often begin.
$BTW delivered a strong 40% pump exactly as expected, but price ๐จ GETTEX:BTW delivered a strong 40% pump exactly as expected, but price faced heavy rejection at the channel resistance zone.
Now the key level to watch is the rising trendline support. As long as this support holds, the bullish structure remains intact and another push toward higher highs is possible. However, a breakdown below support could trigger a deeper correction before the next major move. ๐โ ๏ธ๐ฅ
$BTW is respecting the rising trendline perfectly and continues ๐ GETTEX:BTW is respecting the rising trendline perfectly and continues to print higher lows above key support.
As long as the trendline holds, this consolidation looks like a bullish continuation structure, with a breakout above resistance potentially triggering a strong move toward the $0.08-$0.12 region. ๐๐ฅ