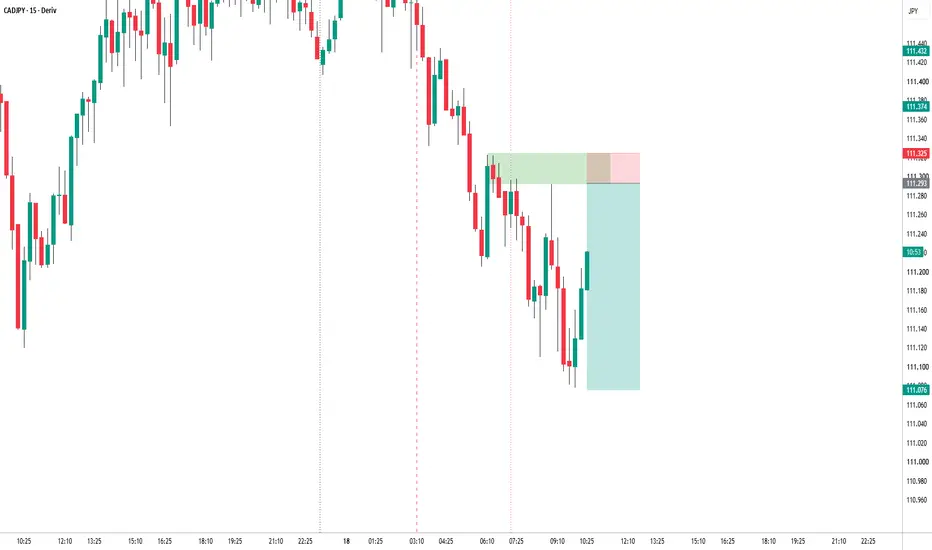
CADJPY: Bearish Continuation Setup | Broken SupportMarket Outlook
CADJPY is showing a clear bearish structure on the 30-minute chart. Price is trading below the declining EMA, indicating that sellers remain in control.
The previous support zone around 111.63–111.69 has been broken and is now acting as a potential resistance area. My expectation is a corrective pullback toward this zone, followed by renewed selling pressure and a continuation toward the lower support levels.
🔍 Setup Structure
Market Structure: Bearish trend with lower high
Canadian Dollar / Japanese Yen
No trades
No trades
In-depth trading ideas
CAD/JPY 4H: rising trendline breaks after a squeeze below 200EMA
Bias: short. Entry around 111.68 after the 4H candle closed below the rising trendline (16 Nov, 06:00 UTC close). Stop 112.18. Expected to play out over a few days to two weeks.
▸ Why I'm short
1. Rising trendline break. The line from the late-September low has been touched three or more times (1, 2, 3, 4 on the chart) and has held since then. This candle is the first 4H close below it.
2. Old resistance turned support is breaking too. 111.75 capped price through September and Octobe
CAD/JPY: Is the Loonie Losing the Battle? | Smart Money Trap?THE GREAT CADJPY HEIST — "LOONIE VS YEN" FOREX PROFIT PATHWAY 💴🍁
📉 OPERATION BEARISH BREAKDOWN | DAY/SWING TRADE SETUP
═════════════════════════════════════════════════════════════
🎯 LIVE MARKET SNAPSHOT — Updated: 16 November 2026 | London Time
💹 CAD/JPY (CADJPY) Current Price ➤ ~ 111.80 – 112.10 Zone
📊 Day Range ➤ 111.64 – 112.33
📅 52-Week Range ➤ 109.67 – 117.52
📉 Daily Change ➤ -0.09% to -0.23% (Bearish T
CADJPY - Bullish Trend Meets Strong Support!CADJPY has been overall bullish, trading within the rising broadening wedge pattern marked in blue.
However, following the recent bearish correction, price is now retesting an interesting area where multiple technical factors come together.
📊 Technical Outlook
CADJPY is approaching the lower boundary of its rising broadening wedge, which has been acting as dynamic support.
Moreover, this lower blue trendline intersects with a strong structure zone marked in green, around 111.40–111.60.
This
CADJPY H4 – Bullish Continuation from Key StructureCADJPY remains overall bullish, trading within an ascending channel. Price is currently pulling back towards a key structure zone where horizontal support aligns with the rising trendline. A successful retest and bullish confirmation could provide an opportunity to look for long positions towards the next resistance area.
CADJPY 4H – Lower highs, sell the rally into 112.10–112.25CADJPY has turned lower on the 4H, with lower highs (113.66 > 113.52 > 112.28) and lower lows (112.94 > 111.84 > 111.36), after topping near 113.66 last week. Price is below the daily 20/50/200 EMAs. The 112.10-112.25 area has repeatedly acted as resistance and lines up with the 4H 20 EMA, so the plan is to sell a rally into that zone.
Plan (sell limit on rally):
Entry: 112.10-112.25 (112.18)
Stop loss: 112.55
TP1: 111.35 (recent 4H low)
TP2: 110.95
Invalidation: a 4H close above 112.55.
Not f
Bearish drop off?CAD/JPY has rejected off the resistance level, which is a pullback resistance and could drop from this level to our take profit.
Entry: 112.18
Why we like it:
There is a pullback resistance level.
Stop loss: 112.86
Why we like it:
There is a pullback resistance level.
Take profit: 111.48
Why we like it:
There is an overlap support level that aligns with the 61.8% Fibonacci retracement.
Enjoying your TradingView experience? Review us!
Please be advised that the information presented on T
CADJPY 4H Sell IdeaOANDA:CADJPY has rallied into a significant Daily premium zone. Price has cleanly rejected from a higher-timeframe FVG and printed a CISD resistance level after sweeping into premium pricing.
Key Insights
✅ Rejection From Higher-Timeframe FVG
Price traded directly into the large overhead FVG around 112.70 - 112.90.
This zone aligns with previous imbalance and acted as a clear area of institutional supply.
The rally failed to sustain above the zone, leading to aggressive selling pres
Bullish bounce at overlap support?CAD/JPY is falling toward the pivot, which acts as a pullback support that aligns with the 61.8% Fibonacci retracement and could bounce toward the 1st resistance, which is a pullback resistance.
Pivot: 111.49
1st Support: 111.06
1st Resistance: 112.16
Disclaimer:
The opinions given above constitute general market commentary and do not constitute the opinion or advice of IC Markets or any form of personal or investment advice.
Any opinions, news, research, analyses, prices, other information
CAD/JPY Daily AnalysisCAD/JPY is testing descending channel resistance after a steady recovery from the October lows. Price is still capped by the upper trendline, while RSI has turned lower from near 60, suggesting momentum is cooling. A rejection here could send price back toward channel support, while a clean breakout would strengthen the bullish case.
CADJPY, A possible bullish reversal trend outlook$CADJPYY
4H Market Analysis 📊
🔻 Market Structure: The broader trend remains bearish, although recent price action suggests a potential shift in momentum following the marked MSS.
🔄 Double Bottom Formation: Price has established a potential double-bottom structure around the highlighted support zone, indicating possible exhaustion of selling pressure.
🛡️ Demand Reaction: The marked area is acting as a potential demand region, where buyers may attempt to defend the recent lows.
📈 Bullish Reve
CADJPY Will Go Down! Short!
Take a look at our analysis for CADJPY.
Time Frame: 4h
Current Trend: Bearish
Sentiment: Overbought (based on 7-period RSI)
Forecast: Bearish
The price is testing a key resistance 111.834.
Taking into consideration the current market trend & overbought RSI, chances will be high to see a bearish movement to the downside at least to 111.419 level.
P.S
We determine oversold/overbought condition with RSI indicator.
When it drops below 30 - the market is considered to be oversold.
When it bounce
CAD/JPY short after CA CPI and TakataCAD
CPI yesterday modestly disappointing, BOC latest hike due to containing energy prices spreading into economy - crude prices down on middle east tension softening,
JPY
BOJ in latest meeting acknowledging inflation target reached though Ueda left the door open to another hike in December + Takata calling for further hikes ahead of 1,5%, National-Core-CPI Friday expected 2,3% vs 2,1 previous
RISK
Middle East tensions picking up again, BOC´s Gravelle (neutral stance) on Wednesday coming in much
CADJPY Is Bullish! Buy!
Here is our detailed technical review for CADJPY.
Time Frame: 1h
Current Trend: Bullish
Sentiment: Oversold (based on 7-period RSI)
Forecast: Bullish
The market is approaching a significant support area 111.346.
The underlined horizontal cluster clearly indicates a highly probable bullish movement with target 111.715 level.
P.S
The term oversold refers to a condition where an asset has traded lower in price and has the potential for a price bounce.
Overbought refers to market scenarios w
Bearish drop off?CAD/JPY could rise toward the pivot, which has been identified as an overlap resistance, and could drop toward the pullback support.
Pivot: 111.49
1st Support: 110.78
1st Resistance: 112.16
Disclaimer:
The opinions given above constitute general market commentary and do not constitute the opinion or advice of IC Markets or any form of personal or investment advice.
Any opinions, news, research, analyses, prices, other information, or links to third-party sites contained on this website are
Falling towards pullback support?CAD/JPY is falling to the support level, which is a pullback support that is slightly above the 78.6% Fibonacci retracement and could bounce from this level to our take profit.
Entry: 111.45
Why we like it:
There is a pullback support level which is slightly above the 78.6% Fibonacci retracement.
Stop loss: 110.93
Why we like it:
There is a pullback support level.
Take profit: 112.16
Why we like it:
There is an overlap resistance level.
Enjoying your TradingView experience? Review us!
P
CADJPY Will Go Up From Support! Buy!
Take a look at our analysis for CADJPY.
Time Frame: 1h
Current Trend: Bullish
Sentiment: Oversold (based on 7-period RSI)
Forecast: Bullish
The market is on a crucial zone of demand 111.986.
The oversold market condition in a combination with key structure gives us a relatively strong bullish signal with goal 112.247 level.
P.S
We determine oversold/overbought condition with RSI indicator.
When it drops below 30 - the market is considered to be oversold.
When it bounces above 70 - the mark
CADJPY, is giving opportunity to join sell trendOANDA:CADJPY
1H Technical Analysis 📉
🔻 Market Structure: The overall structure remains bearish, supported by the previous downside Break of Structure (BoS).
🎯 Mitigation Zone: Price has retraced into the marked mitigation block, where selling pressure may re-emerge.
⚠️ Liquidity Context: Internal liquidity (IDM) has formed within the zone, creating potential conditions for a bearish reaction.
📉 Expected Direction: A rejection from the current zone could trigger another bearish expansion, a