CADJPY: Buyers Challenge the Resistance againCADJPY is looking quite interesting.
What we see so far is that price has been gradually curving higher, forming a rounded recovery. Now, it's back at this important resistance zone.
Price was rejected here recently, but this time, the pullback didn't last long, while being relatively smaller compared to the preceding one. Price has climbed all the way back to the same zone in a short amount of time, and that's a great clue too.
What's more, look at the latest candle. It's a full bul
Canadian Dollar / Japanese Yen
No trades
No trades
In-depth trading ideas
CADJPYThe liquidity above is untouched. The equal highs from October 20–22 (around 112.65–112.70) haven't been taken yet, and above them sit 112.97 and 113.46. That means the draw on liquidity is to the upside, so your target is a logical choice.
The new low is higher than the previous low, and the sweep of the low was followed by a quick reversal, which is a sign of sell-side absorption and a large buyer stepping in.
CADJPY: Back at the September Ceiling. Time to Sell?CADJPY has finally broken out of its three-week box.
Monday pushed through 111.80 and it's now trading around 112.50.
The problem for buyers? It's running straight into the September ceiling.
As always, I start top-down: weekly for the bigger picture, daily and 4H for the zone, then the 1H for the entry.
Weekly:
September was a big month. Price dropped from above 115.40 to 110.20 in a matter of weeks.
The monthly MACD crossed bearish in September, the first bearish cross since August 2024.
Potential bullish bounce?CAD/JPY is falling toward the pivot, which has been identified as a pullback support, and could bounce toward the pullback resistance.
Pivot: 111.22
1st Support: 110.78
1st Resistance: 111.75
Disclaimer:
The opinions given above constitute general market commentary and do not constitute the opinion or advice of IC Markets or any form of personal or investment advice.
Any opinions, news, research, analyses, prices, other information, or links to third-party sites contained on this website ar
Is a bullish move coming?CAD/JPY has bounced off the support level, which is a pullback support and could rise from this level to our take profit.
Entry: 111.22
Why we like it:
There is a pullback support level.
Stop loss: 110.66
Why we like it:
There is a pullback support level.
Take profit: 111.95
Why we like it:
There is a pullback resistance level.
Enjoying your TradingView experience? Review us!
Please be advised that the information presented on TradingView is provided to Vantage (‘Vantage Global Limited’
Bullish bounce in play?CAD/JPY has bounced off the support level, which is an overlap support and could potentially rise from this level to our take profit.
Entry: 111.89
Why we like it:
There is an overlap support level.
Stop loss: 111.50
Why we like it:
There is a pullback support level.
Take profit: 112.80
Why we like it:
There is a pullback resistance level.
Enjoying your TradingView experience? Review us!
Please be advised that the information presented on TradingView is provided to Vantage (‘Vantage Glo
Bullish bounce off pullback support?CAD/JPY is falling toward the pivot, which has been identified as a pullback support, and could bounce toward the 1st resistance, which acts as a pullback resistance.
Pivot: 112.53
1st Support: 111.52
1st Resistance: 113.37
Disclaimer:
The opinions given above constitute general market commentary and do not constitute the opinion or advice of IC Markets or any form of personal or investment advice.
Any opinions, news, research, analyses, prices, other information, or links to third-party si
CAD/JPY (CADJPY) – Bearish Setup | Target: 111.98 #66Price has rebounded from the 1 (100%) Resistance Arc, confirming that the Arc continues to act as a resistance boundary within the current Arc Cycle. Continued bearish momentum could drive price toward 111.98.
Conversely, a sustained 1h close above 112.50 would invalidate the bearish scenario and could reopen the path toward the next Resistance Arc.
CADJPY – Bearish Bat Completion CADJPY (1H) – Bearish Bat Completion
CADJPY has reached the 0.886 XA retracement near 112.615, completing a well-structured Bearish Bat pattern within a key resistance zone.
The Fibonacci ratios show strong harmonic alignment, while bearish RSI divergence suggests weakening bullish momentum.
Price is testing the upper resistance area, above the volume profile's primary high-volume region, making this a key zone to monitor for bearish rejection and a potential reversal toward value.
CADJPY Buy Trading Opportunity SpottedH1 - Strong bullish move.
No opposite signs.
Until the two Fibonacci support zones hold I expect the price to move higher further after pullbacks.
If you enjoy this idea, don’t forget to LIKE 👍, FOLLOW ✅, SHARE 🙌, and COMMENT ✍! Drop your thoughts and charts below to keep the discussion going. Your support helps keep this content free and reach more people! 🚀
-------------------------------------------------------------------------------------------------------
CAD/JPY Daily AnalysisCAD/JPY is showing a potential bullish divergence, with price making lower lows while the MACD histogram forms higher lows. Recent candles suggest buyers are beginning to regain control, pushing price back above 112.00. If momentum continues, 113.50 to 14.00 becomes the next area to watch, while a break back below recent support would weaken the bullish reversal case.
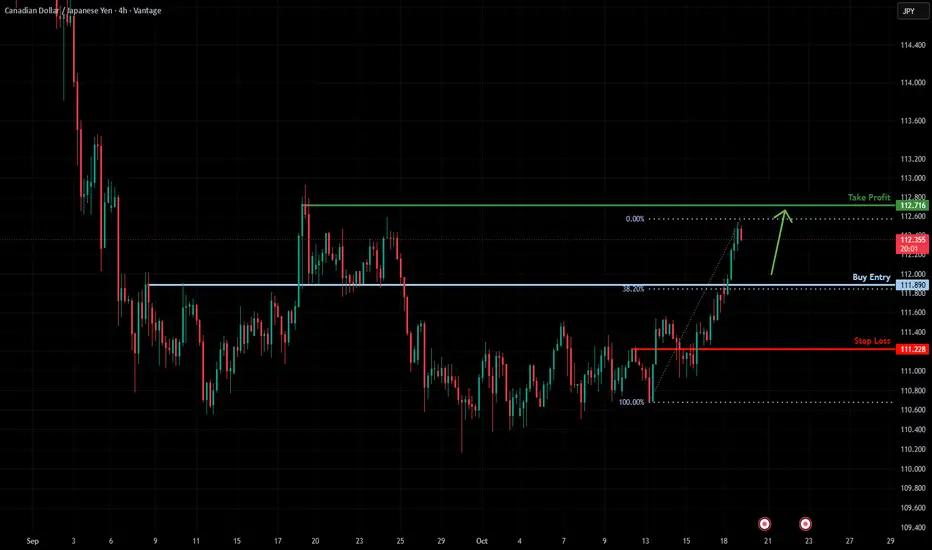
Bullish bounce setup?CAD/JPY is falling to the support level, which is an overlap support that aligns with the 38.2% Fibonacci retracement and could bounce from this level to our take profit.
Entry: 111.89
Why we like it:
There is an overlap support that aligns with the 38.2% Fibonacci retracement.
Stop loss: 111.22
Why we like it:
There is a pullback support level.
Take profit: 112.71
Why we like it:
There is a pullback resistance level.
Enjoying your TradingView experience? Review us!
Please be advised th
CAD/JPY 113.000 Vault Ahead? Breakout or Bull Trap!🏴☠️ CAD/JPY "CANADIAN DOLLAR VS JAPANESE YEN" | BANK WEALTH STRATEGY MAP 💰 | DAY & SWING TRADE
💴 Asset: CAD/JPY — Canadian Dollar vs Japanese Yen
📊 Market: Forex
⏳ Trading Style: Day Trade / Swing Trade
🧭 Strategy: Bank Wealth Strategy Map
📈 Technical Plan: Bullish Plan — Moving Average Breakout Confirmation
━━━━━━━━━━━━━━━━━━━━━━
🔥 MY ANALYSIS
CAD/JPY is currently trading around the 111.50–111.60 area, with price recently holding above the 111.00 region.
My technical framework is based on
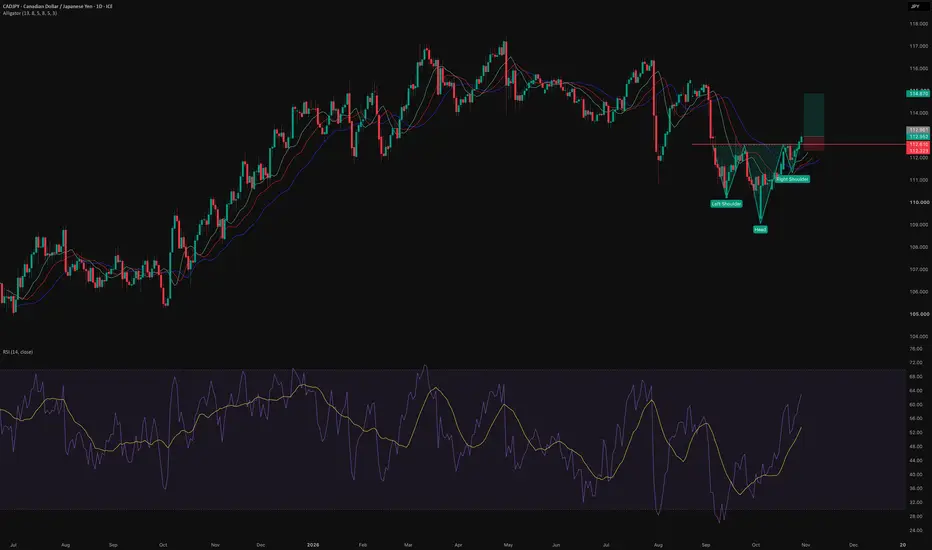
CADJPY Daily: Long SetupCADJPY has broken above the neckline of an inverted head and shoulders on the Daily timeframe. A bullish divergence into the head backs up the reversal.
Analysis:
Bullish divergence : Price made a lower low while the momentum oscillator made a higher low, which suggests selling pressure was fading.
Inverted head and shoulders : A classic bottoming pattern with a clear left shoulder, head and right shoulder.
Neckline breakout : Price has closed above the neckline, which confirms the pattern
CADJPY Is Bullish! Long!
Please, check our technical outlook for CADJPY.
Time Frame: 1h
Current Trend: Bullish
Sentiment: Oversold (based on 7-period RSI)
Forecast: Bullish
The market is approaching a significant support area 112.295.
The underlined horizontal cluster clearly indicates a highly probable bullish movement with target 112.555 level.
P.S
Please, note that an oversold/overbought condition can last for a long time, and therefore being oversold/overbought doesn't mean a price rally will come soon, or a
**CADJPY — Tracking the Footprints 🇨🇦**
Price continues to deliver toward the midterm highs, keeping the bullish continuation in focus.
I’m tracking a potential continuation add-on after the lower-timeframe internal inducement is taken to confirm the minor structure high, followed by a corrective move into the thin green lower-timeframe zone beneath price.
Until that distribution develops, I’m sitting on my hands and letting price come to me.
Once price reaches the zone, I’ll look for a candle-range shift and a lower-timeframe mar
CADJPY — Breakout Clears the Way for 113.50CADJPY is showing a clear shift after breaking above the 112.50–112.70 area. This zone had capped the upside several times before, with selling pressure appearing whenever price approached it. This time was different. Buyers absorbed the supply and pushed through the resistance with a decisive move.
What matters now is no longer the breakout itself, but how price behaves above it. CADJPY has already pushed close to 113.00, yet there has been no meaningful selling pressure strong enough to drag