CADSGD | Bearish Rejection Delivers +2R11.7
CADSGD has reached our planned profit target following the bearish reversal setup we identified earlier this month.
**TRADE RESULT: APPROXIMATELY +2R**
**THE SETUP**
We had been monitoring CADSGD since October 30 as price approached a significant Daily resistance zone around 0.9160–0.9190.
Several factors made this area particularly interesting:
**STRUCTURE**
- Price rallied into a well-established resistance zone.
- The Daily 200 EMA provided additional confluence.
- Strong bearish r
CANADIAN DOLLAR / SINGAPORE DOLLAR
No trades
No trades
In-depth trading ideas
CADSGD | Daily Update — Approaching Major Resistance | VMS 2.011.2
CADSGD continues to develop an interesting potential reversal setup on the Daily chart.
Following the strong bullish move from its recent lows, price is now approaching a significant resistance zone around **0.9165–0.9200**, where previous price structure and the 200 EMA provide additional confluence.
Daily momentum recently reached **+98**, demonstrating the strength of the advance. However, elevated momentum alone is not a sell signal.
**Here's what we're watching for next:**
1. Pric
CADSGD | Watching the All-Time Lows11.11
We're adding CADSGD back to our watchlist following the recent **+2R winning short trade** we shared.
This is an interesting example of how market conditions change and why we continually reassess structure, momentum, and price action.
**STRUCTURE — STRONG BEARISH IMPULSE**
Following rejection from the resistance zone around 0.9150–0.9190, CADSGD has produced a substantial bearish move.
Price is now approaching the historical low region around **0.8950–0.8980**, where a previous decli
CADSGD — WATCHING VERY CLOSELY! | VMS 2.0🔎 10.27
**What happens when price action, momentum, and a major resistance zone come together?**
That's exactly what we're watching on CADSGD!
We've been following this market for months, including a recent short trade that produced approximately **4.6R in profit** using our trailing stop strategy.
Now CADSGD is giving us another interesting situation.
📊 **FIRST, LOOK AT THE MOMENTUM!**
Back in July, momentum reached approximately **−93**.
In October, price made new lows, but momentum onl
CADSGD | All-Time Lows — Is a Bullish Reversal Developing?10.7.2026
CADSGD continues to trade near all-time lows following a prolonged bearish trend. We've been following this market for several weeks, and the latest Daily price action is beginning to show some interesting developments.
**DAILY STRUCTURE**
Price has extended into historically low territory, with both the 50 EMA and 200 EMA remaining above current price. The broader trend is clearly bearish, and there is no established historical support below the market.
However, the recent price a
CADSGD | Back at 21-Year LowsCADSGD is back on our VMS watchlist.
This is one of those areas that immediately gets our attention.
On the Daily chart, CADSGD is moving back into the major support zone we've been tracking around the 21-year lows. Price has reacted from this area before, and now we're coming back to test it again.
But reaching support is not enough for us to take a trade.
Our job now is to watch what price does when it gets there.
STRUCTURE → REJECTION → MOMENTUM → VOLUME → EXECUTE → MANAGE
The structure
CADSGD: Watching Closely at All-Time Lows📅 June 22, 2026
CADSGD continues to be one of the most interesting markets on my watchlist.
After breaking and closing below its all-time lows, price is now attempting to stabilize, and for the first time in a while, we're beginning to see signs that momentum may be shifting.
The Daily Momentum Indicator is currently sitting around **-95** and is beginning to show the early stages of a possible hook higher.
Price is also currently printing a bullish candle.
However, there are still some que
CADSGD Approaching a Critical Decision PointJune 12, 2026
CADSGD has moved into a very interesting location on the Daily chart.
Price is currently trading at approximately 21-year lows, making this one of the most extreme levels we have seen in quite some time.
At the moment, Daily momentum is very low and may be preparing to form the bullish "hook" that we look for within the VMS 2.0 framework.
However, we are not interested in predicting what happens next.
There are only two possibilities:
✔ Price rejects these historic lows and b
Using Fibonacci for Profit Targets | Reversal Example (VMS 2.0)Good morning,
One of the tools we use to help guide profit targets—especially in reversal trades—is Fibonacci.
In this CADSGD example, price reversed and moved into logical reaction zones based on Fibonacci retracement levels.
🔍 What we look for:
After a confirmed reversal setup, we use Fibonacci to identify:
38% level as an initial reaction zone
50% level as a secondary target
🧠 Important:
Fibonacci is not used on its own.
It works best when combined with:
Structure
Momentum
Volume
🎯 Ke
CADSGD – Patience Pays | VMS 2.0 SetupCADSGD is a great example of waiting for proper alignment.
We began watching this market earlier in the week, but no valid setup formed — so the idea was cancelled.
Yesterday, price developed a clean reversal at support and completed a full VMS 2.0 setup.
VMS 2.0 Breakdown:
1. S = STRUCTURE
Hammer reversal preceded by a month-long downtrend
Followed by a bullish engulfing candle
2. M = MOMENTUM
4H momentum is divergent and turning up
Daily momentum confirms the move to the upside
3. V =
CADSGD – Support Reaction | VMS 2.0 SetupCADSGD is currently reacting at a strong support level, where we are seeing multiple rejection candles.
This has developed into a valid VMS 2.0 setup:
Clear support with repeated rejection
4H momentum is divergent and pushing up
Daily momentum is low (-88) and hooking to the upside
Strong volume across lower timeframes (1H and 15M)
Structure is forming with an engulfing move and continued bullish candles, giving us a valid entry signal.
We have entered this trade based on alignment across ti
CADSGD is setting up a very clean pullback opportunity.Price has just completed the 4th leg and printed a strong engulfing candle at a prior swing high that was previously broken. That level is now acting as support, which adds confluence to the setup.
The 4th leg itself was a strong 3-day downtrend, suggesting exhaustion rather than continuation.
From a VMS perspective:
Momentum is deeply extended at -98 and is now hooking up
Volume confirmed on the 1H chart at 94
Structure + location + confirmation are all lining up
If you were paper trading
CADSGD – 4H Chart: Watching for 3rd Touch on Downtrend LineGood morning,
Price is approaching the 3rd bounce area of the downward trendline on the 4-hour chart — a key structure zone to watch.
At the moment, momentum is still pointing up, which means buyers are still showing strength.
Before we consider any short setups, we’ll need to see momentum flatten or start pointing down — ideally high and rolling over — to confirm potential continuation with the trend.
Only then will we drop to the 1H and 15M charts to look for VMS alignment and possible entr
CADSGD – Watching 4H Resistance ZoneCADSGD is sitting at a strong resistance zone on the 4H chart, where price has just printed multiple shooting star candles.
Current conditions:
✅ Momentum is elevated and could be turning down
✅ Structure shows rejection with SS candles
⏳ Still waiting for volume to push over 75
⏳ Need an engulfing candle to confirm intent
Until those final triggers align, this remains a watch — not a trade. Patience and discipline first.
⚠️ For educational purposes only. This is not financial advice.
#F
SGDCAD: Price Holds Above Daily HTLKey Observations
Daily Timeframe:
Price tested this daily HTL as resistance a few times. The last break was very strong.
After price reverted below this daily HTL, it did not make a new lower low. Instead, it traded above this level rather quickly.
Overall, this gives me an indication that selling pressure is weakening.
H1 Timeframe:
Price crossed below EMA20, but this was shortlived
As price exits the EMA band, this is an indication that momentum might pick up
Realistically, I mi
CAD/SGD — WatchlistPrice broke above resistance and is now pulling back to retest that zone as support. I’m watching for upside VMS alignment: Volume picking up, Momentum turning/holding higher, and a clean bullish engulfing off the retest.
If/Then (4H):
If we get bullish engulfing + improving V/M and price accepts above the engulfing mid/high while the retest holds as support, I’ll treat it as a valid continuation structure to study.
If price breaks back below the retest zone (former resistance), the trade is
CAD/SGD – Watchlist Update The recent break of structure wasn’t convincing enough for us to consider it a valid shift.
There was no strong momentum behind the move, and price failed to show commitment to the downside.
We’ll continue to watch for a more decisive break, followed by a clean pullback into resistance.
Only then will we begin evaluating the setup through the lens of the VMS strategy.
📌 No need to force it. Patience will always protect your edge.
CAD/SGD – Watching for Pullback Setup (4H Chart)
Price action is currently breaking through a strong support zone, which may now act as resistance.
From here, we’re watching to see if price continues lower and forms a clear structural pattern. If that happens, we’ll then look for a pullback into the newly formed resistance zone.
Only if we get that sequence in place will we begin applying the VMS criteria — Volume, Momentum, and Structure — to evaluate a possible trade.
📌 No setup yet. Just preparation and patience.
CAD/SGD – Setup WatchWe’re closely watching CAD/SGD for a potential pullback into a major resistance zone — a level that has proven to be super strong in recent history.
If price pulls back cleanly into that area and the VMS criteria align (Volume, Momentum, Structure), this could shape up to be a high-probability setup.
📌 No prediction here — just preparation.
We don’t chase trades. We wait for full alignment.
Keep an eye on this one — it’s on the radar.
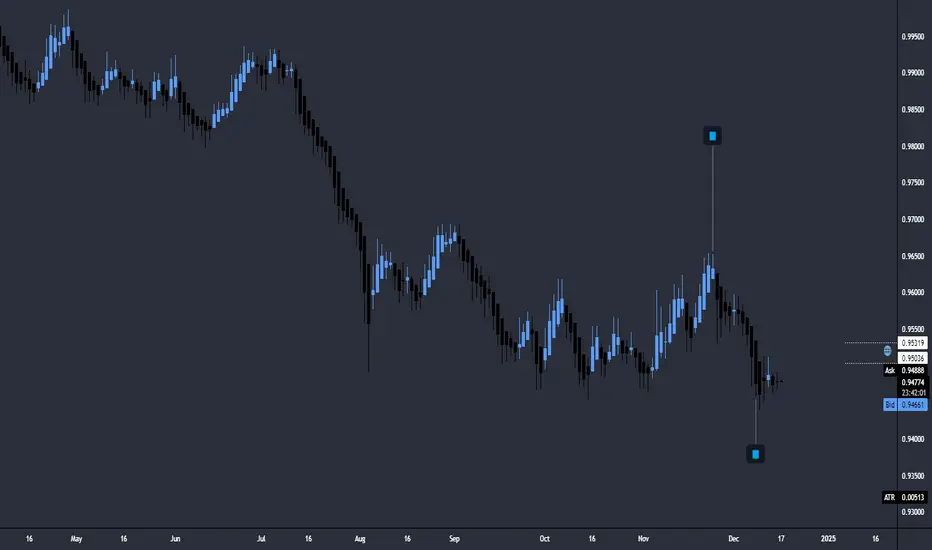
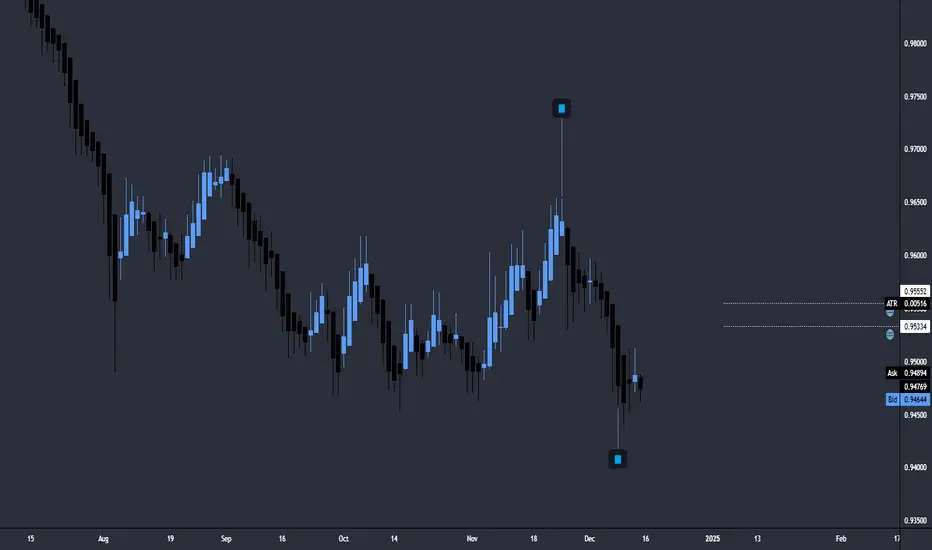
CAD/SGD SHORT Investment Opportunity
Hello everyone, I am Andrea Russo, a Forex Trader, and today I want to share with you a trading strategy that I am currently following on the CAD/SGD currency pair. This analysis is designed to help traders better understand the dynamics of this pair and optimize their trades.
CAD/SGD SHORT Position Analysis
I decided to enter a SHORT position on CAD/SGD at the level of 0.9460, with a profit target (Take Profit) set at 0.9405 and a stop loss at 0.9479. This setup was chosen after careful tech
CAD/Singapore Dollar ShortSingapore:Asia´s Switzerland getting stronger on China´s boosting industry and strong copper
Canada weaker because of Trump´s tariffs and weaker economy
Rockets: Entries
Yellow zone is not stop zone.It is the zone where I sell more:i COVER MY SELLS in thise zone.
Your stop should be based on your risk management decision taking