CAP — Key Market Structure After Strong ExpansionCAP — Key Market Structure After Strong Expansion | Breakout or Consolidation?
CAP is the native token of Cap, an Ethereum-based DeFi credit protocol designed to connect on-chain capital with real-world borrowers through a system of collateralized underwriters and financial guarantees. The protocol focuses on stablecoin yield and private credit infrastructure.
From a fundamental perspective, Cap reported $272M TVL and $41.9M in outstanding loans in Q2 2026, with active borrowers increasing 33%
Cap / Tether SPOT
No trades
No trades
In-depth trading ideas
CAP - Bulls Are Testing the Ceiling — Is a Breakout Coming?📊 Technical Analysis — EURONEXT:CAP
⏱️ Time Frame: 1D
💰 Current Area: Around $0.0740
🎯 Key Resistance: $0.0740 – $0.08857
🟡 Key Support: $0.07260
---
🔍 Chart Structure
📈 CAP/USDT is showing a strong recovery after forming a low around $0.01545. Since that bottom, price has gradually developed a structure of higher lows and higher highs.
🔥 After a strong bullish impulse from the lower levels, price is now trading directly below the $0.0740 resistance zone.
⚔️ This area is important because
CAPUSDT Forming Bullish MomentumCAPUSDT is forming a clear bullish momentum pattern, a classic bullish reversal signal that often indicates an upcoming breakout. The price has been consolidating within a narrowing range, suggesting that selling pressure is weakening while buyers are beginning to regain control. With consistent volume confirming accumulation at lower levels, the setup hints at a potential bullish breakout soon. The projected move could lead to an impressive gain of around 70% to 80% once the price breaks above
CAP — Accumulation + Institutional Credit Infrastructurehey hey !!!
CAP — Accumulation + Institutional Credit Infrastructure 🚀
CAP, the native token of Cap, is showing an interesting setup as a relatively compact accumulation structure begins to approach a potential breakout, with volume expanding during the latest move.
📊 Technical Structure
- Current price: ~$0.08653
- Immediate resistance: ~$0.08936
- Key resistance: ~$0.14362
- Major resistance: ~$0.20771
- Macro target: ~$0.27235
- Structural support: ~$0.04299
The chart shows a clear accumula
$CAP Ready for Downside Move?CSEMA:CAP is attempting to reclaim the ascending trendline after a recent breakdown. Price is now approaching the key resistance zone.
➤ Resistance: $0.07323
➤ Breakout confirmation: 8H close above $0.07323 + successful retest
➤ Supports: $0.04293 / $0.02533 / $0.01585
Chart View:
The broader structure remains constructive, but the breakdown has weakened short-term momentum. A confirmed reclaim could restore bullish continuation; rejection may send price back toward lower support.
Patience.
Trade Idea On CAPUSDTCap went down 29.23% to $0.0492 in 24h due to intense selling pressure and capitulation.
High-volume capitulation, with a 1,197% spike in trading volume to $51.8M, indicating a mass exit.
Also, these is Negative social sentiment labeling it a "loser" and broader altcoin weakness, though no clear coin-specific catalyst was visible.
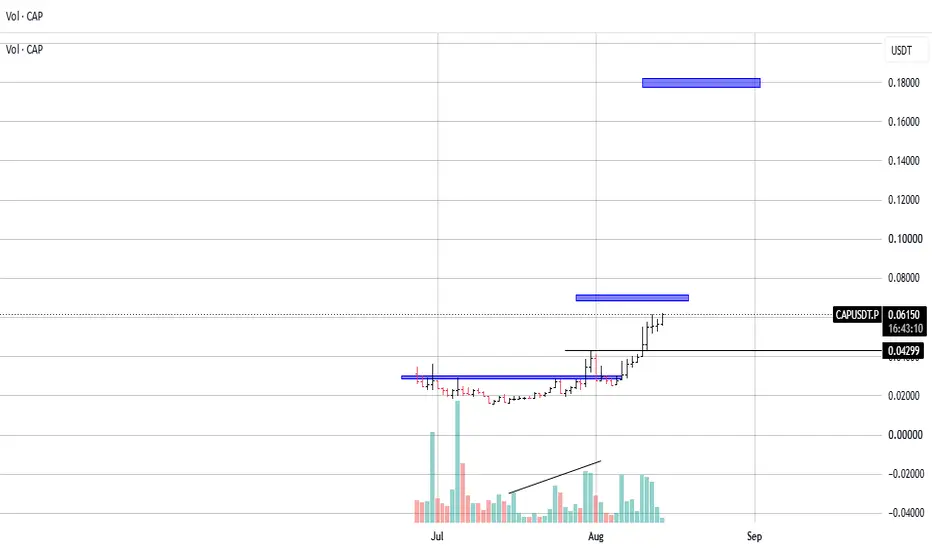
CAP — Technical BreakdownHey there how you all doing?
CAP — Technical Breakdown 🚀
CAP is starting to look very interesting after a long accumulation phase. The structure is gradually turning bullish, with price pushing toward the upper resistance area.
Current price: ~$0.061
Key breakout zone: ~$0.065–0.070. A clean break above this area could trigger the next leg higher.
First target: ~$0.075 — the immediate upside objective.
Major target: ~$0.18 — the larger resistance zone and potential medium-term target.
Suppor
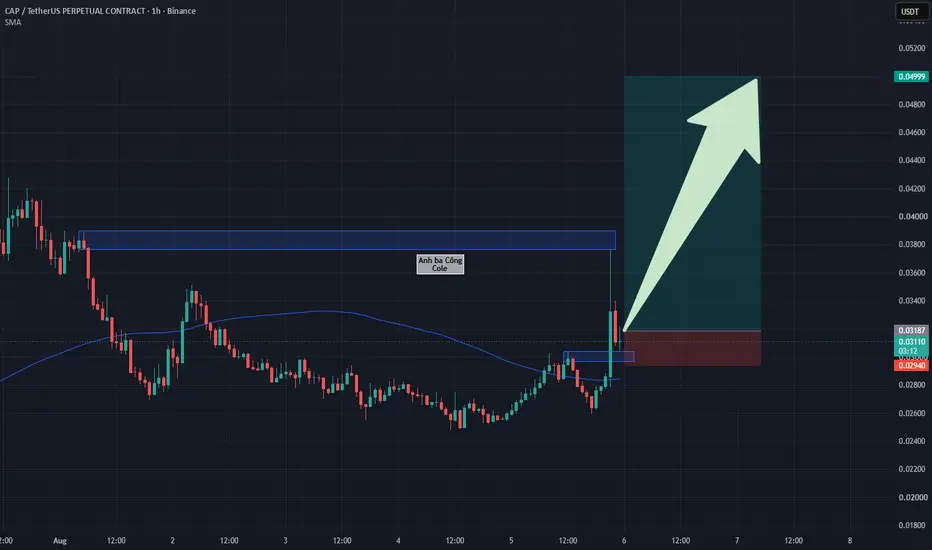
CAP: Successful Retest at $0.030 Support Floor CAP: Successful Retest at $0.030 Support Floor – Strategic Long Setup Targeting the $0.050 Milestone
CAP has officially launched an impressive breakout expansion wave, as aggressive buy orders cleanly pushed price action above the $0.030 resistance cluster to print a local high around $0.0375. Immediately after touching this ceiling, the price executed a technical pullback to retest the newly converted $0.030 support baseline, swiftly reacting with a bullish bounce. This cooling-off phase func
CAPUSDT.P: short setup from daily support at 0.01917BINANCE:CAPUSDT.P has spent quite a long time in accumulation above the historical low. Every day, each high gets lower and lower, which indicates buyer weakness.
Yesterday's daily bar closing right near the level is a signal of an imminent probable breakout. We just tested the level with a false breakout, and now we need to watch if there will be a bounce, or if we can soon open a short below the level.