CATIUSDT Forming Bullish MomentumCATIUSDT is forming a clear bullish momentum pattern, a classic bullish wave signal that often indicates an upcoming breakout. The price has been consolidating within a narrowing range, suggesting that selling pressure is weakening while buyers are beginning to regain control. With consistent volume
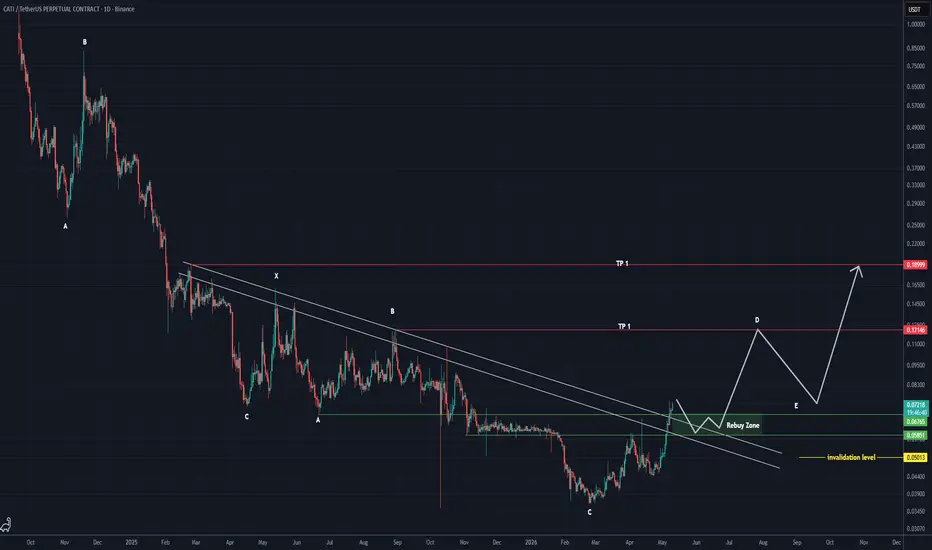
CATI shows signs of a completed long-term correction (1D)Before entering a position, first understand that this is a highly volatile and risky meme coin, so proper risk management is essential. Secondly, try to identify optimal entry points and wait for a pullback before entering.
It seems that a long-term correction in the cryptocurrency CATI has come t
CATIUSDT Forming Bullish MomentumCATIUSDT is forming a clear bullish momentum pattern, a classic bullish wave signal that often indicates an upcoming breakout. The price has been consolidating within a narrowing range, suggesting that selling pressure is weakening while buyers are beginning to regain control. With consistent volume
Catizen: Bottom recovery complete + full green candle (PP: 387%)The exact same fractal as the rest of the altcoins market. There is first a crash that happened October 2025... I shall spare you the details.
Catizen—CATIUSDT—is confirming today a full bottom recovery. The chart shows the inverted head and shoulders (iH&S) pattern, a classic reversal signal, as w
$CATI – Strong Bounce from BuyersBINANCE:CATIUSDT
ECONOMICS:CATI – Strong Bounce from Buyers Fair Value Gap #46 on 4H Chart 🚀🐾
🐂 Buyers defending key demand zone with conviction
After a multi-week corrective pullback from the March highs near 0.0490–0.0500, price delivered a clean impulsive drop straight into the prominent B
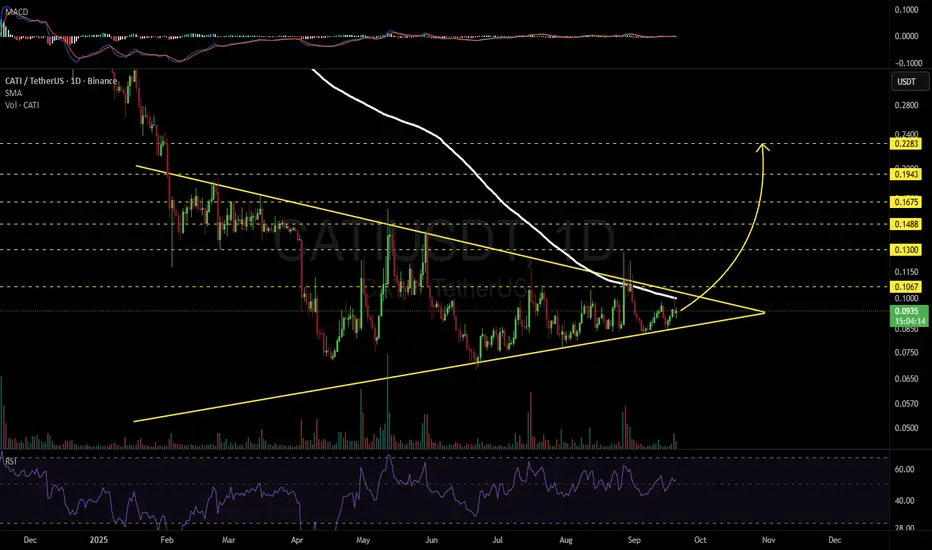
CATIUSDT 1D#CATI is moving inside a symmetrical triangle on the daily chart. In case of a breakout above the triangle resistance and the daily SMA200, the potential targets are:
🎯 $0.1067
🎯 $0.1300
🎯 $0.1488
🎯 $0.1675
🎯 $0.1943
🎯 $0.2283
⚠️ Always remember to use a tight stop-loss and follow proper risk mana
CATI/USDT — Critical Zone: Make or Break MomentCurrently, CATI/USDT is trading around $0.086, right on the major support zone at $0.07–$0.09, which has been tested multiple times since May 2025. This area acts as a strong demand zone / accumulation base, and it may soon decide whether we see a reversal or a breakdown continuation.
---
🔎 Techni
CATI Memcoin. Main (essentially secondary) trend. Channel. 25 05Logarithm. Time frame 3 days (less is not necessary). Decline from the maximum -94%. As a rule, altcoins (ticker name, legend, imitation of usefulness does not matter) of such liquidity decline in their secondary trend until its reversal by -95-98%.
But, at the moment, there is a significant increa
See all ideas
Summarizing what the indicators are suggesting.
Oscillators
Neutral
SellBuy
Strong sellStrong buy
Strong sellSellNeutralBuyStrong buy
Oscillators
Neutral
SellBuy
Strong sellStrong buy
Strong sellSellNeutralBuyStrong buy
Summary
Neutral
SellBuy
Strong sellStrong buy
Strong sellSellNeutralBuyStrong buy
Summary
Neutral
SellBuy
Strong sellStrong buy
Strong sellSellNeutralBuyStrong buy
Summary
Neutral
SellBuy
Strong sellStrong buy
Strong sellSellNeutralBuyStrong buy
Moving Averages
Neutral
SellBuy
Strong sellStrong buy
Strong sellSellNeutralBuyStrong buy
Moving Averages
Neutral
SellBuy
Strong sellStrong buy
Strong sellSellNeutralBuyStrong buy
Displays a symbol's price movements over previous years to identify recurring trends.