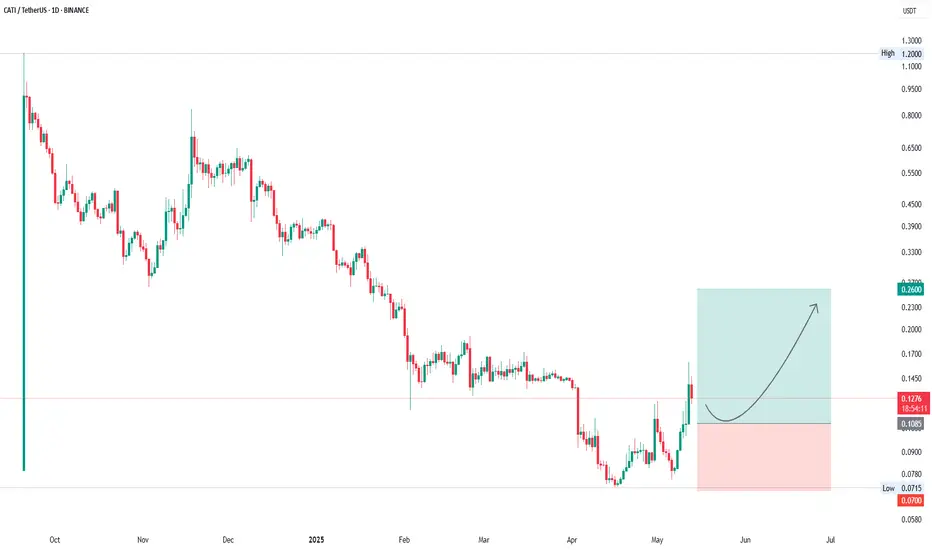
CATIUSDT Forming Bullish MomentumCATIUSDT is forming a clear bullish momentum pattern, a classic bullish wave signal that often indicates an upcoming breakout. The price has been consolidating within a narrowing range, suggesting that selling pressure is weakening while buyers are beginning to regain control. With consistent volume confirming accumulation at lower levels, the setup hints at a potential bullish breakout soon. The projected move could lead to an impressive gain of around 50% to 60% once the price breaks above the wedge resistance.
This bullish momentum pattern is typically seen at the end of downtrends or corrective phases, and it represents a potential shift in market sentiment from bearish to bullish. Traders closely watching CATIUSDT are noting the strengthening momentum as it nears a breakout zone. Strong trading volume adds confidence to this pattern, showing that market participants are positioning early in anticipation of a reversal.
Investorsโ growing interest in CATIUSDT reflects rising confidence in the projectโs long-term fundamentals and current technical strength. If the breakout confirms with sustained volume, this could mark the start of a fresh bullish leg. Traders may find this a valuable setup for medium-term gains, especially as the pattern completes and buying momentum accelerates.
โ
Show your support by hitting the like button
โ
Leaving a comment below! (What is your opinion about this coin?)
Your feedback and engagement keep me inspired to share more insightful market analysis with you!
In-depth trading ideas
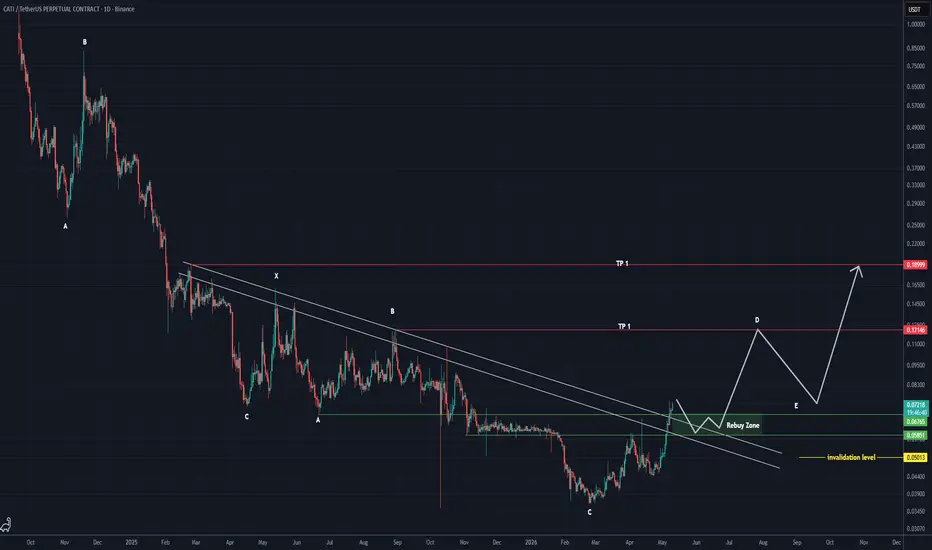
๏ปฟCATI shows signs of a completed long-term correction (1D)Before entering a position, first understand that this is a highly volatile and risky meme coin, so proper risk management is essential. Secondly, try to identify optimal entry points and wait for a pullback before entering.
It seems that a long-term correction in the cryptocurrency CATI has come to an end. A major trendline has been broken, and both momentum and volume look strong.
It also appears that this correction has taken the form of a double correction.
Enter within the accumulation zone using a DCA (Dollar Cost Averaging) strategy.
The targets are marked on the chart. Take partial profits at the first target, and then re-enter with proper risk management for the second target during subsequent pullbacks.
If you have a coin or altcoin you want analyzed, first hit the like button and then comment its name so I can review it for you.
Do you also think CATI is bullish?
CATIUSDT Forming Bullish MomentumCATIUSDT is forming a clear bullish momentum pattern, a classic bullish wave signal that often indicates an upcoming breakout. The price has been consolidating within a narrowing range, suggesting that selling pressure is weakening while buyers are beginning to regain control. With consistent volume confirming accumulation at lower levels, the setup hints at a potential bullish breakout soon. The projected move could lead to an impressive gain of around 40% to 50% once the price breaks above the wedge resistance.
This bullish momentum pattern is typically seen at the end of downtrends or corrective phases, and it represents a potential shift in market sentiment from bearish to bullish. Traders closely watching CATIUSDT are noting the strengthening momentum as it nears a breakout zone. The good trading volume adds confidence to this pattern, showing that market participants are positioning early in anticipation of a reversal.
Investorsโ growing interest in CATIUSDT reflects rising confidence in the projectโs long-term fundamentals and current technical strength. If the breakout confirms with sustained volume, this could mark the start of a fresh bullish leg. Traders might find this a valuable setup for medium-term gains, especially as the wedge pattern completes and buying momentum accelerates.
โ
Show your support by hitting the like button and
โ
Leaving a comment below! (What is your opinion about this coin?)
Your feedback and engagement keep me inspired to share more insightful market analysis with you!
Catizen: Bottom recovery complete + full green candle (PP: 387%)The exact same fractal as the rest of the altcoins market. There is first a crash that happened October 2025... I shall spare you the details.
CatizenโCATIUSDTโis confirming today a full bottom recovery. The chart shows the inverted head and shoulders (iH&S) pattern, a classic reversal signal, as well as a full green candle today. This is after the action remains neutral-sideways for months at bottom prices.
While CATIUSDT was moving lower, it never moved below the October 2025 low. This is what confirms the action happened at the accumulation zone for five months. And it is turning bullish confirmed.
The full green candle today reached a higher high, the highest price since early February. It also confirms the iH&S pattern as a bottom reversal signal. There is maximum room available for growth, because we are looking at a true bottom.
I am highlighting mainly two targets on the chart. 174% & 387%. Pick the one you like, the bullish bias is already confirmed. The only question that remains open; how long will it take?
Thank you for reading.
Namaste.
$CATI โ Strong Bounce from BuyersBINANCE:CATIUSDT
ECONOMICS:CATI โ Strong Bounce from Buyers Fair Value Gap #46 on 4H Chart ๐๐พ
๐ Buyers defending key demand zone with conviction
After a multi-week corrective pullback from the March highs near 0.0490โ0.0500, price delivered a clean impulsive drop straight into the prominent Buyers Fair Value Gap #46 (0.0421 โ 0.0437) โ a high-probability area of previous buy-side imbalance and resting demand liquidity.
The latest candles show aggressive rejection from inside this gap:
- Strong bullish engulfing / long lower wick candle at the lower boundary
- Immediate strong green follow-through pushing price back above 0.0438
- Price now trading above the FVG zone with momentum shifting to the upside
Current structure highlights:
- Clear higher low formed right at the FVG
- Series of higher highs developing on the recovery
- Price reclaiming short-term structure and showing early signs of bullish control
๐ฏ Key levels & high-probability scenarios:
- Primary support / defended zone โ 0.0421 โ 0.0437 (inside Buyers FVG #46)
โ Successfully held โ acts as new short-term floor
- If bulls maintain control above the FVG โ Next upside targets open toward 0.0460 โ 0.0475 (previous swing area & 50% retracement zone) โ ideal for continuation longs on pullbacks to the gap
- If rejection appears near 0.0450โ0.0460 โ Healthy retest of the broken FVG from above would be technically bullish and offer excellent long re-entry opportunities with tight risk below the gap
โ ๏ธ As long as price holds above the Buyers FVG #46 and we continue seeing higher lows, the path of least resistance is higher. Watch for any clean break back below 0.0420 to invalidate the current bullish recovery.
Patience. Discipline. Structure over emotion โ always.
#CATI #CATIUSDT #Catizen #MemeCoins #Crypto #BullishBounce #FairValueGap #SmartWedge #TradingView #Binance #CryptoTrading #SmartWedgeTrader
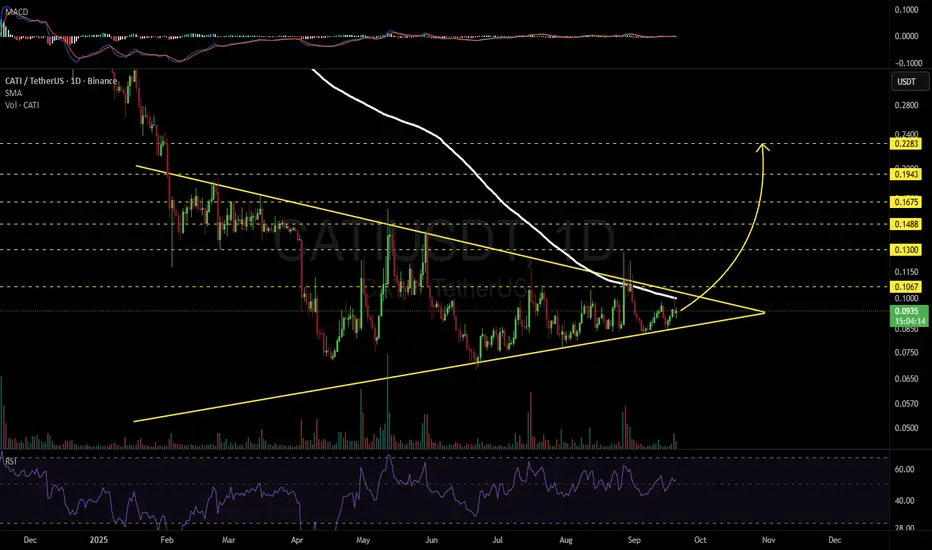
CATIUSDT 1D#CATI is moving inside a symmetrical triangle on the daily chart. In case of a breakout above the triangle resistance and the daily SMA200, the potential targets are:
๐ฏ $0.1067
๐ฏ $0.1300
๐ฏ $0.1488
๐ฏ $0.1675
๐ฏ $0.1943
๐ฏ $0.2283
โ ๏ธ Always remember to use a tight stop-loss and follow proper risk management.
CATI/USDT โ Critical Zone: Make or Break MomentCurrently, CATI/USDT is trading around $0.086, right on the major support zone at $0.07โ$0.09, which has been tested multiple times since May 2025. This area acts as a strong demand zone / accumulation base, and it may soon decide whether we see a reversal or a breakdown continuation.
---
๐ Technical Analysis
1. Macro Trend:
From the peak near $0.91, the market has been in a strong downtrend.
Since May, however, the downward momentum has slowed, forming a sideways structure.
2. Price Structure & Pattern:
Price has been consolidating between $0.07โ$0.11 for months.
A potential double bottom is forming with a neckline at $0.1115 โ a breakout above this level could trigger a significant rally.
Multiple wick rejections at the lower bound highlight buying pressure around the demand zone.
3. Key Levels:
Major Support Zone: $0.07โ$0.09
Nearest Resistance / Neckline: $0.1115
Next Resistance Levels: $0.139 โ $0.183 โ $0.278
Long-term Resistances: $0.401 โ $0.519 โ $0.711 โ $0.914
---
๐ข Bullish Scenario
Confirmation: Daily close above $0.1115 with strong volume.
Short-term target: $0.139
Next targets: $0.183 โ $0.278
Pattern projection: Double bottom breakout points toward ~$0.15 as a conservative measured move.
---
๐ด Bearish Scenario
Confirmation: Daily close below $0.07, breaking down the demand zone.
Target: $0.05โ$0.06 as the next downside support.
Continuation: If the breakdown is confirmed with a failed retest, the broader downtrend is likely to resume.
---
๐ Conclusion
CATI is at a make-or-break zone.
Holding the $0.07โ$0.09 base and breaking above $0.1115 could signal a trend reversal toward $0.139โ$0.183.
Failure to defend $0.07 opens the door to a deeper bearish continuation.
Traders should be cautious of false breakouts / breakdowns and watch for daily close + volume confirmation.
---
#CATI #CATIUSDT #Crypto #Altcoin #TechnicalAnalysis #PriceAction #SupportResistance #Breakout #Accumulation
CATI Memcoin. Main (essentially secondary) trend. Channel. 25 05Logarithm. Time frame 3 days (less is not necessary). Decline from the maximum -94%. As a rule, altcoins (ticker name, legend, imitation of usefulness does not matter) of such liquidity decline in their secondary trend until its reversal by -95-98%.
But, at the moment, there is a significant increase in volume, this is a good sign, if the price goes beyond the resistance of the descending channel, then a trend expanding triangle will form, or as it is also called the Livermore cylinder (dynamic zones of support / resistance of the "participation" phase).
In order not to miss the reversal, if you are afraid to gain a position now, then work with orders for a breakthrough, that is, a trend break.
๐ฃFor 2 months now, a sideways trend with a 100% step, the price is being pulled to the resistance of the descending channel.
Breakthrough of it โ trend reversal.
Not a breakthrough , decline to the next "shelf".
Everything is quite simple and logical. All levels and zones of potential minimums and maximums are shown. Remember, the average price of the set and reset is important. The key resistance zone after the reversal, where you will need to dump most of the position, or everything, is highlighted in gray.
CATIUSDT Forming Bullish PennantCATIUSDT is currently forming a bullish pennant pattern, a continuation setup that often signals the potential for a strong upward breakout. After a sharp rally, the market has consolidated within converging trendlines, creating the pennant formation. This shows that buyers are holding the ground firmly while sellers are losing strength, making way for the next possible impulsive move. The good trading volume further confirms that there is steady accumulation happening within this range.
If CATIUSDT breaks out of this pennant with strong momentum, the price could see significant upside, with gains expected in the range of 50% to 60%+. Such patterns often act as launching pads for extended rallies, particularly when backed by strong investor sentiment and consistent trading volume. The setup highlights that market participants are preparing for the next leg upward, reflecting growing confidence in the project.
The combination of technical structure and healthy market activity makes CATIUSDT an attractive setup to monitor closely. With increasing investor interest, this bullish pennant could turn into a key breakout opportunity for traders aiming to capitalize on short to medium-term price movements.
โ
Show your support by hitting the like button and
โ
Leaving a comment below! (What is You opinion about this Coin)
Your feedback and engagement keep me inspired to share more insightful market analysis with you!
CATI/USDT โ Massive Descending Trendline Breakout?๐ Overview:
CATI/USDT is flashing a major trend reversal signal after months of accumulation and suppression under a dominant descending trendline. For the first time in almost 10 months, price action has successfully broken out of the downtrend, potentially setting the stage for a multi-layered bullish rally.
This breakout is not just a technical level โ itโs a psychological shift from bearish to bullish sentiment. The consolidation zone between $0.065โ$0.085 has acted as a solid accumulation base, and the breakout past $0.10 marks the beginning of a new phase.
๐ Chart Pattern Explanation:
๐ป Descending Triangle Breakout
Structure: Long-term lower highs with a flat support base.
Breakout Point: Around $0.1029, breaking the descending trendline cleanly.
Volume: A potential rise in volume post-breakout would confirm the breakoutโs strength.
Target projection: Based on the height of the triangle, the potential move could extend above 200%.
This pattern is often seen at the end of a downtrend and signals a strong bullish reversal, especially when paired with horizontal accumulation like we see here.
๐ Bullish Scenario โ Road to Potential 8x Gains:
If the breakout holds and gains momentum:
โ
First Target: $0.13914 โ Previous local resistance.
โ
Second Target: $0.18314 โ Strong resistance cluster zone.
โ
Third Target: $0.27880 โ Clean psychological and structural target.
โ
Mid-term Target: $0.40108 to $0.51945 โ Major Fibonacci level and previous breakdown area.
โ
Moon Target: $0.71191 to $0.91459 โ If trend extends with volume and market-wide bullishness.
These targets are based on measured move projections, Fibonacci extensions, and historical price memory.
โ ๏ธ Bearish Scenario โ What Could Invalidate the Breakout?
โ False breakout risk if price falls back below $0.095.
โ A rejection candle or long wick at $0.13โ$0.14 without volume could signal exhaustion.
โ If Bitcoin or broader market faces correction, CATI might retrace to its base at $0.065 or even revisit $0.051.
Traders should watch for bearish divergence or sudden drop in volume as early warnings of reversal.
๐ง Strategic Notes:
Entry zone: Retest of breakout at $0.095โ$0.102 could provide a low-risk entry.
Stop loss: Below $0.085 for conservative risk management.
Position sizing: Scale in during pullbacks. Donโt ape in full at resistance levels.
This setup has the classic ingredients of a low-cap altcoin explosion if momentum sustains.
๐ฅ Final Thoughts:
CATI/USDT is breaking free from its bearish chains and entering what could be the early stages of a parabolic move. With a textbook breakout pattern, clean structure, and well-defined levels โ this is one of those charts traders dream of spotting early.
Keep your eyes on volume and structure โ this could be one of the hidden gems of this cycle.
#CATIUSDT #CryptoBreakout #AltcoinGems #TechnicalAnalysis #BullishSetup #CryptoTrading #PriceAction #DescendingTriangle #BreakoutPlay #ReversalPattern
CATIUSDT 1D#CATI has formed a Descending Broadening Wedge pattern on the daily chart โ a potential bullish setup. ๐
๐ Buy Zone:
Between $0.1141 and $0.0978
(Daily MA50 and EMA50 are providing strong support in this range.)
If a breakout occurs above the wedge resistance, the upside targets are:
๐ฏ $0.1403
๐ฏ $0.1590
๐ฏ $0.1828
๐ฏ $0.2070
๐ฏ $0.2389
๐ฏ $0.2844
๐ฏ $0.3423
โ ๏ธ Use a tight stop-loss to manage risk and protect your capital.
CATIUSDT - NO BUYERS!!??Observing CATIUSDT, one might initially perceive a landscape where all indicators point towards an ascent. Indeed, the superficial appearance suggests a market poised for higher valuations. However, a discerning investor must always ask the fundamental question: where are the buyers? This critical element, the genuine influx of demand, appears conspicuously absent.
Despite what might seem like an elevated price, there is a distinct possibility that the blue box I've identified on the chart could be subject to manipulation. This zone, which might otherwise appear as a resistance level, could be used to draw in unwary participants before a more significant move downwards. My current assessment leads me to believe that, following such a potential manipulation, the ultimate target for CATIUSDT's price is indeed lower. The absence of robust buying conviction, despite the seemingly favorable conditions, strongly reinforces this cautious outlook.
In evaluating such scenarios, it is imperative to scrutinize the volume footprint for any signs of artificial strength or distribution. We would look for CDV (Cumulative Delta Volume) divergences that betray the true underlying sentiment, and patiently await low timeframe (LTF) confirmations which, in this instance, would likely validate a bearish thesis rather than a bullish one. One must be particularly vigilant for liquidity hunts, where price might briefly push into or beyond the blue box only to swiftly reverse.
It is worth reiterating that my focus remains exclusively on assets demonstrating a sudden and significant increase in volume, as such movements often precede more substantial price action. The current state of CATIUSDT, lacking this decisive and authentic buying pressure, necessitates a stance of extreme prudence.
Therefore, while the market may present an illusion of impending rise, the intelligent investor remains grounded in the observable facts. The absence of genuine buying activity, coupled with the potential for manipulation around this blue box, suggests that caution is the most appropriate course. One must be prepared for the possibility that the path of least resistance for CATIUSDT is, regrettably, to the downside.
๐I keep my charts clean and simple because I believe clarity leads to better decisions.
๐My approach is built on years of experience and a solid track record. I donโt claim to know it all but Iโm confident in my ability to spot high-probability setups.
๐If you would like to learn how to use the heatmap, cumulative volume delta and volume footprint techniques that I use below to determine very accurate demand regions, you can send me a private message. I help anyone who wants it completely free of charge.
๐I have a long list of my proven technique below:
๐ฏ ZENUSDT.P: Patience & Profitability | %230 Reaction from the Sniper Entry
๐ถ DOGEUSDT.P: Next Move
๐จ RENDERUSDT.P: Opportunity of the Month
๐ ETHUSDT.P: Where to Retrace
๐ข BNBUSDT.P: Potential Surge
๐ BTC Dominance: Reaction Zone
๐ WAVESUSDT.P: Demand Zone Potential
๐ฃ UNIUSDT.P: Long-Term Trade
๐ต XRPUSDT.P: Entry Zones
๐ LINKUSDT.P: Follow The River
๐ BTCUSDT.P: Two Key Demand Zones
๐ฉ POLUSDT: Bullish Momentum
๐ PENDLEUSDT.P: Where Opportunity Meets Precision
๐ฅ BTCUSDT.P: Liquidation of Highly Leveraged Longs
๐ SOLUSDT.P: SOL's Dip - Your Opportunity
๐ธ 1000PEPEUSDT.P: Prime Bounce Zone Unlocked
๐ ETHUSDT.P: Set to Explode - Don't Miss This Game Changer
๐ค IQUSDT: Smart Plan
โก๏ธ PONDUSDT: A Trade Not Taken Is Better Than a Losing One
๐ผ STMXUSDT: 2 Buying Areas
๐ข TURBOUSDT: Buy Zones and Buyer Presence
๐ ICPUSDT.P: Massive Upside Potential | Check the Trade Update For Seeing Results
๐ IDEXUSDT: Spot Buy Area | %26 Profit if You Trade with MSB
๐ USUALUSDT: Buyers Are Active + %70 Profit in Total
๐ FORTHUSDT: Sniper Entry +%26 Reaction
๐ณ QKCUSDT: Sniper Entry +%57 Reaction
๐ BTC.D: Retest of Key Area Highly Likely
๐ XNOUSDT %80 Reaction with a Simple Blue Box!
๐ BELUSDT Amazing %120 Reaction!
๐ Simple Red Box, Extraordinary Results
๐ TIAUSDT | Still No BuyersโMaintaining a Bearish Outlook
๐ OGNUSDT | One of Todayโs Highest Volume Gainers โ +32.44%
I stopped adding to the list because it's kinda tiring to add 5-10 charts in every move but you can check my profile and see that it goes on..
CATI/USDTKey Level Zone: 0.1150 - 0.1180
HMT v8.1 detected. The setup looks promising, supported by a previous upward/downward trend with increasing volume and momentum, presenting an excellent reward-to-risk opportunity.
HMT (High Momentum Trending):
HMT is based on trend, momentum, volume, and market structure across multiple timeframes. It highlights setups with strong potential for upward movement and higher rewards.
Whenever I spot a signal for my own trading, Iโll share it. Please note that conducting a comprehensive analysis on a single timeframe chart can be quite challenging and sometimes confusing. I appreciate your understanding of the effort involved.
Important Note :
Role of Key Levels:
- These zones are critical for analyzing price trends. If the key level zone holds, the price may continue trending in the expected direction. However, momentum may increase or decrease based on subsequent patterns.
- Breakouts: If the key level zone breaks, it signals a stop-out. For reversal traders, this presents an opportunity to consider switching direction, as the price often retests these zones, which may act as strong support-turned-resistance (or vice versa).
My Trading Rules
Risk Management
- Maximum risk per trade: 2.5%.
- Leverage: 5x.
Exit Strategy
Profit-Taking:
- Sell at least 70% on the 3rd wave up (LTF Wave 5).
- Typically, sell 50% during a high-volume spike.
- Adjust stop-loss to breakeven once the trade achieves a 1.5:1 reward-to-risk ratio.
- If the market shows signs of losing momentum or divergence, ill will exit at breakeven.
The market is highly dynamic and constantly changing. HMT signals and target profit (TP) levels are based on the current price and movement, but market conditions can shift instantly, so it is crucial to remain adaptable and follow the market's movement.
If you find this signal/analysis meaningful, kindly like and share it.
Thank you for your support~
Sharing this with love!
HMT v2.0:
- Major update to the Momentum indicator
- Reduced false signals from inaccurate momentum detection
- New screener with improved accuracy and fewer signals
HMT v3.0:
- Added liquidity factor to enhance trend continuation
- Improved potential for momentum-based plays
- Increased winning probability by reducing entries during peaks
HMT v3.1:
- Enhanced entry confirmation for improved reward-to-risk ratios
HMT v4.0:
- Incorporated buying and selling pressure in lower timeframes to enhance the probability of trending moves while optimizing entry timing and scaling
HMT v4.1:
- Enhanced take-profit (TP) target by incorporating market structure analysis
HMT v5 :
Date: 23/01/2025
- Refined wave analysis for trending conditions
- Incorporated lower timeframe (LTF) momentum to strengthen trend reliability
- Re-aligned and re-balanced entry conditions for improved accuracy
HMT v6 :
Date : 15/02/2025
- Integrated strong accumulation activity into in-depth wave analysis
HMT v7 :
Date : 20/03/2025
- Refined wave analysis along with accumulation and market sentiment
HMT v8 :
Date : 16/04/2025
- Fully restructured strategy logic
HMT v8.1 :
Date : 18/04/2025
- Refined Take Profit (TP) logic to be more conservative for improved win consistency
CATI/USDTKey Level Zone: 0.0825 - 0.0840
HMT v8.1 detected. The setup looks promising, supported by a previous upward/downward trend with increasing volume and momentum, presenting an excellent reward-to-risk opportunity.
HMT (High Momentum Trending):
HMT is based on trend, momentum, volume, and market structure across multiple timeframes. It highlights setups with strong potential for upward movement and higher rewards.
Whenever I spot a signal for my own trading, Iโll share it. Please note that conducting a comprehensive analysis on a single timeframe chart can be quite challenging and sometimes confusing. I appreciate your understanding of the effort involved.
Important Note :
Role of Key Levels:
- These zones are critical for analyzing price trends. If the key level zone holds, the price may continue trending in the expected direction. However, momentum may increase or decrease based on subsequent patterns.
- Breakouts: If the key level zone breaks, it signals a stop-out. For reversal traders, this presents an opportunity to consider switching direction, as the price often retests these zones, which may act as strong support-turned-resistance (or vice versa).
My Trading Rules
Risk Management
- Maximum risk per trade: 2.5%.
- Leverage: 5x.
Exit Strategy
Profit-Taking:
- Sell at least 70% on the 3rd wave up (LTF Wave 5).
- Typically, sell 50% during a high-volume spike.
- Adjust stop-loss to breakeven once the trade achieves a 1.5:1 reward-to-risk ratio.
- If the market shows signs of losing momentum or divergence, ill will exit at breakeven.
The market is highly dynamic and constantly changing. HMT signals and target profit (TP) levels are based on the current price and movement, but market conditions can shift instantly, so it is crucial to remain adaptable and follow the market's movement.
If you find this signal/analysis meaningful, kindly like and share it.
Thank you for your support~
Sharing this with love!
HMT v2.0:
- Major update to the Momentum indicator
- Reduced false signals from inaccurate momentum detection
- New screener with improved accuracy and fewer signals
HMT v3.0:
- Added liquidity factor to enhance trend continuation
- Improved potential for momentum-based plays
- Increased winning probability by reducing entries during peaks
HMT v3.1:
- Enhanced entry confirmation for improved reward-to-risk ratios
HMT v4.0:
- Incorporated buying and selling pressure in lower timeframes to enhance the probability of trending moves while optimizing entry timing and scaling
HMT v4.1:
- Enhanced take-profit (TP) target by incorporating market structure analysis
HMT v5 :
Date: 23/01/2025
- Refined wave analysis for trending conditions
- Incorporated lower timeframe (LTF) momentum to strengthen trend reliability
- Re-aligned and re-balanced entry conditions for improved accuracy
HMT v6 :
Date : 15/02/2025
- Integrated strong accumulation activity into in-depth wave analysis
HMT v7 :
Date : 20/03/2025
- Refined wave analysis along with accumulation and market sentiment
HMT v8 :
Date : 16/04/2025
- Fully restructured strategy logic
HMT v8.1 :
Date : 18/04/2025
- Refined Take Profit (TP) logic to be more conservative for improved win consistency
CATIUSDT Analysis: Anticipating a Potential Price CorrectionHello traders!
Following a significant price drop, CATIUSDT appears to be poised for a potential price increase or corrective rebound. This upward movement could offer an opportunity for traders who bought at higher prices or are currently holding the cryptocurrency.
The anticipated price correction is likely to target the 0.382, 0.5, and 0.618 Fibonacci retracement levels. This price increase could contribute to a rebalancing of:
1. BINANCE:CATIUSDT CATIUSDT price
2. CATIUSDT market liquidity
3. CATIUSDT open interest
I have identified potential entry and exit points, as well as resistance levels, on the chart.
Good luck!
CATI/USDTKey Level Zone: 0.2690 - 0.2710
HMT v4.1 detected. The setup looks promising, supported by a previous upward/downward trend with increasing volume and momentum, presenting an excellent reward-to-risk opportunity.
HMT (High Momentum Trending):
HMT is based on trend, momentum, volume, and market structure across multiple timeframes. It highlights setups with strong potential for upward movement and higher rewards.
Whenever I spot a signal for my own trading, Iโll share it. Please note that conducting a comprehensive analysis on a single timeframe chart can be quite challenging and sometimes confusing. I appreciate your understanding of the effort involved.
Important Note :
Role of Key Levels:
- These zones are critical for analyzing price trends. If the key level zone holds, the price may continue trending in the expected direction. However, momentum may increase or decrease based on subsequent patterns.
- Breakouts: If the key level zone breaks, it signals a stop-out. For reversal traders, this presents an opportunity to consider switching direction, as the price often retests these zones, which may act as strong support-turned-resistance (or vice versa).
My Trading Rules
Risk Management
- Maximum risk per trade: 2.5%.
- Leverage: 5x.
Exit Strategy
Profit-Taking:
- Sell at least 70% on the 3rd wave up (LTF Wave 5).
- Typically, sell 50% during a high-volume spike.
- Adjust stop-loss to breakeven once the trade achieves a 1.5:1 reward-to-risk ratio.
- If the market shows signs of losing momentum or divergence, ill will exit at breakeven.
The market is highly dynamic and constantly changing. HMT signals and target profit (TP) levels are based on the current price and movement, but market conditions can shift instantly, so it is crucial to remain adaptable and follow the market's movement.
If you find this signal/analysis meaningful, kindly like and share it.
Thank you for your support~
Sharing this with love!
HMT v2.0:
- Major update to the Momentum indicator
- Reduced false signals from inaccurate momentum detection
- New screener with improved accuracy and fewer signals
HMT v3.0:
- Added liquidity factor to enhance trend continuation
- Improved potential for momentum-based plays
- Increased winning probability by reducing entries during peaks
HMT v3.1:
- Enhanced entry confirmation for improved reward-to-risk ratios
HMT v4.0:
- Incorporated buying and selling pressure in lower timeframes to enhance the probability of trending moves while optimizing entry timing and scaling
HMT v4.1:
- Enhanced take-profit (TP) target by incorporating market structure analysis
CATIUSDT IdeaGreetings, traders.
Observing the CatiUSDT BINANCE:CATIUSDT price trend, it appears poised for a further decline after a brief corrective period. The recent touch of the $0.3200 support area, coupled with the formation of a bearish evening star candlestick pattern on the 2-hour chart, suggests a potential downward movement. This pattern emerges notably above the established uptrend line, reinforcing the bearish signal.
Short-term price targets are identified at $0.2600 and, upon a successful breach of this level, a subsequent decline towards the $0.2000 to $0.2200 range is anticipated.
A prudent entry point for short positions would be on a break below $0.3045.
Best of luck in your trading endeavors.
*Remember that this is just a technical analysis and doesn't guarantee future market movements. Always conduct your own research and manage your risk accordingly.