CELO USDT SHORT SIGNAL#117. CELO/USDT – Trade Setup (SHORT)
📈 Position Type: SHORT
🕒 Timeframe: 1H
📊 Market: Futures
💰 Entry Zone:
0.06810
0.07070
🛑 Stop-Loss:
0.07205
🎯 Take-Profit Targets:
• TP1: 0.06630
• TP2: 0.06375
• TP3: 0.06113
• TP4: 0.05810
⚙️ Leverage:
5 *10
▫️ After TP1, move SL to Entry + 0.2%.
▪️ Exit Plan:
• 50% at TP1
• 25% at TP2
• 25% at TP3
📌 Risk Management:
Risk only 1–2% of your capital per trade.
⚠️ Always check and confirm the setup on your chart before entering the trade.
In-depth trading ideas
CELO: local squeeze with $0.0897 destinationThe Macro Picture 🗺️
CELO unwound from the $0.10441 highs down to the $0.05548 floor in June, then reversed and reclaimed ground to $0.07115. RSI has climbed back above 50 as the recovery builds higher lows — the balance has shifted toward the buyers.
The Setup ⚙️
The Range Floor 🟢
$0.05548 (Macro Support) is the demand base. The June low was defended and price has built well above it — that's the floor this range pivots on.
The Decision Point 🔴
$0.08163 (Local High) is the gate. A daily close above it flips the local structure bullish and opens the path to the $0.08965 measured-move target.
The Roadmap 🛣️
Hold the $0.05548 floor → break $0.08163 → run toward $0.08965. Invalidation is a clean daily close below $0.05548 — that breaks the base.
This is a GRID Range Play: a defined band to rotate, buying the lower half and scaling out into strength.
More setups in profile.
#CELO #Celo #crypto #trading #TA #3Commas #GRID
CELO USDT SHORT SIGNAL#89 CELO/USDT – Trade Setup (SHORT)
📈 Position Type: SHORT
🕒 Timeframe: 1H
📊 Market: Futures
💰 Entry Zone:
0.07125
🛑 Stop-Loss:
0.074
🎯 Take-Profit Targets:
• TP1: 0.070
• TP2: 0.06880
• TP3: 0.06744
• TP4: 0.06587
⚙️ Leverage:
5 *10
▫️ After TP1, move SL to Entry + 0.2%.
▪️ Exit Plan:
• 40% at TP1
• 20% at TP2
• 20% at TP3
20% at. TP4
📌 Risk Management:
Risk only 1–2% of your capital per trade.
⚠️ Always check and confirm the setup on your chart before entering the trade.
CELOUSDT Forming Bullish MomentumCELOUSDT is forming a clear bullish momentum pattern, a classic bullish wave signal that often indicates an upcoming breakout. The price has been consolidating within a narrowing range, suggesting that selling pressure is weakening while buyers are beginning to regain control. With consistent volume confirming accumulation at lower levels, the setup hints at a potential bullish breakout soon. The projected move could lead to an estimated gain of around 20% to 30% once the price breaks above the key resistance level. This bullish momentum pattern is typically seen at the end of downtrends or corrective phases, representing a potential shift in market sentiment from bearish to bullish.
Traders closely watching CELOUSDT are noting the strengthening momentum as it approaches a potential breakout zone. Healthy trading volume adds confidence to this setup, indicating that market participants may be positioning early in anticipation of a bullish reversal. Growing investor interest in CELOUSDT also reflects increasing confidence in the project's long-term fundamentals and improving technical outlook.
If the breakout is confirmed with sustained buying volume, it could mark the beginning of a fresh bullish leg. Traders may find this an attractive opportunity for medium-term gains as the bullish momentum pattern completes and upside momentum continues to build.
✅ Show your support by hitting the like button and
✅ Leaving a comment below! (What is You opinion about this Coin)
Your feedback and engagement keep me inspired to share more insightful market analysis with you!
#CELOUSDT market structure analysis#CELO
The price is moving within a descending channel on the 1-hour timeframe and has reached the lower boundary. It is now poised for a bounce and is expected to retest this boundary.
The Relative Strength Index (RSI) indicates a downward trend, which is likely to continue given the overbought conditions.
There is a key support zone in green at 0.06378. The price has bounced off this zone several times, making it a strong support level.
The price is trending towards the 100-period moving average, which we are approaching. This trend supports an upward move.
Entry Price: 0.06642
Target 1: 0.06750
Target 2: 0.06854
Target 3: 0.06977
Stop Loss: At the resistance zone in green
Remember this simple rule: Money management.
Any questions? Please leave a comment.
Thank you.
#CELOUSDT Final Liquidity Zone Before Expansion ?#CELO
The price is moving within a descending channel on the 1-hour timeframe and has reached the lower boundary. It is now poised for a bounce and is expected to retest this boundary.
The Relative Strength Index (RSI) indicates a downward trend, which is likely to continue given the overbought conditions.
A key support zone (in green) has been identified at 0.05000. The price has bounced off this zone several times, making it a strong support level.
The price is trending towards the 100-period moving average, which we are approaching. This trend supports an upward move.
Entry Price: 0.06380
Target 1: 0.06580
Target 2: 0.07060
Target 3: 0.07660
You can close at the second target or wait for the third target. The choice is yours.
Stop Loss: At the resistance zone (in green).
Remember this simple rule: Money Management.
Any questions? Please leave a comment.
Thank you.
CELOUSDT – Descending Trendline: Breakout or Further Downside?CELO remains in a medium- to long-term downtrend, clearly defined by a Descending Trendline acting as the primary resistance. 📉
The price is now approaching this major resistance once again, making this area a critical decision zone that could determine the next major move. ⚔️
The more frequently a trendline is tested, the greater the probability of a breakout. However, unless the price can close above the trendline with strong volume confirmation, sellers continue to maintain control of the market. 🔴
━━━━━━━━━━━━━━━━━━
📌 Pattern Overview
📉 A Descending Trendline reflects strong seller dominance, where every rally forms a Lower High.
🔹 This trendline has rejected the price multiple times, making it a highly respected resistance level.
⚖️ The current price is retesting the descending resistance, creating a key battle between Buyers 🟢 and Sellers 🔴.
🚀 If a breakout occurs, bearish momentum may begin to weaken, significantly increasing the probability of a trend reversal.
━━━━━━━━━━━━━━━━━━
🟢 Bullish Scenario 🚀
✅ The bullish scenario becomes more valid if the price closes above the Descending Trendline with a noticeable increase in trading volume. 📈
If the breakout is successfully confirmed, the next upside targets are:
🎯 Target 1: 0.08504 USDT
🎯 Target 2: 0.10290 – 0.11000 USDT
🎯 Target 3: 0.11902 – 0.13561 USDT
💡 As long as the price remains above the trendline after the breakout, the probability of a trend reversal continues to increase.
━━━━━━━━━━━━━━━━━━
🔴 Bearish Scenario 📉
❌ If the price is rejected once again at the Descending Trendline, it will confirm that the resistance remains valid.
In this scenario, CELO could:
🔻 Continue its existing downtrend.
🔻 Retest the previous low around 0.05548 USDT.
🔻 If this support fails to hold, a deeper decline becomes increasingly likely as the Lower High and Lower Low market structure remains intact.
⚠️ Until a confirmed breakout occurs, the overall market bias remains Bearish.
━━━━━━━━━━━━━━━━━━
📍 Conclusion
📌 The Descending Trendline remains the most important resistance level on the 2D timeframe.
🟢 A confirmed breakout could open the door for a stronger recovery and potentially signal the beginning of a trend reversal.
🔴 On the other hand, another rejection from this resistance would increase the probability of the ongoing downtrend continuing.
⚠️ Always wait for candle close confirmation and volume validation before making any trading decisions. Avoid entering trades solely based on breakout expectations.
━━━━━━━━━━━━━━━━━━
#CELO #CELOUSDT #Crypto 🚀 #Cryptocurrency #Altcoins #TechnicalAnalysis 📊 #TradingView #PriceAction #DescendingTrendline #Breakout #Resistance #Support #TrendAnalysis #CryptoTrading #Binance #Perpetual #SwingTrading #Bullish 🟢 #Bearish 🔴 #MarketAnalysis 📈
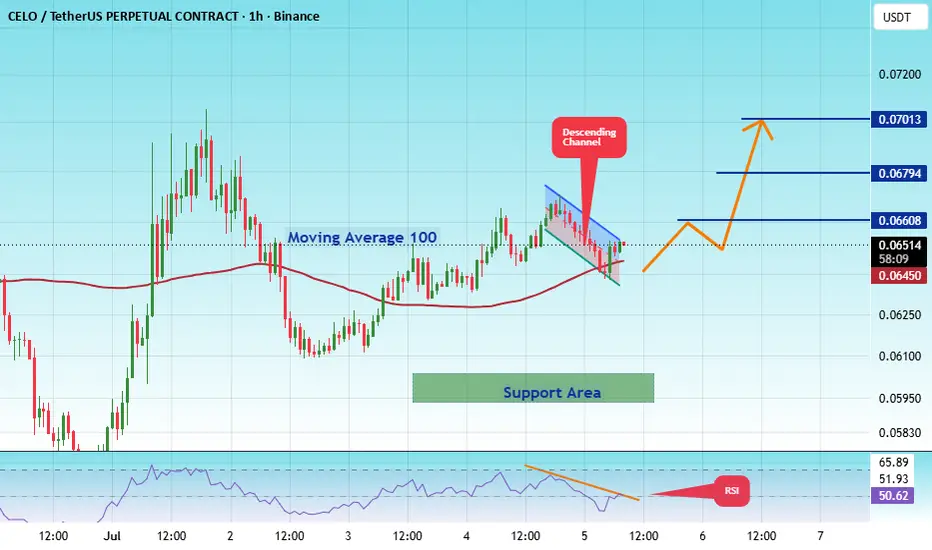
#CELOUSDT market structure analysis#CELO
The price is moving within a descending channel on the 1-hour timeframe and has reached the lower boundary. It is now poised for a bounce and is expected to retest this boundary.
The Relative Strength Index (RSI) indicates a downward trend, which is likely to continue given the overbought conditions.
There is a key support zone in green at 0.06000. The price has bounced off this zone several times, making it a strong support level.
The price is trending towards the 100-period moving average, which we are approaching. This trend supports an upward move.
Entry Price: 0.06500
Target 1: 0.06608
Target 2: 0.06794
Target 3: 0.07013
Stop Loss: At the resistance zone in green
Remember this simple rule: Money management.
Any questions? Please leave a comment.
Thank you.
CELOUSDT 1D#CELO is moving inside a falling wedge pattern on the daily chart. Consider entering this coin only after a solid breakout above the wedge resistance and the Ichimoku Cloud.
In case of a confirmed breakout, the potential upside targets are:
🎯 $0.08739
🎯 $0.09637
🎯 $0.10535
🎯 $0.11812
🎯 $0.13440
⚠️ Always remember to use a tight stop-loss and maintain proper risk management.
#CELOUSDT market structure analysis#CELO
The price is moving within a descending channel on the 1-hour timeframe and has reached the lower boundary. It is now poised for a bounce and is expected to retest this boundary.
The Relative Strength Index (RSI) indicates a downward trend, which is likely to continue given the overbought conditions.
There is a key support zone (in green) at 0.07454. The price has bounced off this zone several times, making it a strong support level.
The price is trending towards the 100-period moving average, which we are approaching. This trend supports an upward move.
Entry Price: 0.08000
First Target: 0.08197
Second Target: 0.08467
Third Target: 0.08794
You can stop at the first and second targets and close below them, or continue towards the third target. Stop Loss: At the resistance zone (in green).
Remember this simple rule: Money Management.
Any questions? Please leave a comment.
Thank you.
Celo · Bullish Altcoins Market · Bitcoin Price DynamicsTime is running out. Notice how the active candle is the biggest since before the October 2025 crash. That is, CELO went through a very turbulent period for more than six months and only now, this week, bullish action is starting to intensify.
This week I am seeing a move above EMA8 and also EMA13 at the same time. The first time these levels will be conquered as resistance in many months. Coming from a major low, this makes for a very powerful bullish signal.
CELOUSDT is about to regain all losses back to baseline, which is where you see the blue lines on the chart. Also MA200, the black line right in the middle of the screen, becomes an easy target; a must challenge, a must have.
Now let's consider the rest of the market.
CELO crashed with the market and hit bottom with the rest of market, February 2026. Celo is now starting a full recovery with... ? A full recovery with the rest of the market. This is not a move in isolation.
This is what shows what is coming to those projects such as ADA (Cardano) and DOGE (Dogecoin), just to name two that are yet to break bullish.
Bitcoin follows the altcoins market when it goes into consolidation within a bullish phase. The altcoins market follows Bitcoin when Bitcoin starts to grow after a strong bear market.
Bitcoin hit bottom and started to grow. Some smaller altcoins still moved first but the bigger projects are waiting for an even stronger confirmation. Sure proof that we saw a true bear market ending several months ago.
As soon as Bitcoin moves beyond $80,000, watch, enjoy, feel and experience and incredible growth explosion. When Bitcoin grows, everything grows. Bitcoin has been growing for months.
CELOUSDT is turning full green with increasing bullish momentum—this is only the start.
Bitcoin is not done with its bullish wave. We are witnessing only the start, you can tell by the behavior across the entire market.
It will be awesome. Trust me and win.
If you enjoy the content, follow me.
Namaste.
#CELOUSDT Final Liquidity Zone Before Expansion ?#CELO
The price is moving within a descending channel on the hourly timeframe. It has reached the lower boundary and is trending towards a bounce. A retest of this boundary is expected.
The Relative Strength Index (RSI) indicates a downward trend, and this trend is likely to continue due to the overbought condition.
A key support zone (in green) was found at 0.07666, and the price has bounced off this zone several times, making it a strong support level.
The price is trending towards the 100-period moving average, which we are approaching. This trend supports an upward move.
Entry Price: 0.07900
First Target: 0.08111
Second Target: 0.08229
Third Target: 0.08367
Stop Loss: At the resistance zone (in green)
Remember this simple rule: Money Management.
Any questions? Please leave a comment.
Thank you.
Everyone Forgot About $CELO After A -98% Crash. 60x? Everyone Forgot About CRYPTOCAP:CELO After A -98% Crash. The Potential Upside From Here Is 6,860%
#CELO Is Currently Trading Inside A High Risk-High Reward HTF Accumulation Range Following A ~98.67% Drawdown From Its ATH, Placing Price At An Extreme Discount Zone With Elevated Risk-Reward Dynamics.
Technical Structure
✅ Previous Cycle ATH: $5.21 (Macro Liquidity High)
✅ Macro Correction: −98.67% Into Current Range (~$0.08)
✅ Multi-Year Descending Trendline Acting As Dynamic Resistance
✅ Major S/R Flip: $0.498 (Strong Support → Confirmed Resistance)
✅ Bearish Breakdown Followed By Clean Retest & Rejection
✅ Lower High Formation Confirms Ongoing HTF Bearish Structure
✅ High-Risk Accumulation Zone At Current Lows
✅ Bullish Reversal Confirmation Only Above $0.148 (R1 Reclaim)
✅ Risk Invalidation: Continued Acceptance Below Range Lows
➡️ 2021 Expansion: Rally To ATH $5.2110
➡️ 2022-2026: -98.67% Corrective Breakdown Phase
➡️ Current Price: $0.08016 (High-Risk Accumulation Zone)
➡️ Current Phase: Extended Distribution → Late-Stage Accumulation
Structure Shift Requirements
1️⃣ Weekly Close Above Descending Trendline
2️⃣ Reclaim + Acceptance Above R1 ($0.1480)
3️⃣ Break Of LH Structure Near R2 ($0.4980)
Bull Cycle Targets (If Structure Shifts): $0.148 → $0.498 → $1.25 → $5.21+
Invalidation: Continued Rejection Below Descending Trendline + Failure To Reclaim $0.1480
The $0.08-$0.06 Region Represents A High-Risk Accumulation Zone For CELO/USDT. Bearish Continuation Remains Higher Probability Until HTF Structure Shift Is Confirmed.
TA Only. Not Financial Advice. ALWAYS DYOR.
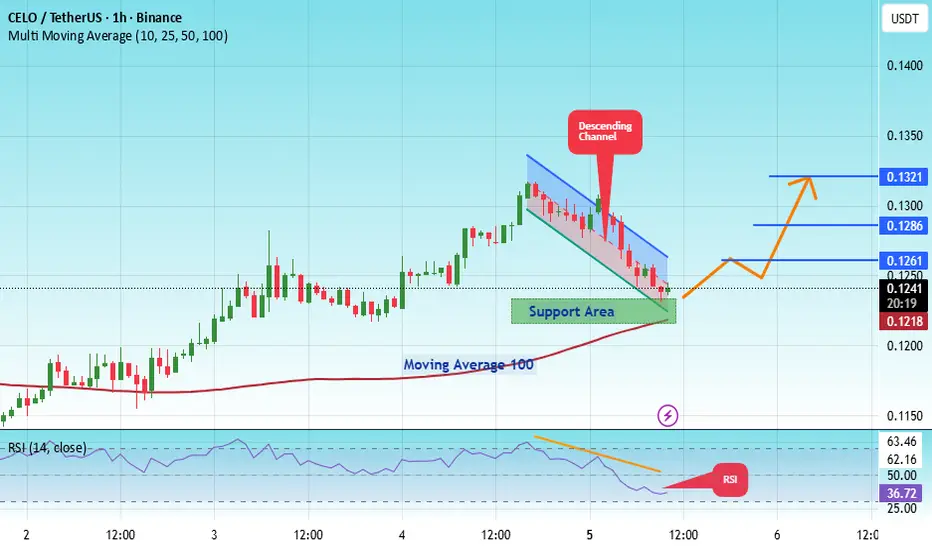
#CELO/USDT market structure analysis#CELO
The price is moving in a descending channel on the 1-hour timeframe. It has reached the lower boundary and is heading towards breaking above it, with a retest of the upper boundary expected.
We have a downtrend on the RSI indicator, which has reached near the lower boundary, and an upward rebound is expected.
There is a key support zone in green at 0.1225. The price has bounced from this zone multiple times and is expected to bounce again.
We have a trend towards stability above the 100-period moving average, as we are moving close to it, which supports the upward movement.
Entry price: 0.1242
First target: 0.1261
Second target: 0.1286
Third target: 0.1321
Stop loss: Below the support zone in green.
Don't forget a simple thing: capital management.
For inquiries, please leave a comment.
Thank you.
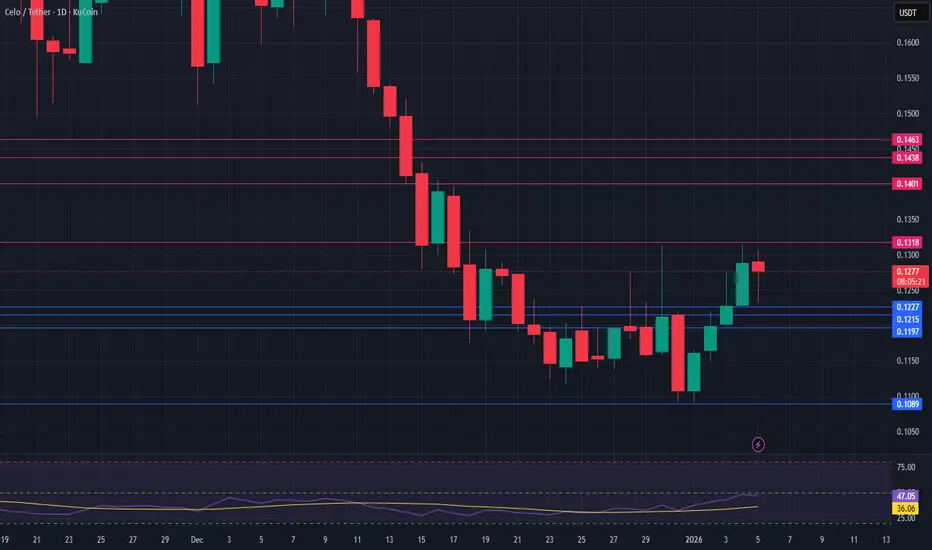
CELO at a Key Inflection Point | Price OutlookELO has been consolidating since mid-December after a steep 62% decline from November’s highs.
📅 Thursday’s upcoming event could be the catalyst to break this range.
🔼 Bullish Scenario:
Breakout above $0.1318 could target resistance near $0.1401, within December 15’s bearish weekly void.
Further upside may stall at $0.1438–$0.1463, overlapping multiple voids and October’s swing low.
🔽 Bearish Scenario:
First support sits at $0.1227 (Jan 3 daily void), with confluence from:
$0.1215 (Dec 30 rejection),
$0.1197 (Dec 22 weekly rejection), and
$0.1089 (Jan 1 swing low).
These are key zones where accumulation and stop defense may be active.
CELOBINANCE:CELOUSDT
CELO/ USDT
Entry range (0.112- 0.117)
SL 4H close below 0.111
T1 0.13
T2 0.14
T3 0.15
T4 0.16
T5 0.17
3 optional extra targets on the chart
_______________________________________________________
Golden Advices.
********************
* collect the coin slowly in the entry range.
* Please calculate your losses before the entry.
* Do not enter any trade you find it not suitable for you.
* No FOMO - No Rush , it is a long journey.
CELO/USDT – Accumulation Base + Multi-Target UpsideCELO/USDT – Accumulation Base + Multi-Target Upside
My Favorite Speculation Crypto... Life Changer
Thesis:
Celo offers real-world financial access with mobile-first crypto UX, low fees, and stablecoin remittance tools. If mass adoption resumes or alt-season returns, CELO is structurally positioned for asymmetric upside.
"Banking the unbanked... or quietly accumulating moonshots?"
**Chart Type:** Weekly (1W)
**Exchange:** Binance
**Current Price:** $0.176 (as of Dec 4, 2025)
---
**Wholesale Zone (Accumulation Base)**
* Range: $0.15–$0.33
* Price has ranged sideways for nearly 2 years.
* Smart money may be accumulating “base-building” pattern.
* Historical demand zone (buyers keep stepping in here).
**Equilibrium Levels (Potential Swing Targets)**
These are Fibonacci retracement levels from the macro swing high to low.
* 0.382 = $4.3851
* 0.618 = $6.9687
These are logical mid-cycle targets if CELO breaks out of the base. Price often reacts strongly to 0.382–0.618 zones in crypto cycles.
**Retail Zone / Full Retracement**
* 1.0 Fib = $11.1508
* Heavy supply and potential retail exit zone.
* Unrealistic near-term but viable in full bull run extensions.
---
**1.618 Extension = $17.9165**
* Blue-sky breakout level
* Would represent full euphoric move
* 90–100x from current levels (only for long-term vision or micro-cap speculators)
---
**Key Levels**
| Zone | Price | Action |
| Base Support | $0.15–$0.33 | Accumulation |
| First Target | $4.38 | Mid-Cycle Resistance |
| Next Target | $6.97 | Strong Resistance |
| Final Target | $11.15–$17.91 | Speculative Extension |