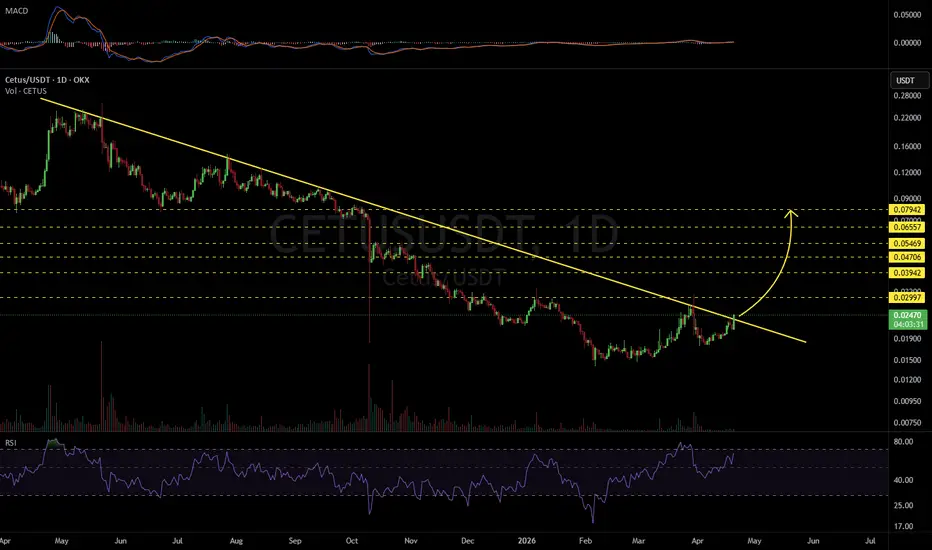
CETUS/USDT – Descending Trendline: Reversal or Fakeout?On the 2D timeframe, CETUS/USDT is still in a medium–long term downtrend structure, clearly shown by a series of lower highs and lower lows. Price is currently testing a dynamic resistance (descending trendline) that has been holding since the previous peak.
There are also key horizontal levels act
CETUSUSDT 1D#CETUS is breaking out above the descending resistance, but the daily candle has not closed yet. A successful retest is also required. In that case, the targets are:
🎯 $0.02997
🎯 $0.03942
🎯 $0.04706
🎯 $0.05469
🎯 $0.06557
🎯 $0.07942
⚠️ Always remember to use a tight stop-loss and maintain proper ri
Cetus—CETUSUSDT 3X—Long trade with 3,000% profits potentialWe will try to realize a 1,000% bullish wave on this chart setup. This 1,000% wave can result in 3,000% profits with 3X leverage, which is relatively low risk thus available for beginners also.
After the first breakout, as we have on this chart, there is always a retrace. Notice the blue cup patter
Cetus proof of life or just another hunt?CETUS is starting to show a shift in structure after a prolonged downtrend, but this is not the place to chase
Price has reclaimed the local range low and is pushing into a key supply zone where sellers previously controlled the market
What matters here is not the move up but how price behaves ins
DUSKUSDT Forming Bullish MomentumDUSKUSDT is forming a clear bullish momentum pattern, a classic bullish reversal signal that often indicates an upcoming breakout. The price has been consolidating within a narrowing range, suggesting that selling pressure is weakening while buyers are beginning to regain control. With consistent vo
CETUSUSDT Forming Bullish MomentumCETUSUSDT is forming a clear bullish momentum pattern, a classic bullish reversal signal that often indicates an upcoming breakout. The price has been consolidating within a narrowing range, suggesting that selling pressure is weakening while buyers are beginning to regain control. With consistent v
CETUSUSDT highly bullish in this bear market The CETUS/USDT pair is currently showing strong bullish momentum. Prices are moving upward with increasing trading volume, which indicates growing interest from buyers.
Technical signals suggest that buying pressure is stronger than selling pressure, and the token is attempting to break key resista
Cetus grew 2231% in 2023-2024. How much can it grow in 2026-2027Cetus Protocol grew 2,231% during its bullish cycle—June 2023 through November 2024. I start with the bullish cycle to show what is possible. It is easy to see how a Cryptocurrency project can grow 5X, 10X, 20X or more. It is normal. It happened many times before and continues to happen all of the t
CETUSUSDT 1D#CETUS is on the verge of breaking out above the descending resistance on the daily timeframe. The RSI is showing the likelihood of continued upward movement. In case of a breakout, the potential targets are:
🎯 $0.0492
🎯 $0.0587
🎯 $0.0682
🎯 $0.0818
🎯 $0.0990
⚠️ Always remember to use a tight stop-
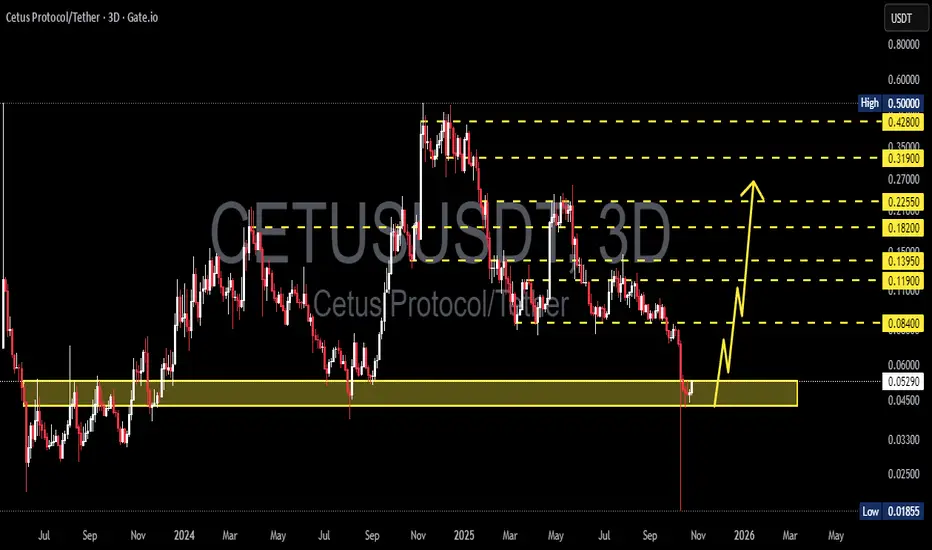
CETUSUSDT — Major Rebound or Deeper Breakdown?CETUS is now testing a critical support zone between 0.0528 and 0.043, a level that has historically acted as a major demand base since 2023. The latest 3D candle shows a massive liquidity wick down to 0.0185, followed by a sharp rebound — a strong signal of a potential bear-trap or early accumulati
See all ideas
Summarizing what the indicators are suggesting.
Oscillators
Neutral
SellBuy
Strong sellStrong buy
Strong sellSellNeutralBuyStrong buy
Oscillators
Neutral
SellBuy
Strong sellStrong buy
Strong sellSellNeutralBuyStrong buy
Summary
Neutral
SellBuy
Strong sellStrong buy
Strong sellSellNeutralBuyStrong buy
Summary
Neutral
SellBuy
Strong sellStrong buy
Strong sellSellNeutralBuyStrong buy
Summary
Neutral
SellBuy
Strong sellStrong buy
Strong sellSellNeutralBuyStrong buy
Moving Averages
Neutral
SellBuy
Strong sellStrong buy
Strong sellSellNeutralBuyStrong buy
Moving Averages
Neutral
SellBuy
Strong sellStrong buy
Strong sellSellNeutralBuyStrong buy
Displays a symbol's price movements over previous years to identify recurring trends.