CETUS/USDT – Descending Trendline: Reversal or Fakeout?On the 2D timeframe, CETUS/USDT is still in a medium–long term downtrend structure, clearly shown by a series of lower highs and lower lows. Price is currently testing a dynamic resistance (descending trendline) that has been holding since the previous peak.
There are also key horizontal levels acting as reaction zones:
0.0290 → Key resistance (red line)
0.0333 – 0.0440 – 0.0550 – 0.0815 → Layered target zones
0.0139 → Major support (previous low)
---
📉 Pattern Formation: Descending Triangle / Falling Resistance
The chart shows a descending structure with a downward sloping resistance, which is typically:
Bearish continuation, but
Can turn into a bullish reversal if a valid breakout occurs
Key characteristics:
Consistent selling pressure from the trendline
Support starting to stabilize (base formation)
Breakout potential as selling pressure weakens
---
🚀 Bullish Scenario (Valid Breakout)
If price manages to:
Break and close strongly above 0.0290 + trendline,
Supported by increasing volume,
Then the upside targets are:
🎯 0.0333 (nearest resistance)
🎯 0.0440
🎯 0.0550
🎯 0.0815 (major resistance)
➡️ This would signal a shift from downtrend to early uptrend
➡️ Often followed by strong impulsive momentum
---
🐻 Bearish Scenario (Rejection / Fakeout)
If price fails to break out and:
Gets rejected at the trendline / 0.0290,
Forms long wicks or bearish candles,
Then the downside potential:
🔻 Re-test lower zones
🔻 Drop toward 0.0190 – 0.0150
🔻 Possibly revisit 0.0139 (major support)
➡️ This confirms the downtrend is still dominant
➡️ The breakout attempt may turn into a fakeout
---
⚠️ Key Insights
Current zone = critical decision area
Breakout without volume = high fakeout risk
Structure remains bearish until a clean breakout occurs
---
📌 Conclusion
CETUS/USDT is at a major decision point. A breakout from the descending trendline could trigger a strong reversal, while failure would likely extend the downtrend. Traders should wait for clear confirmation before entering positions.
#CETUS #CETUSUSDT #CryptoAnalysis #TechnicalAnalysis #Altcoins #Breakout #DescendingTriangle #CryptoTrading #BullishScenario #BearishScenario #SupportResistance #Trendline #Altcoins2026
In-depth trading ideas
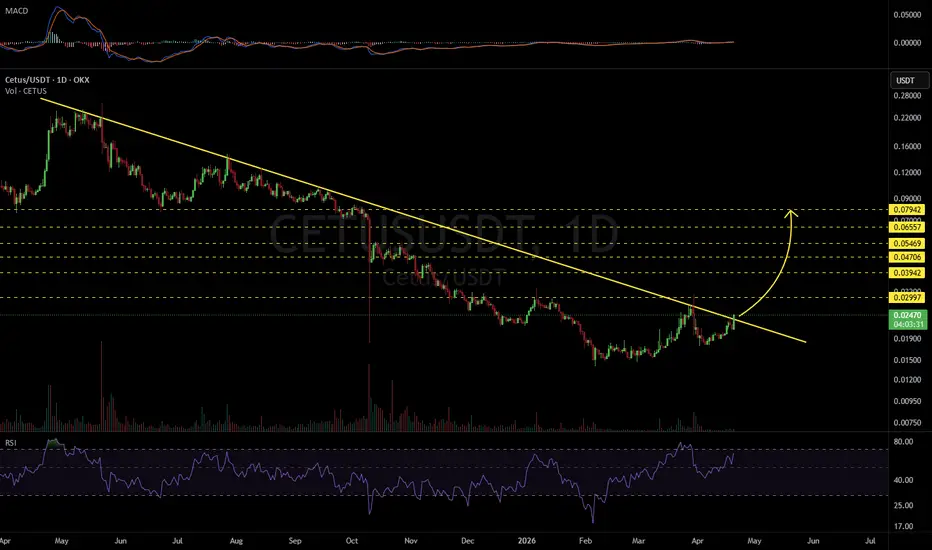
CETUSUSDT 1D#CETUS is breaking out above the descending resistance, but the daily candle has not closed yet. A successful retest is also required. In that case, the targets are:
🎯 $0.02997
🎯 $0.03942
🎯 $0.04706
🎯 $0.05469
🎯 $0.06557
🎯 $0.07942
⚠️ Always remember to use a tight stop-loss and maintain proper risk management.
Cetus—CETUSUSDT 3X—Long trade with 3,000% profits potentialWe will try to realize a 1,000% bullish wave on this chart setup. This 1,000% wave can result in 3,000% profits with 3X leverage, which is relatively low risk thus available for beginners also.
After the first breakout, as we have on this chart, there is always a retrace. Notice the blue cup pattern on the chart. CETUSUSDT broke out of this pattern and support was found right at the neckline and this level also matches the October 2025 wick low.
This can be easily interpreted as the retrace being over. With the retrace being over, we get a bullish resumption next, a continuation of the initial bullish breakout.
We will try to realize 1,000% with 3X, a total of 3,000%. Very low risk, vs a high potential for reward.
Full trade-numbers below:
_____
LONG CETUSUSDT
Leverage: 3X
Potential: 3072%
Allocation: 5%
Entry zone: $0.0170 - $0.0212
Targets:
1) $0.0270
2) $0.0333
3) $0.0453
4) $0.0647
5) $0.0804
6) $0.0961
7) $0.1185
8) $0.1469
9) $0.1850
10) $0.2284
Stop: Close weekly below $0.0169
_____
Thank you for reading. This is an easy one.
Namaste.
Cetus proof of life or just another hunt?CETUS is starting to show a shift in structure after a prolonged downtrend, but this is not the place to chase
Price has reclaimed the local range low and is pushing into a key supply zone where sellers previously controlled the market
What matters here is not the move up but how price behaves inside this range
Right now this looks like a developing accumulation with higher lows forming, but it is still sitting directly under resistance
Two scenarios to watch
If price builds structure above this zone and holds, that signals acceptance and opens the door for continuation higher
If price gets rejected and falls back into the range, this becomes another distribution and likely rotates lower again
Momentum is improving but not fully confirmed, so this is a patience zone not an entry zone
Key idea
Wait for structure not emotion
Break and hold leads to expansion
Rejection leads to rotation
Most traders lose here by jumping early
Let the market prove direction first
DUSKUSDT Forming Bullish MomentumDUSKUSDT is forming a clear bullish momentum pattern, a classic bullish reversal signal that often indicates an upcoming breakout. The price has been consolidating within a narrowing range, suggesting that selling pressure is weakening while buyers are beginning to regain control. With consistent volume confirming accumulation at lower levels, the setup hints at a potential bullish breakout soon. The projected move could lead to an impressive gain of around 190% to 200% once the price breaks above the wedge resistance.
This bullish momentum pattern is typically seen at the end of downtrends or corrective phases, and it represents a potential shift in market sentiment from bearish to bullish. Traders closely watching DUSKUSDT are noting the strengthening momentum as it nears a breakout zone. The good trading volume adds confidence to this pattern, showing that market participants are positioning early in anticipation of a reversal.
Investors’ growing interest in DUSKUSDT reflects rising confidence in the project’s long-term fundamentals and current technical strength. If the breakout confirms with sustained volume, this could mark the start of a fresh bullish leg. Traders might find this a valuable setup for medium-term gains, especially as the pattern completes and buying momentum accelerates.
✅ Show your support by hitting the like button and
✅ Leaving a comment below! (What is your opinion about this Coin?)
Your feedback and engagement keep me inspired to share more insightful market analysis with you!
CETUSUSDT Forming Bullish MomentumCETUSUSDT is forming a clear bullish momentum pattern, a classic bullish reversal signal that often indicates an upcoming breakout. The price has been consolidating within a narrowing range, suggesting that selling pressure is weakening while buyers are beginning to regain control. With consistent volume confirming accumulation at lower levels, the setup hints at a potential bullish breakout soon. The projected move could lead to an impressive gain of around 140% to 150% once the price breaks above the wedge resistance.
This bullish momentum pattern is typically seen at the end of downtrends or corrective phases, and it represents a potential shift in market sentiment from bearish to bullish. Traders closely watching CETUSUSDT are noting the strengthening momentum as it nears a breakout zone. The good trading volume adds confidence to this pattern, showing that market participants are positioning early in anticipation of a reversal.
Investors’ growing interest in CETUSUSDT reflects rising confidence in the project’s long-term fundamentals and current technical strength. If the breakout confirms with sustained volume, this could mark the start of a fresh bullish leg. Traders might find this a valuable setup for medium-term gains, especially as the pattern completes and buying momentum accelerates.
✅ Show your support by hitting the like button and
✅ Leaving a comment below! (What is your opinion about this Coin?)
Your feedback and engagement keep me inspired to share more insightful market analysis with you!
CETUSUSDT highly bullish in this bear market The CETUS/USDT pair is currently showing strong bullish momentum. Prices are moving upward with increasing trading volume, which indicates growing interest from buyers.
Technical signals suggest that buying pressure is stronger than selling pressure, and the token is attempting to break key resistance levels. If this continues, further price gains are likely in the short term.
Overall, the market sentiment around CETUS remains positive, and traders are watching it closely for a potential breakout.
Cetus grew 2231% in 2023-2024. How much can it grow in 2026-2027Cetus Protocol grew 2,231% during its bullish cycle—June 2023 through November 2024. I start with the bullish cycle to show what is possible. It is easy to see how a Cryptocurrency project can grow 5X, 10X, 20X or more. It is normal. It happened many times before and continues to happen all of the time. It will happen again.
"Cetus Protocol, a decentralized exchange and liquidity protocol, operates on the Sui and Aptos blockchains. It leverages the Concentrated Liquidity Market Makers (CLMM) paradigm, integrating elements from Uniswap V3 and Trader Joe to offer advanced trading and liquidity options. Cetus aims to build a robust and flexible liquidity network, enhancing trading experiences and liquidity efficiency for DeFi users."
The bearish cycle so far lasted 455 days. New all-time low, which means more than 100% of all gains removed. Is it over? Yes, according to the volume indicator and all the other classic signals that I look at for you on a daily basis.
Yes, the bearish cycle is over.
New all-time low; trading volume has come to a halt; there is a rounded bottom pattern and long-term bullish divergence with the MACD which produced a bullish cross after hitting an all-time low. You see? Classic signals.
This is a great chart and we trade based on technical analysis. You decide if you want to buy and hold. You can't go wrong when buying this low. The best is yet to come.
People will figure it out in due time but when the altcoins market becomes like this, there is no going back. It is unavoidable. It is the same thing I've been seeing over and over, again and again in the past 13 years... Be my guest.
Namaste.
CETUSUSDT 1D#CETUS is on the verge of breaking out above the descending resistance on the daily timeframe. The RSI is showing the likelihood of continued upward movement. In case of a breakout, the potential targets are:
🎯 $0.0492
🎯 $0.0587
🎯 $0.0682
🎯 $0.0818
🎯 $0.0990
⚠️ Always remember to use a tight stop-loss and maintain proper risk management.
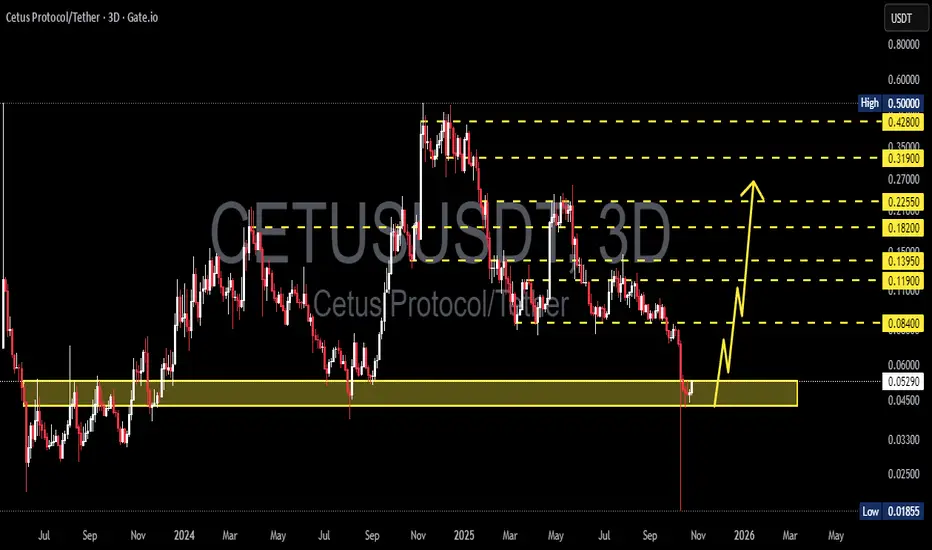
CETUSUSDT — Major Rebound or Deeper Breakdown?CETUS is now testing a critical support zone between 0.0528 and 0.043, a level that has historically acted as a major demand base since 2023. The latest 3D candle shows a massive liquidity wick down to 0.0185, followed by a sharp rebound — a strong signal of a potential bear-trap or early accumulation phase forming at the bottom.
The broader trend remains bearish, with a sequence of lower highs since the 2025 peak. However, this recent recovery suggests that buyers are trying to defend the last major support before a possible structural reversal.
---
🔹 Market Structure & Pattern
The yellow zone (0.0528–0.043) marks the last defense line for bulls.
The deep wick indicates a liquidity sweep / shakeout, often seen before major reversals.
As long as price stays above 0.043, there’s still a strong chance for a rebound setup.
---
🟢 Bullish Scenario
A confirmed 3D close above 0.0528 with strong rejection from below could mark the beginning of a new upward leg.
Potential targets on the way up:
0.084 → first resistance retest
0.119 – 0.1395 → mid-term supply zone
0.182 – 0.225 → next swing target area
A higher low above 0.043 would confirm that bulls are regaining control and building structure for a larger move.
---
🔻 Bearish Scenario
If the support box fails and price closes below 0.043, bearish continuation is likely.
Downside targets would then shift to:
0.025 – 0.020, and possibly a full retest of 0.0185 (the wick low).
That scenario would confirm that the latest recovery was only a dead cat bounce within a continuing macro downtrend.
---
⚖️ Conclusion
The 0.0528–0.043 zone is a make-or-break level for CETUS.
Holding this area could ignite a multi-stage recovery toward higher resistances, while a confirmed breakdown below it would likely lead to another capitulation leg.
This is the decision point where structure and sentiment will define the next phase of the trend.
---
📊 Trader’s Note
The long wick to 0.0185 shows that liquidity has been cleared — often a sign of smart money accumulation before a larger reversal. Wait for clear structure confirmation before entering; volatility here can easily trap both sides.
---
#CETUS #CETUSUSDT #CryptoAnalysis #BearTrap #LiquiditySweep #ReversalZone #SwingTrade #PriceAction #TechnicalAnalysis
CETUS/USDT 3D — Awaiting a Major Decision at Key Support ZoneCetus Protocol (CETUS) is currently at a highly critical phase, trading just above a strong historical support zone that has repeatedly acted as a key price floor. The chart reveals a tight technical formation, signaling a potential for a significant move in the near term.
---
🔍 Technical Analysis:
Key Support Zone: $0.09000 – $0.10084
Price is currently testing a major demand area that has historically prevented deeper drops since mid-2023.
Ascending Trendline:
A medium-term trendline from 2023 remains intact, supporting a continued higher low structure.
Decreasing Volume:
Shrinking volume suggests the market is in a state of accumulation or awaiting a strong breakout catalyst.
---
🧩 Price Structure & Patterns:
Horizontal Consolidation above support → indicates potential accumulation phase.
Ascending Triangle Support (flat support + rising trendline) → this pattern is often a bullish continuation when followed by a breakout to the upside.
---
🐂 Bullish Scenario:
If price successfully bounces from the support zone, a step-by-step upward movement becomes likely, with the following targets:
Price Level Role Notes
$0.12067 Initial Resistance Minor rejection zone
$0.13967 Flip Zone Needs breakout confirmation
$0.16000 Mid-Range Resistance Key level for further upside
$0.18282 – $0.22329 Major Bullish Target Break above this signals trend recovery
$0.31809 – $0.41317 Long-term Resistance Potential full retracement zone
A clean breakout above $0.22329 with strong volume could signal a resumption of the long-term bullish trend.
---
🐻 Bearish Scenario:
If the price breaks down below $0.09000 and closes beneath the ascending trendline:
The higher low structure will be invalidated.
Potential downside targets:
$0.07000 (minor support)
$0.05500 – $0.04000 (psychological zones)
$0.02154 (historical low)
This would indicate a shift toward distribution and a broader bearish trend.
---
🧠 Suggested Trading Strategy:
🔁 Reversal Traders: Look for bullish candlestick confirmation (e.g., hammer, engulfing) at support zone.
💥 Breakout Traders: Wait for breakout and retest above $0.13967 before entering.
🛡️ Risk Management: Tight stop-loss below $0.09000, targets aligned with resistance levels.
---
📝 Conclusion:
CETUS/USDT is at a make-or-break level, sitting right above structural support and trendline confluence. A strong bounce here could offer a great risk-reward long opportunity, while a breakdown opens the door to further downside.
Patience and confirmation will be key.
#CETUSUSDT #CETUSProtocol #CryptoBreakout #TrendlineSupport #AltcoinAnalysis #ChartPattern #BullishSetup #BearishScenario #CryptoTechnicalAnalysis
CETUS at a Pivotal Point Inside Dual Daily Structures🔍 $CETUS is compressing tightly on the daily chart—coiling inside a symmetrical triangle 📐 while staying within the bounds of an ascending channel 📈. This layered structure signals growing pressure beneath the surface.
A sharp rejection from the upper trendline ❌ has shifted attention back to the lower support zone. Will it rebound from here or crack below?
⚠️ This is a high-stakes area to watch—momentum is building, and a breakout in either direction could trigger a major move.
Drop your bias below—bullish continuation or bearish snap?
Not financial advice.
Cetus long setup, RR 4 There is big chance for leverage 3-4 if you want to try this coin. Invalidation is bellow if we looking based on Elliot wave theory.
Be aware if Bitcoin try to corrective more we will have deeper retracement.
We have one more zone bellow so if you want to try second zone, invalidation is the same but you can take much higher leverage
Ivan
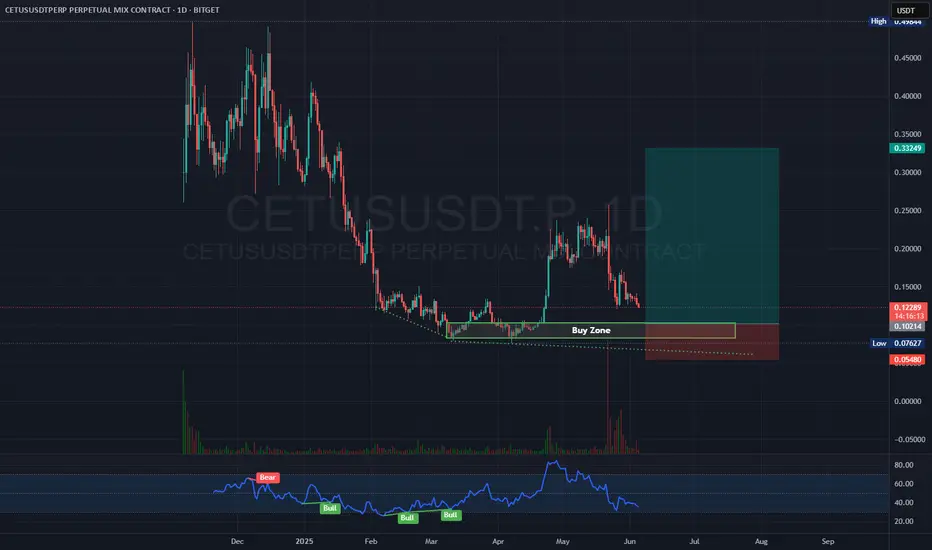
CETUS/USDT – Spot Accumulation Idea from Strong Support ZoneOn the daily chart, CETUS is currently trading near a well-established **support zone** that has historically acted as a strong demand area. This **Buy Zone** offers an attractive opportunity to accumulate CETUS for a potential mid-term move.
### 🔹 Key Points:
* **Buy Zone:** Between **\$0.102 and \$0.123**
This range has repeatedly shown strong support, making it a favorable area to accumulate spot positions or enter with low leverage (max 2x).
* **Trading Style:** **Spot accumulation**, no leverage or max 2x leverage – focused on swing positioning rather than short-term trades.
* **Risk Management:**
If the price reaches **\$0.13256**, consider **moving the stop-loss to entry** and **partially realizing profits** to secure gains while letting the rest ride toward higher targets.
---
### ⚠️ **Disclaimer:**
This is a personal trading idea based on technical analysis and **not financial advice**. Always do your own research and assess your risk tolerance. Crypto investments carry high risk and may not be suitable for every investor.
CETUS Hack Giving Opportunities Within SUICRYPTOCAP:SUI SUI is one of the fastest growing L1 chains. Previously extreme intra SUI dominance within swapping volume by KUCOIN:CETUSUSDT CETUS. This hack is a direct threat to the confidence of not just the application but the chain itself just like Ethereum was exposed during the MakerDAO hack.
Volume market wants to know their funds are secure to certain degree and predictable. Volume flow is more than fine with centralisation, esp with low barriers. Should the deposits be mostly secured and exploit fixed then it can bring confidence roaring back not just to CETUS but more importantly, SUI.
CETUS dominance within SUI is falling to rising applications. My favourite is Bluefin with its low barriers to account creation like google login. KUCOIN:BLUEUSDT BLUE has rising dominance within SUI volume market.
CETUS Setup – Bullish Bias, Risk 3%This trade setup has many reasons to take it, but I’ll explain the main ones only.
1. Bullish Harmonic Bat Pattern – Special chart pattern is being made, and I will place a limit order to enter at the last point (D leg).
2. Falling Wedge Pattern – Lower line of this pattern is also at the same place where I want to enter, so it gives extra confirmation.
3. Trend is Bullish – Market is already going up, and we are trading with trend. You must have heard, “Trend is your friend.”
CETUS: The Smart Investment for Short-Term Growth! (12H)Since we placed the red arrow on the chart, the CETUS correction has begun.
It seems to be a double correction, with two diametric patterns—one butterfly and one diamon. connected together.
Currently, we appear to be in wave f of the diamond diametric. Once the correction completes and reaches the green zone, wave g could finish.
We’ll need to see if after wave g, we have wave x, wave h, or a post-pattern movement!
The targets are marked on the chart. A daily candle close below the invalidation level will invalidate this analysis.
For risk management, please don't forget stop loss and capital management
When we reach the first target, save some profit and then change the stop to entry
Comment if you have any questions
Thank You
cetus short term goalThere are alot of DEX's previously, Notable ones were Cake and radiyum
If radiyum topped at 1.5bn mcap and cake at 6bn mcap, cetus would require a price of 1.6 to reach 1bn mcap so a 5x before even reaching previous ranges of similar projects.
if we know this and we expect coins to perform stronger this season i dont think a 3bn mcap at a price of 5 is far fetched, we will see.
GOOD LUCK!!
tp1:1.6 easy!!