CFX USDT LONG SIGNAL#91 CFX /USDT – Trade Setup (LONG)
📈 Position Type: LONG
🕒 Timeframe: 1H
📊 Market: Futures
💰 Entry Zone:
0.04660
0.04487
🛑 Stop-Loss:
0.04385
🎯 Take-Profit Targets:
• TP1: 0.04768
• TP2: 0.04973
• TP3: 0.05183
• TP4: 0.05396
⚙️ Leverage:
5 *10
▫️ After TP1, move SL to Entry + 0.2%.
▪️ Exit Plan:
• 40% at TP1
• 20% at TP2
• 20% at TP3
20% at. TP4
📌 Risk Management:
Risk only 1–2% of your capital per trade.
⚠️ Always check and confirm the setup on your chart before entering the trade.
In-depth trading ideas
CFX/USDT (30M) — Long Setup | Retest into POI & Upside Inefficie📊 Asset: CFX/USDT (30m)
📈 Direction: Long
The price has delivered a clean correction down into the Point of Interest (POI), retesting a previously formed Key Imbalance while extending to the 1.618 external Fibonacci expansion level.
During this downward drive, the asset formed a new Key Imbalance, creating a clear upside target. Above current price action lies significant market inefficiency that needs to be rebalanced before further directional continuation.
⚙️ Execution Parameters:
• Entry Zone: ~0.04412 (Current reaction inside POI)
• Stop Loss (SL): 0.04201 (Below liquidity sweep low)
🎯 Targets (Take Profit):
• TP1 (75% Partial Fix): 0.04564 — Fill of the primary Key Imbalance / Fib 1.0
• TP2 (25% Runner): 0.04668 – 0.04700 — Upper POI / Fib 1.414 – 1.618 extension
💡 Management Strategy: Move Stop Loss to Breakeven once TP1 is secured. Maintain strict risk management.
CFX at macro floor: base recovery toward $0.055The Macro Picture 🗺️
CFX gave back the entire move from the $0.08 May top down to the $0.041 June low, then stopped falling. Price has spent weeks coiling in a tight $0.042–0.046 base, with RSI curling back up through 50 — the quiet compression that usually precedes the next expansion.
The Setup ⚙️
The Accumulation Zone 🟢
$0.041–0.0455 is where the selling dried up. Every push toward $0.042 has been bought back, and the June flush low has held on each retest. This is the demand shelf the recovery is building from.
The Decision Point 🔴
$0.05 (Local High) is the gate. A daily close above it flips the local structure bullish and clears the path to the $0.055 macro ceiling.
The Roadmap 🛣️
Hold equilibrium at $0.0455 → break $0.05 → run into $0.055 macro resistance. Invalidation is a clean daily close below $0.041 — that voids the accumulation thesis.
This is a textbook DCA Accumulation Zone setup: scale in across the $0.041–0.0455 band and let the base do the work.
More setups in profile.
#CFX #Conflux #crypto #trading #TA #3Commas #DCA
CFX USDT SHORT SIGNAL#65. CFX/USDT – Trade Setup (SHORT)
📈 Position Type: SHORT
🕒 Timeframe: 1 H
📊 Market: Futures
💰 Entry Zone:
0.04345
🛑 Stop-Loss:
0.04440
🎯 Take-Profit Targets:
• TP1: 0.04271
• TP2: 0.04205
• TP3: 0.04140
• TP4:
TP5:
TP6:
⚙️ Leverage:
5- 10
⚠️ After reaching TP1, move Stop-Loss to Entry Price.
📌 Risk Management:
Risk only 1–2% of your capital per trade.
Always confirm the setup on your chart before entry
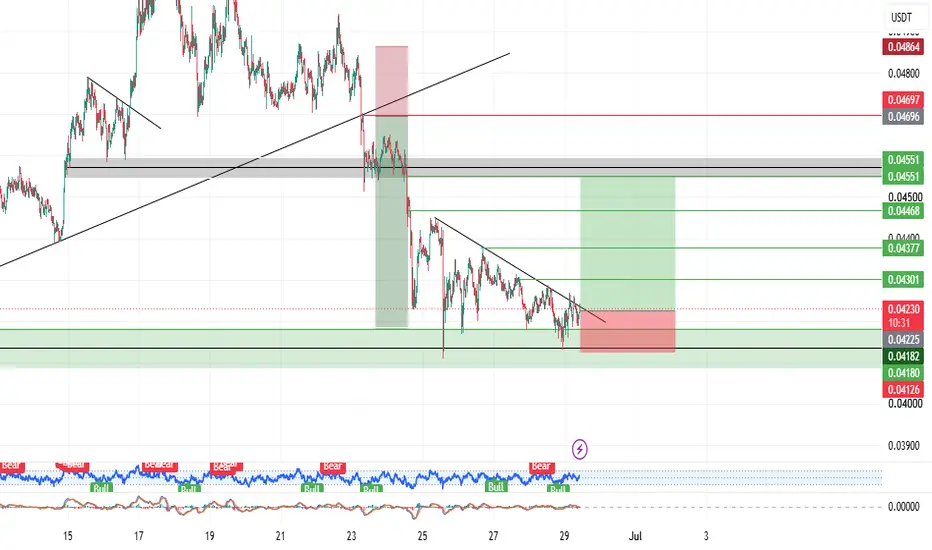
CFX USDT LONG SIGNALCFX/USDT – Trade Setup (LONG)
📈 Position Type: long
🕒 Timeframe: 1 H
📊 Market: Futures
💰 Entry Zone:
0.04225
🛑 Stop-Loss:
0.04125
🎯 Take-Profit Targets:
• TP1: 0.043
• TP2: 0.07377
• TP3: 0.04468
• TP4: 0.04550
TP5:
TP6:
⚙️ Leverage:
5-10
⚠️ After reaching TP1, move Stop-Loss to Entry Price.
📌 Risk Management:
Risk only 1–2% of your capital per trade.
Always confirm the setup on your chart before entry
#CVXUSDT : Long-Term Breakout Signals Massive Upside Potentia
#CVX
The price is moving within a descending channel on the 1-hour timeframe and has reached the lower boundary. It is now poised for a bounce and is expected to retest this boundary.
The Relative Strength Index (RSI) indicates a downward trend, which is likely to continue given the overbought conditions.
There is a key support zone in green at 0.03800. The price has bounced off this zone several times, making it a strong support level.
The price is trending towards the 100-period moving average, which we are approaching. This trend supports an upward move.
Entry Price: 0.04410
Target 1: 0.04500
Target 2: 0.04645
Target 3: 0.04837
Stop Loss: At the resistance zone in green
Remember this simple rule: Money management.
Any questions? Please leave a comment.
Thank you.
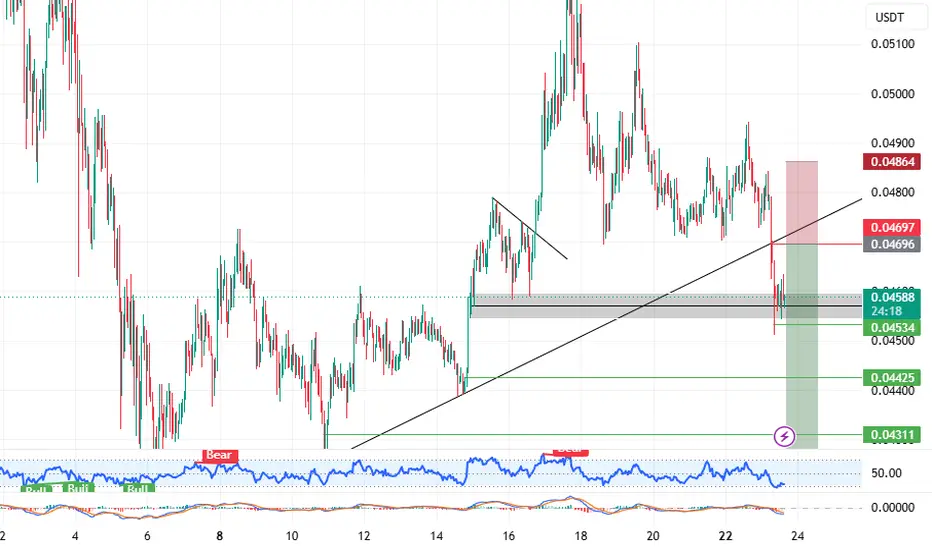
CFX USDT SHORT SIGNALCFX/USDT – Trade Setup (SHORT)
📈 Position Type: short
🕒 Timeframe: 1 H
📊 Market: Futures
💰 Entry Zone:
0.04694
🛑 Stop-Loss:
0.04865
🎯 Take-Profit Targets:
• TP1: 0.04537
• TP2: 0.04425
• TP3: 0.04311
• TP4: 0.04180
TP5:
⚙️ Leverage:
5–10
⚠️ After reaching TP1, move Stop-Loss to Entry Price.
📌 Risk Management:
Risk only 1–2% of your capital per trade.
Always confirm the setup on your chart before entry
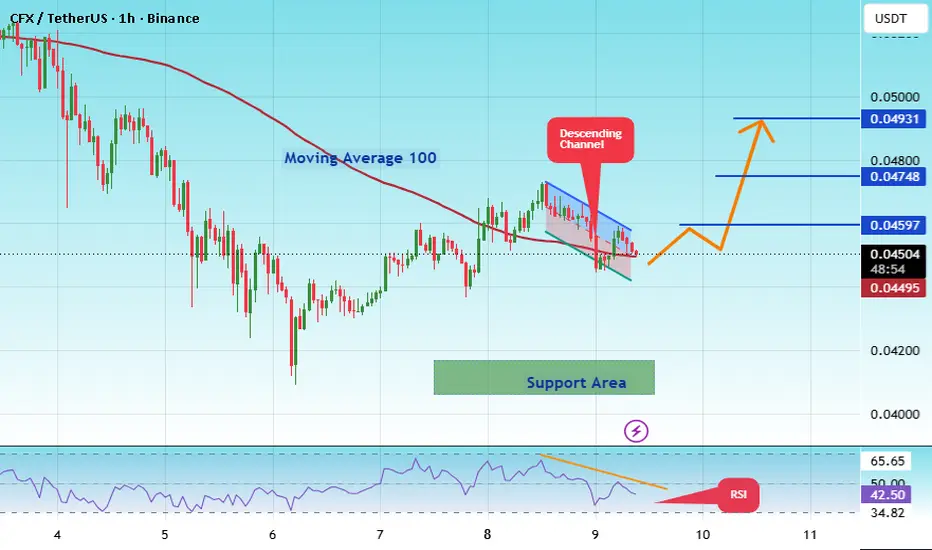
#CFXUSDT — Symmetrical Triangle: Ready for a Rally or a Breakd#CFX
The price is moving within a descending channel on the 1-hour timeframe and has reached the lower boundary. It is now poised for a bounce and is expected to retest this boundary.
The Relative Strength Index (RSI) indicates a downward trend, which is likely to continue given the overbought conditions.
There is a key support zone in green at 0.0407. The price has bounced off this zone several times, making it a strong support level.
The price is trending towards the 100-period moving average, which we are approaching. This trend supports an upward move.
Entry Price: 0.04500
Target 1: 0.04597
Target 2: 0.04748
Target 3: 0.04931
Stop Loss: At the resistance zone in green
Remember this simple rule: Money management.
Any questions? Please leave a comment.
Thank you.
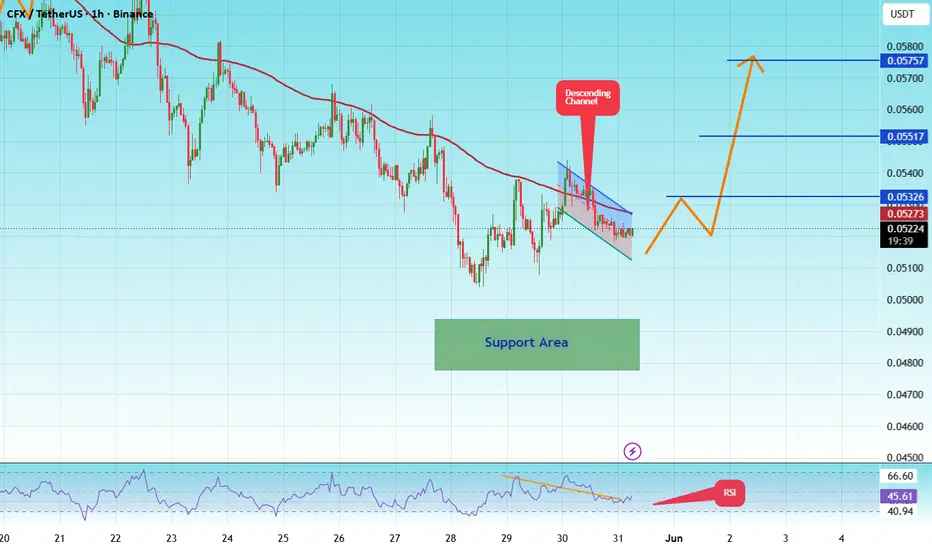
#CFXUSDT — Symmetrical Triangle: Ready for a Rally or a Breakd#CFX
The price is moving within a descending channel on the hourly timeframe. It has reached the lower boundary and is trending towards a bounce. A retest of this boundary is expected.
The Relative Strength Index (RSI) indicates a downward trend, and this trend is likely to continue due to the overbought condition.
A key support zone has been identified in green at 0.04791. The price has bounced off this zone several times, making it a strong support level.
The price is trending towards the 100-period moving average, which we are approaching. This trend supports an upward move.
Entry Price: 0.05220
First Target: 0.05326
Second Target: 0.05517
Third Target: 0.05757
You can close at the second target or wait for the third target to be reached. The choice is yours.
Stop Loss: At the resistance zone in green.
Remember this simple rule: Money Management.
Any questions? Please leave a comment.
Thank you.
Conflux Token (CFX) · Extended consolidation at bottom pricesConsolidation at bottom prices continues. The longer this phase lasts, the stronger the bullish wave that follows.
On CFXUSDT, there is a perfect double-top eight months apart, December 2024 vs July 2025, and this would be the main resistance on a bullish wave based on TA, a price tag around $0.28. But, this is only a portion of the chart. If you zoom out, you can see more.
Based on the duration of the last market phase, the current chart structure, Bitcoin and the rest of the altcoins, we can predict with a good level of certainty that we are set to experience something extraordinary.
Ordinary in the Cryptocurrency market means 300-500% marketwide, this can be considered even weak for many but it all depends on when this type of growth appears.
Good in this space would mean anything between 600-800% marketwide. That is, most of the projects. Really good we would expect to see beyond 1,000%. Many projects growing between 1,000 to 1,500%.
Something extraordinary, we would expect to see 20-30X on some projects, while the majority can do a minimum of 800 to 1,200%.
Now, what's your take? Do you agree with me? Do you think we are set to experience something ordinary, good, really good or extraordinary on the bullish side? Do you think the altcoins market can grow ten levels up? If this happens, what happens to all the capital when the market doesn't grow anymore? Will the capital fly away or, is it here to stay?
Remember, we are looking at the worst conditions since 2022, the previous bear market bottom. Once the bottom was hit, we saw growth from 2022 through 2025. Think of this same situation in 2026. The worst ever and the start of a new long-term bull market. Growth starts from the bottom, several months ago. It can go from February 2026 until 2029 and beyond.
Something extraordinary is possible.
Namaste.
#CFXUSDT — Symmetrical Triangle: Ready for a Rally or a Breakd#CFX
The price is moving within a descending channel on the 1-hour timeframe and has reached the lower boundary. It is now poised for a bounce and is expected to retest this boundary.
The Relative Strength Index (RSI) indicates a downward trend, which is likely to continue given the overbought conditions.
There is a key support zone in green at 0.05180. The price has bounced off this zone several times, making it a strong support level.
The price is trending towards the 100-period moving average, which we are approaching. This trend supports an upward move.
Entry Price: 0.05800
First Target: 0.06000
Second Target: 0.06276
Third Target: 0.06616
You can stop at the first and second targets and close below them, or continue towards the third target. Stop Loss: At the resistance zone in green.
Remember this simple rule: Money Management.
Any questions? Please leave a comment.
Thank you.
#CFX/USDT — Symmetrical Triangle: Ready for a Rally or a Breakd#CFX
The price is moving within a descending channel on the hourly timeframe. It has reached the lower boundary and is heading towards a breakout, with a retest of the upper boundary expected.
The Relative Strength Index (RSI) is showing a downward trend, approaching the lower boundary, and an upward bounce is anticipated.
There is a key support zone in green at 0.0700. The price has bounced from this level several times and is expected to bounce again.
The indicator is showing a trend towards consolidation above the 100-period moving average, which we are approaching, supporting the upward move.
Entry Price: 0.0722
First Target: 0.0737
Second Target: 0.0758
Third Target: 0.0783
Stop Loss: Below the green support zone.
Remember this simple thing: Money management.
For any questions, please leave a comment.
Thank you.
Conflux CFX possible price pumpFeels like this could be the perfect moment for a CRYPTOCAP:CFX pump 👀
Especially with all the Trump / Xi negotiations happening in the background 😏
#ConfluxNetwork is a Chinese blockchain project, that’s reportedly exploring a stablecoin linked to the offshore yuan.
And looking at the OKX:CFXUSDT chart, price held surprisingly well during the recent market correction.
Almost looks like someone really doesn’t want it to go lower.
📈 Possible targets:
$0.083 → around +20%
$0.115 → around +65%
$0.19 → up to +170% 👀
Of course, these are just scenarios.
But lately CRYPTOCAP:CFX looks far more interesting than many “dead” alts on the market.
What do you think — real comeback potential or just temporary hype?
_____________
◆ Follow us ❤️ for daily crypto insights & updates!
🚀 Don’t miss out on important market moves
🧠 DYOR | This is not financial advice, just thinking out loud
CFXUSDT 1D#CFX is moving inside a symmetrical triangle on the daily chart and is on the verge of breaking out above the triangle resistance and the daily SMA200. If confirmed, the potential upside targets are:
🎯 $0.07557
🎯 $0.08495
🎯 $0.09433
🎯 $0.10769
🎯 $0.12470
⚠️ Always use a tight stop-loss and maintain proper risk management.
Conflux Token (CFX) · Enters Uptrend Territory (~1400% Possible)I would say that a 600% target in the coming months is a high probability happening, while beyond 1,000% is something do-able.
Conflux Token (CFXUSDT). There is a perfect double-top eight months apart, December 2024 vs July 2025, and this would be the main resistance based on TA, a price tag around $0.28. But, this is only a portion of the chart. If you zoom out, you can see more.
Based on the duration of the last market phase, the current chart structure, Bitcoin and the rest of the altcoins, we can predict with a good level of certainty that we are set to experience something extraordinary.
Ordinary in the Cryptocurrency market means 300-500% marketwide, this can be considered even weak for many but it all depends on when this type of growth appears.
Good in this space would mean anything between 600-800% marketwide. That is, most of the projects. Really good we would expect to see beyond 1,000%. Many projects growing between 1,000 to 1,400%.
Something extraordinary, we would expect to see 20-30X on some projects, while the majority can do a minimum of 800 to 1,200%.
Now, what's your take? Do you agree with me? Do you think we are set to experience something ordinary, good, really good or extraordinary on the bullish side? Do you think the altcoins market can grow ten levels up? If this happens, what happens to all the capital when the market doesn't grow anymore? Will the capital fly away or, will it be here to stay?
Remember, we are looking at the worst conditions since 2022, the previous bear market bottom. Once the bottom was hit, we saw growth from 2022 through 2025. Think of this same situation in 2026. The worst ever and the start of a new long-term bull market. Growth started two months ago, February 2026, and can go until 2029 and beyond.
Something extraordinary is possible.
Namaste.
#CFX #CFX has broken out of a falling wedge pattern 📈 and is consolidating above the key breakout level. The next potential target is clearly marked near 0.0630 🎯, with the breakout zone now serving as crucial support. Identifying classic chart patterns early can offer valuable insights into market sentiment and potential price movements.
#CFX #crypto #chartpatterns #trading
CFX: Breakout or Breakdown?Yello, are you ready for what could be the most decisive move on #CFX in the coming days, or will this setup trap impatient traders once again?
💎#CFXUSDT has broken out of a well-defined descending channel after a long period, signaling that bearish pressure is starting to weaken.
💎What makes this setup even more interesting is the clean retest of the broken structure. This is a key technical confirmation that often signals continuation rather than a fake breakout.
💎Price is now hovering just above a critical demand zone between $0.0500 and $0.0470. This area has previously acted as strong support, and as long as it holds, the bullish scenario remains valid.
💎 If this demand zone continues to hold, we can expect a move toward the first resistance at $0.0570. This level aligns with previous rejection zones and short-term structure resistance. A clean break above it could open the path toward the major resistance around $0.0760, where a stronger reaction is likely.
💎 At the same time, we must stay realistic and prepared for the alternative scenario. If the price loses the demand zone and closes below $0.0430, the bullish structure becomes invalid. In that case, further downside is likely, as the breakout would lack the strength to sustain momentum.
🎖 Strive for consistency, not quick profits. Treat the market as a businessman, not as a gambler.
MyCryptoParadise
iFeel the success🌴
CFXUSDT Forming Falling WedgeCFXUSDT is forming a clear falling wedge pattern, a classic bullish reversal signal that often indicates an upcoming breakout. The price has been consolidating within a narrowing range, suggesting that selling pressure is weakening while buyers are beginning to regain control. With consistent volume confirming accumulation at lower levels, the setup hints at a potential bullish breakout soon. The projected move could lead to an impressive gain of around 80% to 90% once the price breaks above the wedge resistance.
This falling wedge pattern is typically seen at the end of downtrends or corrective phases, and it represents a potential shift in market sentiment from bearish to bullish. Traders closely watching CFXUSDT are noting the strengthening momentum as it nears a breakout zone. The good trading volume adds confidence to this pattern, showing that market participants are positioning early in anticipation of a reversal.
Investors’ growing interest in CFXUSDT reflects rising confidence in the project’s long-term fundamentals and current technical strength. If the breakout confirms with sustained volume, this could mark the start of a fresh bullish leg. Traders might find this a valuable setup for medium-term gains, especially as the wedge pattern completes and buying momentum accelerates.
✅ Show your support by hitting the like button and
✅ Leaving a comment below! (What is your opinion about this Coin?)
Your feedback and engagement keep me inspired to share more insightful market analysis with you!
CFXUSDT — Bear Flag: Breakdown or Breakout?On the 2D timeframe, CFX/USDT remains in a major downtrend structure since its previous peak. Currently, price is making a pullback and forming a rising consolidation pattern.
The yellow zone (0.0708 – 0.0641) represents a strong supply / resistance area, which previously acted as a distribution zone with multiple rejections.
Within this zone, price is forming a pattern:
> Bear Flag — a bearish continuation pattern
---
📐 Pattern Explanation (Bear Flag)
Key characteristics visible on the chart:
A sharp prior decline (flagpole)
Followed by an upward consolidation channel (flag)
Price moves counter to the main trend (bullish pullback)
📉 In theory:
A bear flag in a downtrend typically signals a continuation of the downside move after the consolidation phase ends.
---
🔴 Bearish Scenario (More Dominant)
If price fails to break the supply zone and exits the flag to the downside:
Breakdown from the lower trendline of the channel
Confirmation with a candle close below flag support
Main targets:
0.050 – 0.046 (minor support)
0.040 (previous low) as the next target
📌 This aligns with:
Market structure still forming lower highs
Supply zone holding as resistance
Bear flag → bearish continuation bias
---
🟢 Bullish Scenario (Invalidation Case)
Bullish momentum is only valid if:
Price breaks and closes above 0.0708
Supported by strong volume / impulsive move
Followed by a successful retest as support
🎯 Upside targets:
0.080 – 0.095
Potential continuation toward 0.11
📌 This would indicate:
Buyers successfully flip supply into demand
---
⚠️ Key Levels to Watch
Main resistance: 0.0708 – 0.075
Flag support: lower trendline of the channel
Strong support: 0.040
---
🧩 Conclusion
CFX is currently at a critical point:
Trading inside a strong supply zone
Forming a bearish pattern (bear flag)
Awaiting confirmation for the next major move
👉 As long as no breakout occurs, the bias remains bearish
👉 A flag breakdown could trigger a significant drop
#CFX #CFXUSDT #CryptoAnalysis #TechnicalAnalysis #Altcoin #BearFlag #BearishPattern #CryptoTrading #SupportResistance #PriceAction #CryptoMarket #AltcoinSeason
Conflux Token (CFX) · 676% vs 1,100%I would say that 676% is a high probability target while 1,100% is do-able. There is a perfect double-top eight months apart, December 2024 vs July 2025, and this would be the main resistance based on TA, a price tag around $0.28. But, this is only a portion of the chart. If you zoom out, you can see more.
Based on the duration of the last market phase, the current chart structure, Bitcoin and the rest of the altcoins, we can predict with a good level of certainty that we are set to experience something extraordinary.
Ordinary in the Cryptocurrency market means 300-500% marketwide, this can be considered even weak for many but it all depends on when this type of growth appears.
Good in this space would mean anything between 600-800% marketwide. That is, most of the projects. Really good we would expect to see beyond 1,000%. Many projects growing between 1,000 to 1,400%.
Something extraordinary, we would expect to see 20-30X on some projects, while the majority can do a minimum of 800 to 1,200%.
Now, what's your take? Do you agree with me? Do you think we are set to experience something ordinary, good, really good or extraordinary on the bullish side? Do you think the altcoins market can grow ten levels up? If this happens, what happens to all the capital when the market doesn't grow anymore? Will the capital fly away or, is it here to stay?
Remember, we are looking at the worst conditions since 2022, the previous bear market bottom. Once the bottom was hit, we saw growth from 2022 through 2025. Think of this same situation in 2026. The worst ever and the start of a new long-term bull market. Growth starting two months ago, February 2026 until 2029.
Something extraordinary is possible.
Namaste.
CFX Futures Squeeze Spec Firing But Spot and OBV Say Not YetSignal board on CFX is bearish-dominant at 22 green to 30 red out of 112. EMA 1 to 2, Ichi TK 5 to 8, C>T 5 to 9, DD/SS 1 to 7. Every structural signal is flipped negative. Candle patterns 7 to 6 nearly flat, engulf 2 to 3, Pat Tot 2 to 2. Spread reading 5.4 percent Tight with Clarity at only 46 percent — the indicator itself is flagging low confidence in the current read. No squeeze firing at all, momentum reading Bear Up with bandwidth at 27.68 percent Normal.
Futures squeeze is showing ELVT at 6 bars with a Speculative classification and Futures Only tag. This is a critical distinction — the squeeze energy exists entirely in the derivatives book with zero spot squeeze confirmation. Spot Z at 0.16 Average, Futures Z negative 0.40 Steady, combined negative 0.26 Steady. SpotZ 1:5 reads 0.16 to negative 0.56 then 0.72 with a flat acceleration arrow. The recent recovery in the short-term Z is not yet confirmed by a trend.
Leverage at 1.61x Spot Heavy sitting at 8.5 percentile Floor is the most interesting data point here. Spot is genuinely dominating the book with 231 million spot against 374 million futures — the closest to real spot participation of all today's setups, but with S/F dollar value showing 12.82 million spot against 20.7 million futures the absolute size is still small. OBV Z at negative 0.66 Inflow is a contradiction worth noting — classified Inflow but the value is deeply negative, meaning accumulation is beginning from a low base not confirming a breakout.
Prem at 0.04 percent Neutral at 1.3 sigma, Yield at 40 APY 1.3 sigma Bear. MeanZ negative 0.7 Drift minus. Price sits at 12.8 percent of range Floor with AT Min at 0.37x printed 368 bars ago and AT Max at 14.98x at 963 bars ago. The range high at 0.1561 is the measured target if this resolves bullish.
The honest read: CFX has the floor location and spot-heavy leverage structure that precedes real recoveries but everything else is pointing down right now. Bear cascade active at 8 bars, signal board 22 to 30, OBV negative, no spot squeeze, futures-only speculative squeeze at 6 bars elevation. The Futures Only Speculative squeeze tag means institutions are positioning in derivatives ahead of a potential move but spot has not confirmed. Watch for OBV Z to cross zero and Spot Z to sustain above 0.5 before considering any long entry. Until then this is a futures positioning play with the floor as structural support only.
Is That Crypto Pump Real? Data Says No. Here's Why.
Stop Losing Money to Fake Volume. Find Real Moves Now.
Trade the REAL Crypto Volume. Stop Getting Faked Out.
CFX is near the buy zone (4H)From the level we marked on the chart, a bullish structure appears to have formed on CFX, which looks like an expanding flat.
It now seems to be completing wave D, which is expected to finish in the green zone. After that, price is likely to move into wave E, which is a bullish wave.
We are looking for buy opportunities in the buy zone.
Targets are marked on the chart take some profit at the first target, then move your stop to break-even.
A daily candle close below the invalidation level would invalidate this analysis.
If you have a symbole or altcoin you want analyzed, first hit the like button and then comment its name so I can review it for you.
What do you think? Is CFX bullish?
CFX: poised for a breakout or a setback? key levels to watchCFXUSDT – ready for the next leg or just running out of fuel? Lately CFX has been riding the narrative of renewed interest in scalable L1s, and according to the market there’s been fresh rotation into smaller caps while majors cool off. Today price is stalling right under local resistance after a strong impulse, so this is the “decision zone” on the 4H.
On the 4H chart I see price holding above a cluster of green demand blocks with RSI cooling from overbought but still above mid range – classic consolidation after a pump. As long as we keep closing above this local support band around the current range, I lean toward another push up, with volume profile gaps above hinting that a quick spike into the higher liquidity zone could be on deck. I might be wrong, but this looks more like a pause than a top.
My base plan: bullish continuation toward the next resistance zone above the recent high, using this consolidation area as my invalidation. For beginners, I’d only consider longs while candles stay above the nearest green block and RSI doesn’t dump below 50. ⚠️ If that support snaps and we start accepting back inside the lower demand zones, I’d flip bias to a deeper pullback and look for fresh entries lower instead of trying to “hero buy” the knife.