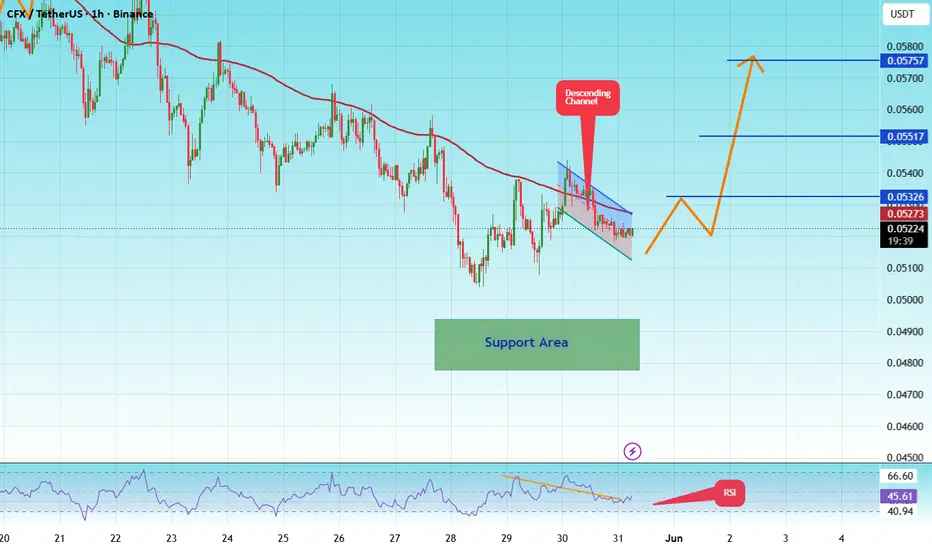
CFXUSDT— Symmetrical Triangle: Ready for a Rally or a#CFX
The price is moving within a descending channel on the 1-hour timeframe; it has reached the lower boundary and is poised for a rebound. A retest of this boundary is expected, supporting some upward movement.
The Relative Strength Index (RSI) indicates a bearish trend, but an upward breakout is likely due to oversold conditions on the 1-hour timeframe.
An orange trend line supports an upward rebound.
There is initial support at 0.05025, acting as a primary support zone for the price.
A
In-depth trading ideas
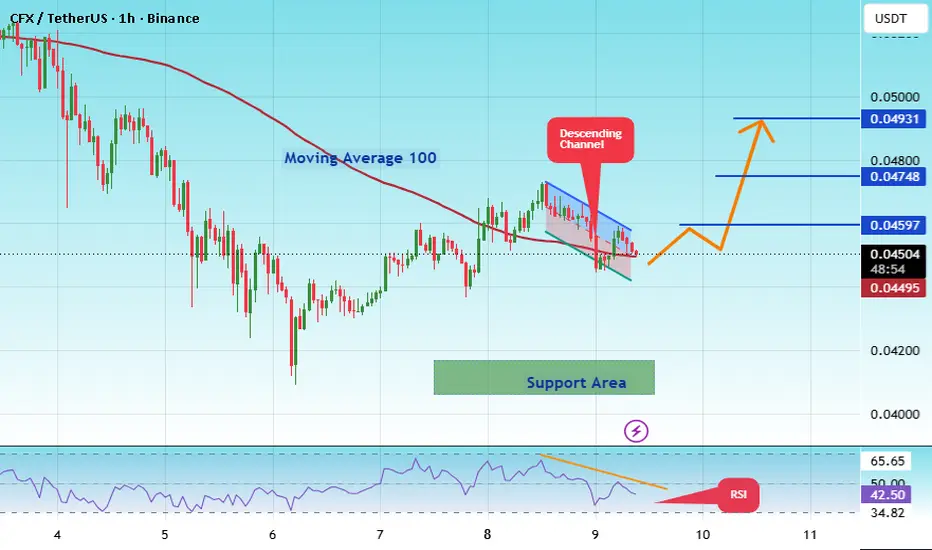
#CFXUSDT— Symmetrical Triangle: Ready for a Rally or a#CFX
The price is moving within a descending channel on the 1-hour timeframe; it has reached the lower boundary and appears poised for a rebound. A retest of this boundary is expected, supporting a potential upward move.
The Relative Strength Index (RSI) indicates a bearish trend, but an upward breakout is likely due to oversold conditions on the 1-hour chart.
There is initial support at 0.04196.
A key support zone (marked in green) exists at 0.04064; the price has bounced off this area mult
CFX USDT SHORT SIGNAL116. CFX/USDT – Trade Setup (SHORT)
📈 Position Type: SHORT
🕒 Timeframe: 1H
📊 Market: Futures
💰 Entry Zone:
0.04600
0.04749
🛑 Stop-Loss:
0.04870
🎯 Take-Profit Targets:
• TP1: 0.04471
• TP2: 0.04332
• TP3: 0.0
• TP4. 637.56
Tp5.
⚙️ Leverage:
5*10
▫️ After TP1, move SL to Entry + 0.2%.
▪️ Exit Plan:
• 40% at TP1
• 20% at TP2
• 20% at TP3
20% at TP4
📌 Risk Management:
Risk only 1–2% of your capital per trade.
⚠️ Always check and confirm the setup on your chart before ente
CFX - Critical Resistance, Breakout or Rejection?The CFX/USDT chart shows that price is still within a clear medium-term downtrend, characterized by the Descending Trendline (yellow line) that has continuously pressured price from the peak area around $0.22–$0.27 toward the low at $0.03745.
However, the latest structure is beginning to show consolidation and recovery from the bottom area, making a potential Descending Trendline breakout the main area to watch. 🔎📈
---
📐 PATTERN: DESCENDING TRENDLINE
🟡 Descending Trendline acts as a dynamic
CFX USDT LONG SIGNAL70. CFX/USDT – Trade Setup (LONG)
📈 Position Type: LONG
🕒 Timeframe: 1H
📊 Market: Futures
💰 Entry Zone:
0.046
0.04392
🛑 Stop-Loss:
0.04295
🎯 Take-Profit Targets:
• TP1: 0.04806
• TP2: 0.05187
• TP3: 0.05619
• TP4. 0.06043
Tp5.
⚙️ Leverage:
5*3
▫️ After TP1, move SL to Entry + 0.2%.
▪️ Exit Plan:
• 40% at TP1
• 20% at TP2
• 20% at TP3
20% at TP4
📌 Risk Management:
Risk only 1–2% of your capital per trade.
⚠️ Always check and confirm the setup on your chart before enter
CFX – Local Breakout, Bigger Range Ahead **Technology Overview**
Conflux (CFX) is a Layer 1 blockchain designed to provide high throughput, low transaction fees, and scalability for decentralized applications. The network uses a Tree-Graph structure and supports Web3 applications and a broader digital asset ecosystem.
**Technical Analysis**
On the **4-hour chart**, we can see a **larger trading range**, marked by the white lines, representing the main structure in which price has been trading for an extended period. Within this la
#CFXUSDT— Symmetrical Triangle: Ready for a Rally or a#CFX
The price is moving within a descending channel on the 1-hour timeframe and has reached the lower boundary. It is now poised for a bounce and is expected to retest this boundary.
The Relative Strength Index (RSI) indicates a downward trend, which is likely to continue given the overbought conditions.
There is a key support zone in green at 0.03620, and the price has bounced off this zone several times, making it a strong support level.
The price is trending towards the 100-period moving
#CFXUSDT— Symmetrical Triangle: Ready for a Rally or a#CFX
The price is moving within a descending channel on the 1-hour timeframe and has reached the lower boundary. It is now poised for a bounce and is expected to retest this boundary.
The Relative Strength Index (RSI) indicates a downward trend, which is likely to continue given the overbought conditions.
There is a key support zone in green at 0.03620, and the price has bounced off this zone several times, making it a strong support level.
The price is trending towards the 100-period moving
#CFXUSDT— Symmetrical Triangle: Ready for a Rally or a#CFX
The price is moving within a descending channel on the 1-hour timeframe and has reached the lower boundary. It is now poised for a bounce and is expected to retest this boundary.
The Relative Strength Index (RSI) indicates a downward trend, which is likely to continue given the overbought conditions.
A key support zone has been identified in green at 0.03750. The price has bounced off this zone several times, making it a strong support level.
The price is trending towards the 100-period
#CFXUSDT— Symmetrical Triangle: Ready for a Rally or a #CFX
The price is moving within a descending channel on the 1-hour timeframe and has reached the lower boundary. It is now poised for a bounce and is expected to retest this boundary.
The Relative Strength Index (RSI) indicates a downward trend, which is likely to continue given the overbought conditions.
A key support zone has been identified in green at 0.03649. The price has bounced off this zone several times, making it a strong support level.
The price is trending towards the 100-period
CFX/USDT (30M) — Long Setup | Retest into POI & Upside Inefficie📊 Asset: CFX/USDT (30m)
📈 Direction: Long
The price has delivered a clean correction down into the Point of Interest (POI), retesting a previously formed Key Imbalance while extending to the 1.618 external Fibonacci expansion level.
During this downward drive, the asset formed a new Key Imbalance, creating a clear upside target. Above current price action lies significant market inefficiency that needs to be rebalanced before further directional continuation.
⚙️ Execution Parameters:
• Entry
CFX USDT LONG SIGNAL#91 CFX /USDT – Trade Setup (LONG)
📈 Position Type: LONG
🕒 Timeframe: 1H
📊 Market: Futures
💰 Entry Zone:
0.04660
0.04487
🛑 Stop-Loss:
0.04385
🎯 Take-Profit Targets:
• TP1: 0.04768
• TP2: 0.04973
• TP3: 0.05183
• TP4: 0.05396
⚙️ Leverage:
5 *10
▫️ After TP1, move SL to Entry + 0.2%.
▪️ Exit Plan:
• 40% at TP1
• 20% at TP2
• 20% at TP3
20% at. TP4
📌 Risk Management:
Risk only 1–2% of your capital per trade.
⚠️ Always check and confirm the setup on your chart before entering
CFX at macro floor: base recovery toward $0.055The Macro Picture 🗺️
CFX gave back the entire move from the $0.08 May top down to the $0.041 June low, then stopped falling. Price has spent weeks coiling in a tight $0.042–0.046 base, with RSI curling back up through 50 — the quiet compression that usually precedes the next expansion.
The Setup ⚙️
The Accumulation Zone 🟢
$0.041–0.0455 is where the selling dried up. Every push toward $0.042 has been bought back, and the June flush low has held on each retest. This is the demand shelf the reco
CFX USDT SHORT SIGNAL#65. CFX/USDT – Trade Setup (SHORT)
📈 Position Type: SHORT
🕒 Timeframe: 1 H
📊 Market: Futures
💰 Entry Zone:
0.04345
🛑 Stop-Loss:
0.04440
🎯 Take-Profit Targets:
• TP1: 0.04271
• TP2: 0.04205
• TP3: 0.04140
• TP4:
TP5:
TP6:
⚙️ Leverage:
5- 10
⚠️ After reaching TP1, move Stop-Loss to Entry Price.
📌 Risk Management:
Risk only 1–2% of your capital per trade.
Always confirm the setup on your chart before entry
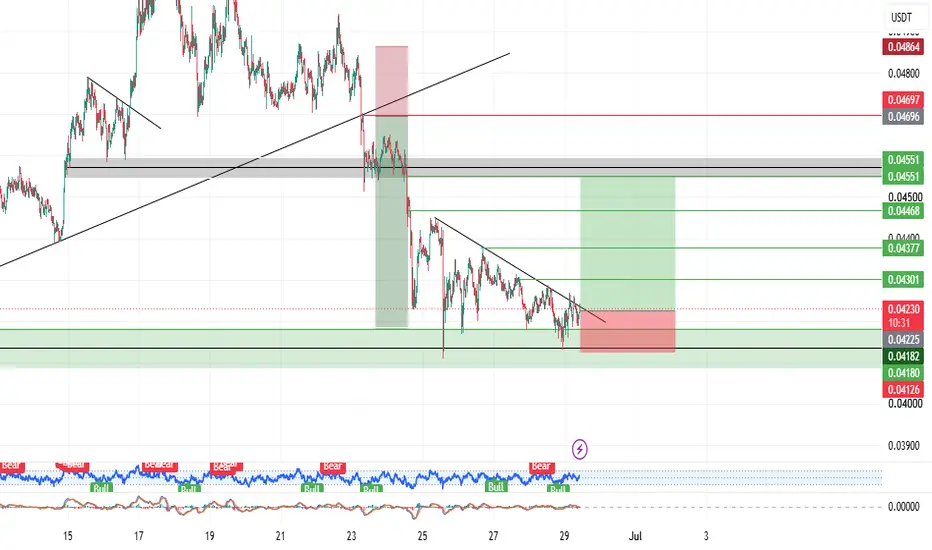
CFX USDT LONG SIGNALCFX/USDT – Trade Setup (LONG)
📈 Position Type: long
🕒 Timeframe: 1 H
📊 Market: Futures
💰 Entry Zone:
0.04225
🛑 Stop-Loss:
0.04125
🎯 Take-Profit Targets:
• TP1: 0.043
• TP2: 0.07377
• TP3: 0.04468
• TP4: 0.04550
TP5:
TP6:
⚙️ Leverage:
5-10
⚠️ After reaching TP1, move Stop-Loss to Entry Price.
📌 Risk Management:
Risk only 1–2% of your capital per trade.
Always confirm the setup on your chart before entry
#CVXUSDT : Long-Term Breakout Signals Massive Upside Potentia
#CVX
The price is moving within a descending channel on the 1-hour timeframe and has reached the lower boundary. It is now poised for a bounce and is expected to retest this boundary.
The Relative Strength Index (RSI) indicates a downward trend, which is likely to continue given the overbought conditions.
There is a key support zone in green at 0.03800. The price has bounced off this zone several times, making it a strong support level.
The price is trending towards the 100-period moving av
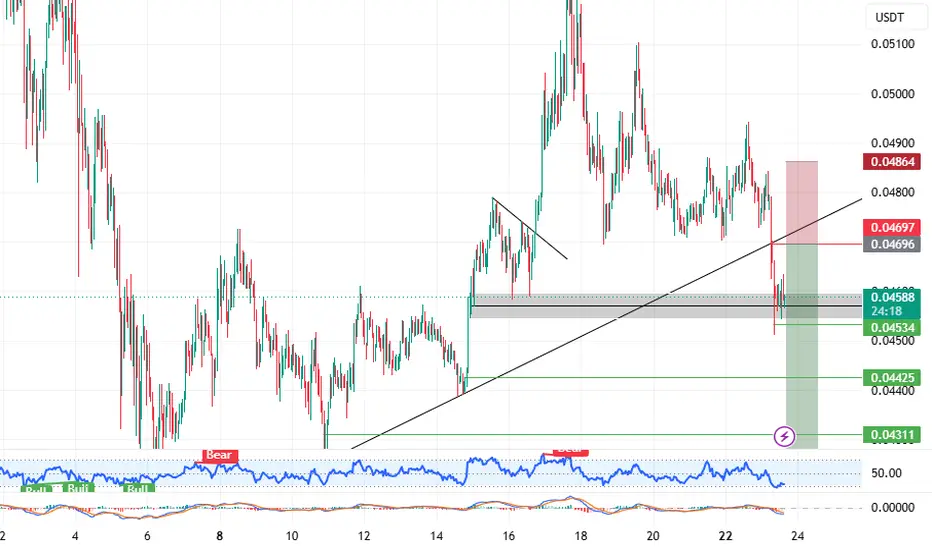
CFX USDT SHORT SIGNALCFX/USDT – Trade Setup (SHORT)
📈 Position Type: short
🕒 Timeframe: 1 H
📊 Market: Futures
💰 Entry Zone:
0.04694
🛑 Stop-Loss:
0.04865
🎯 Take-Profit Targets:
• TP1: 0.04537
• TP2: 0.04425
• TP3: 0.04311
• TP4: 0.04180
TP5:
⚙️ Leverage:
5–10
⚠️ After reaching TP1, move Stop-Loss to Entry Price.
📌 Risk Management:
Risk only 1–2% of your capital per trade.
Always confirm the setup on your chart before entry
#CFXUSDT — Symmetrical Triangle: Ready for a Rally or a Breakd#CFX
The price is moving within a descending channel on the 1-hour timeframe and has reached the lower boundary. It is now poised for a bounce and is expected to retest this boundary.
The Relative Strength Index (RSI) indicates a downward trend, which is likely to continue given the overbought conditions.
There is a key support zone in green at 0.0407. The price has bounced off this zone several times, making it a strong support level.
The price is trending towards the 100-period moving aver
#CFXUSDT — Symmetrical Triangle: Ready for a Rally or a Breakd#CFX
The price is moving within a descending channel on the hourly timeframe. It has reached the lower boundary and is trending towards a bounce. A retest of this boundary is expected.
The Relative Strength Index (RSI) indicates a downward trend, and this trend is likely to continue due to the overbought condition.
A key support zone has been identified in green at 0.04791. The price has bounced off this zone several times, making it a strong support level.
The price is trending towards the
Conflux Token (CFX) · Extended consolidation at bottom pricesConsolidation at bottom prices continues. The longer this phase lasts, the stronger the bullish wave that follows.
On CFXUSDT, there is a perfect double-top eight months apart, December 2024 vs July 2025, and this would be the main resistance on a bullish wave based on TA, a price tag around $0.28. But, this is only a portion of the chart. If you zoom out, you can see more.
Based on the duration of the last market phase, the current chart structure, Bitcoin and the rest of the altcoins, we can
#CFXUSDT — Symmetrical Triangle: Ready for a Rally or a Breakd#CFX
The price is moving within a descending channel on the 1-hour timeframe and has reached the lower boundary. It is now poised for a bounce and is expected to retest this boundary.
The Relative Strength Index (RSI) indicates a downward trend, which is likely to continue given the overbought conditions.
There is a key support zone in green at 0.05180. The price has bounced off this zone several times, making it a strong support level.
The price is trending towards the 100-period moving ave