#CGPTUSDT - READY TO FLY ?#CGPT
The price is moving within a descending channel on the 1-hour timeframe and has reached the lower boundary. It is now poised for a bounce and is expected to retest this boundary.
The Relative Strength Index (RSI) indicates a downward trend, which is likely to continue given the overbought conditions.
There is a key support zone in green at 0.01746. The price has bounced off this zone several times, making it a strong support level.
The price is trending towards the 100-period moving average, which we are approaching. This trend supports an upward move.
Entry Price: 0.01890
Target 1: 0.01925
Target 2: 0.01977
Target 3: 0.02028
Stop Loss: At the resistance zone in green
Remember this simple rule: Money management.
Any questions? Please leave a comment.
Thank you.
In-depth trading ideas
#CGPTUSDT - READY TO FLY ?#CGPT
The price is moving within a descending channel on the 1-hour timeframe and has reached the lower boundary. It is now poised for a bounce and is expected to retest this boundary.
The Relative Strength Index (RSI) indicates a downward trend, which is likely to continue given the overbought conditions.
There is a key support zone in green at 0.01785, and the price has bounced off this zone several times, making it a strong support level.
The price is trending towards the 100-period moving average, which we are approaching. This trend supports an upward move.
Entry Price: 0.01931
Target 1: 0.01966
Target 2: 0.02000
Target 3: 0.02044
Stop Loss: At the resistance zone in green
Remember this simple rule: Money management.
Any questions? Please leave a comment.
Thank you.
#CGPTUSDT - READY TO FLY ?#CGPT
The price is moving within a descending channel on the 1-hour timeframe and has reached the lower boundary. It is now poised for a bounce and is expected to retest this boundary.
The Relative Strength Index (RSI) indicates a downward trend, which is likely to continue given the overbought conditions.
There is a key support zone (in green) at 0.01785. The price has bounced off this zone several times, making it a strong support level.
The price is trending towards the 100-period moving average, which we are approaching. This trend supports an upward move.
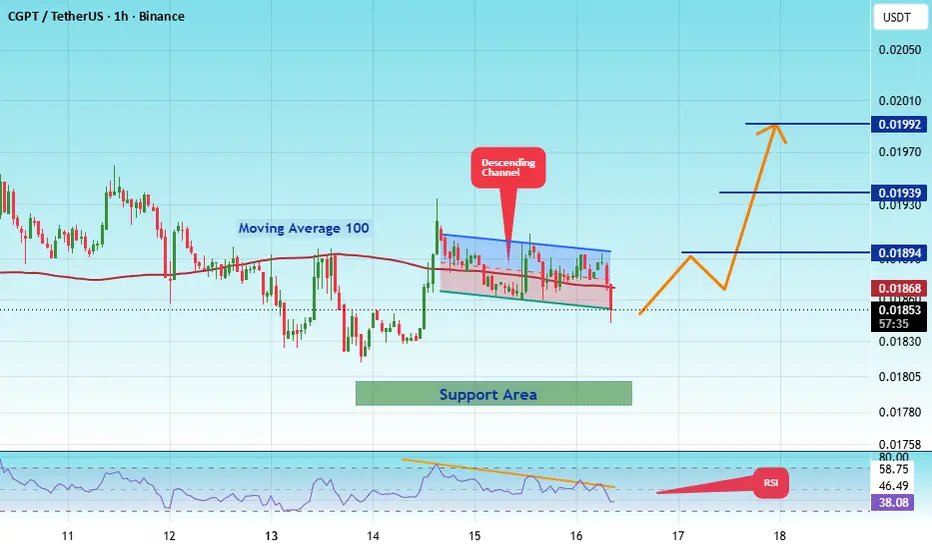
Entry Price: 0.01853
Target 1: 0.01894
Target 2: 0.01939
Target 3: 0.01992
Stop Loss: At the resistance zone (in green)
Remember this simple rule: Money management.
Any questions? Please leave a comment.
Thank you.
#CGPTUSDT - READY TO FLY ?#CGPT
The price is moving within a descending channel on the 1-hour timeframe and has reached the lower boundary. It is now poised for a bounce and is expected to retest this boundary.
The Relative Strength Index (RSI) indicates a downward trend, which is likely to continue given the overbought conditions.
There is a key support zone (in green) at 0.01666. The price has bounced off this zone several times, making it a strong support level.
The price is trending towards the 100-period moving average, which we are approaching. This trend supports an upward move.
Entry Price: 0.01827
Target 1: 0.01858
Target 2: 0.01915
Target 3: 0.01984
Stop Loss: At the resistance zone (in green)
Remember this simple rule: Money management.
Any questions? Please leave a comment.
Thank you.
#CGPTUSDT - READY TO FLY ?#CGPT
The price is moving within a descending channel on the 1-hour timeframe and has reached the lower boundary. It is now poised for a bounce and is expected to retest this boundary.
The Relative Strength Index (RSI) indicates a downward trend, which is likely to continue given the overbought conditions.
There is a key support zone (in green) at 0.01613. The price has bounced off this zone several times, making it a strong support level.
The price is trending towards the 100-period moving average, which we are approaching. This trend supports an upward move.
Entry Price: 0.01810
Target 1: 0.01860
Target 2: 0.01940
Target 3: 0.02045
Stop Loss: At the resistance zone (in green)
Remember this simple rule: Money Management.
Any questions? Please leave a comment.
Thank you.
#CGPTUSDT - READY TO FLY ?#CGPT
The price is moving within a descending channel on the 1-hour timeframe and has reached the lower boundary. It is now poised for a bounce and is expected to retest this boundary.
The Relative Strength Index (RSI) indicates a downward trend, which is likely to continue given the overbought conditions.
There is a key support zone (in green) at 0.01800. The price has bounced off this zone several times, making it a strong support level.
The price is trending towards the 100-period moving average, which we are approaching. This trend supports an upward move.
Entry Price: 0.01900
Target 1: 0.01933
Target 2: 0.01968
Target 3: 0.02013
Stop Loss: At the resistance zone (in green)
Remember this simple rule: Money management.
Any questions? Please leave a comment.
Thank you.
#CGPTUSDT - READY TO FLY ?#CGPT
The price is moving within a descending channel on the 1-hour timeframe and has reached the lower boundary. It is now poised for a bounce and is expected to retest this boundary.
The Relative Strength Index (RSI) indicates a downward trend, which is likely to continue given the overbought conditions.
A key support zone has been identified in green at 0.01780. The price has bounced off this zone several times, making it a strong support level.
The price is trending towards the 100-period moving average, which we are approaching. This trend supports an upward move.
Entry Price: 0.01980
First Target: 0.02032
Second Target: 0.02088
Third Target: 0.02168
You can close at the second target or wait for the third target to be reached. The choice is yours.
Stop Loss: At the resistance zone in green.
Remember this simple rule: Money Management.
Any questions? Please leave a comment.
Thank you.
#CGPTUSDT - READY TO FLY ?#CGPT
The price is moving within a descending channel on the 1-hour timeframe and has reached the lower boundary. It is now poised for a bounce and is expected to retest this boundary.
The Relative Strength Index (RSI) indicates a downward trend, which is likely to continue given the overbought conditions.
There is a key support zone in green at 0.01968. The price has bounced off this zone several times, making it a strong support level.
The price is trending towards the 100-period moving average, which we are approaching. This trend supports an upward move.
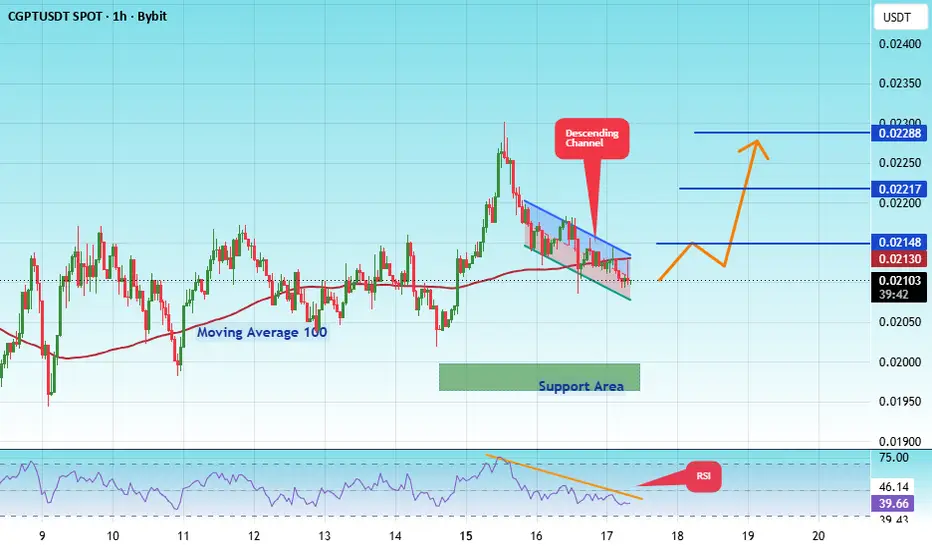
Entry Price: 0.02100
Target 1: 0.02148
Target 2: 0.02217
Target 3: 0.02288
Stop Loss: At the resistance zone in green
Remember this simple rule: Money management.
Any questions? Please leave a comment.
Thank you.
#CGPTUSDT - READY TO FLY#CGPT
The price is moving within a descending channel on the 1-hour timeframe and has reached the lower boundary. It is now poised for a bounce and is expected to retest this boundary.
The Relative Strength Index (RSI) indicates a downward trend, which is likely to continue given the overbought conditions.
There is a key support zone in green at 0.01780. The price has bounced off this zone several times, making it a strong support level.
The price is trending towards the 100-period moving average, which we are approaching. This trend supports an upward move.
Entry Price: 0.02089
Target 1: 0.02140
Target 2: 0.02216
Target 3: 0.02320
Stop Loss: At the resistance zone in green
Remember this simple rule: Money management.
Any questions? Please leave a comment.
Thank you.
#CGPTUSDT - READY TO FLY ?#CGPT
The price is moving within a descending channel on the 1-hour timeframe and has reached the lower boundary. It is now poised for a bounce and is expected to retest this boundary.
The Relative Strength Index (RSI) indicates a downward trend, which is likely to continue given the overbought conditions.
There is a key support zone in green at 0.01700. The price has bounced off this zone several times, making it a strong support level.
The price is trending towards the 100-period moving average, which we are approaching. This trend supports an upward move.
Entry Price: 0.02010
First Target: 0.02067
Second Target: 0.2166
Third Target: 0.02289
Stop Loss: At the resistance zone in green
Remember this simple rule: Money management.
Any questions? Please leave a comment.
Thank you.
#CGPTUSDT - READY TO FLY#CGPT
The price is moving within a descending channel on the 1-hour timeframe and has reached the lower boundary. It is now poised for a bounce and is expected to retest this boundary.
The Relative Strength Index (RSI) indicates a downward trend, which is likely to continue given the overbought conditions.
There is a key support zone in green at 0.02267. The price has bounced off this zone several times, making it a strong support level.
The price is trending towards the 100-period moving average, which we are approaching. This trend supports an upward move.
Entry Price: 0.02526
First Target: 0.02640
Second Target: 0.02754
Third Target: 0.02896
You can stop at the first and second targets and close the price, or continue towards the third target. Stop Loss: At the resistance zone in green.
Remember this simple rule: Money Management.
Any questions? Please leave a comment.
Thank you.
#CGPTUSDT - READY TO FLY#CGPT
The price is moving within a descending channel on the 1-hour timeframe and has reached the lower boundary. It is now poised for a bounce and is expected to retest this boundary.
The Relative Strength Index (RSI) indicates a downward trend, which is likely to continue given the overbought conditions.
There is a key support zone in green at 0.02180. The price has bounced off this zone several times, making it a strong support level.
The price is trending towards the 100-period moving average, which we are approaching. This trend supports an upward move.
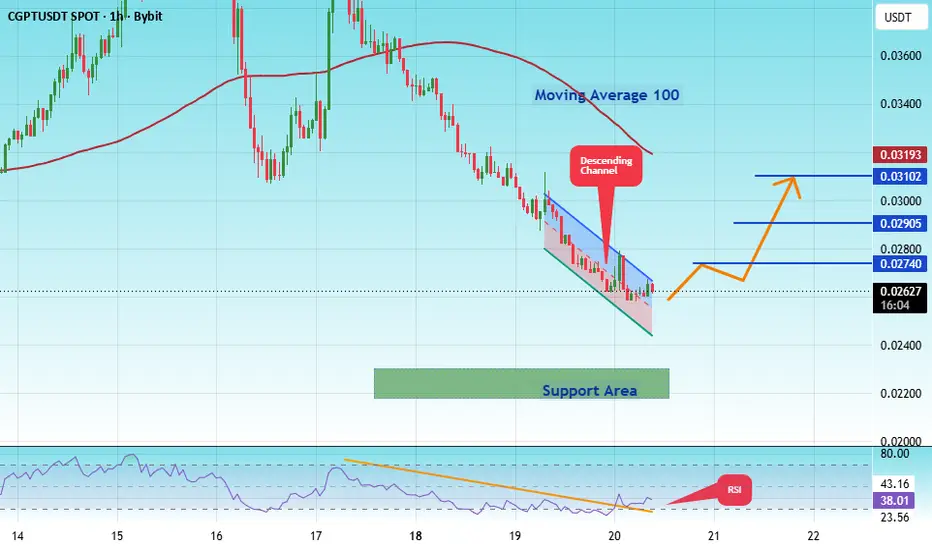
Entry Price: 0.02550
First Target: 0.02740
Second Target: 0.02900
Third Target: 0.03100
You can stop at the first and second targets and close the price, or continue towards the third target. Stop Loss: At the resistance zone in green.
Remember this simple rule: Money Management.
Any questions? Please leave a comment.
Thank you.
CGPTUSDT.P: short setup from daily support at 0.03042BINANCE:CGPTUSDT.P is clearly being held down. After a sharp one-day drop, the asset simply couldn't recover. There was an attempt, but it ended with a decline back to the drop's stopping point at 0.03042.
Seeing this buyer weakness, I am counting on a good short in the near future, especially considering the pip-for-pip strike into the level a few hours ago.
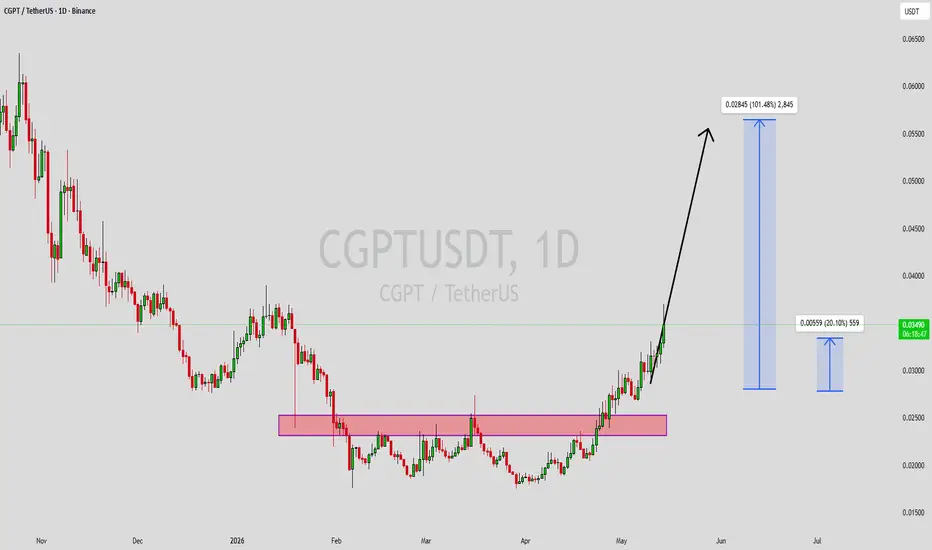
CGPTUSDT Forming Bullish MomentumCGPTUSDT is forming a clear bullish momentum pattern, a classic bullish continuation signal that often suggests a potential breakout could be approaching soon. The price has been consolidating within a tightening range, indicating that selling pressure is gradually weakening while buyers continue to regain strength near important support levels. This type of structure is commonly associated with accumulation phases before a stronger upward move begins.
The projected breakout from this bullish momentum structure could lead to an upward move of around 90% to 100% if the price confirms above the resistance zone with strong volume support. This pattern is often seen after corrective phases and may signal a transition from bearish sentiment toward a renewed bullish trend.
Traders closely watching CGPTUSDT are noticing strengthening momentum as the price approaches a key breakout area. The healthy trading volume adds confidence to the setup, showing that buyers may be accumulating positions in anticipation of a bullish continuation move.
Growing investor interest in CGPTUSDT reflects rising confidence in both its technical setup and future growth potential. If the breakout confirms with sustained buying pressure and strong follow-through momentum, this could mark the beginning of a fresh bullish wave.
✅ Show your support by hitting the like button and
✅ Leaving a comment below! (What is your opinion about this coin?)
Your feedback and engagement keep me inspired to share more insightful market analysis with you!
#CGPTUSDT - READY TO FLY#CGPT
The price is moving within a descending channel on the 1-hour timeframe and has reached the lower boundary. It is now poised for a bounce and is expected to retest this boundary.
The Relative Strength Index (RSI) indicates a downward trend, which is likely to continue given the overbought conditions.
There is a key support zone (in green) at 0.02490. The price has bounced off this zone several times, making it a strong support level.
The price is trending towards the 100-period moving average, which we are approaching. This trend supports an upward move.
Entry Price: 0.02720
First Target: 0.02800
Second Target: 0.02891
Third Target: 0.02977
You can stop at the first and second targets and close below them, or continue towards the third target. Stop Loss: At the resistance zone (in green).
Remember this simple rule: Money Management.
Any questions? Please leave a comment.
Thank you.
#CGPT/USDT - READY TO FLY#CGPT
The price is moving within a descending channel on the hourly timeframe. It has reached the lower boundary and is heading towards a breakout, with a retest of the upper boundary expected.
The Relative Strength Index (RSI) is showing a downward trend, approaching the lower boundary, and an upward bounce is anticipated.
There is a key support zone in green at 0.02844. The price has bounced from this level several times and is expected to bounce again.
The RSI is showing a trend towards consolidation above the 100-period moving average, which we are approaching, supporting the upward move.
Entry Price: 0.02962
Target 1: 0.03018
Target 2: 0.03093
Target 3: 0.03177
Stop Loss: Below the green support zone.
Remember this simple thing: Money management.
For any questions, please leave a comment.
Thank you.
CGPTUSDT 1D#CGPT has broken above the falling wedge resistance and the neckline of the double bottom pattern, which is a strong bullish signal. However, the RSI is in the overbought zone, so a short-term pullback is possible before the next leg up. You can consider accumulating a small position with proper stop-loss placement. Targets:
🎯 $0.03791
🎯 $0.05020
🎯 $0.06013
🎯 $0.07005
🎯 $0.08419
🎯 $0.10220
⚠️ Always remember to use a tight stop-loss and maintain proper risk management.
CGPT/USDT — Descending Trendline: Reversal or Further Downside?On the 2D timeframe, the CGPT/USDT pair is still in a clear mid-to-long term downtrend, characterized by:
A Descending Trendline (yellow line) acting as major dynamic resistance
A consistent lower high & lower low structure
Price currently retesting the trendline from below (a critical area)
Additionally, there are key horizontal zones acting as support/resistance:
🔸 0.03600 – 0.04200 → minor resistance
🔸 0.05500 → mid-level resistance
🔸 0.07600 → strong resistance / supply zone
🔹 0.01610 → major support (low)
---
📐 Pattern Structure
This chart reflects a combination of:
1. Descending Trendline (Downtrend Structure)
Acts as the primary resistance since the beginning of the downtrend
Multiple failed breakout attempts → confirms strong selling pressure
2. Base Formation / Minor Accumulation
Price is consolidating in the lower range (around 0.02 – 0.03)
Indicates a potential early phase of reversal or relief rally
---
🟢 Bullish Scenario (Reversal / Breakout Potential)
Bullish confirmation occurs if:
Price breaks and closes strongly above the trendline
Supported by increasing volume (valid breakout)
📈 Upside targets:
0.03600 (first resistance)
0.04200 (strength confirmation)
0.05500 (mid-term target)
0.07600 (major resistance / supply zone)
💡 A break above 0.05500+ could shift the structure into a larger bullish reversal
---
🔴 Bearish Scenario (Rejection & Downtrend Continuation)
Bearish continuation occurs if:
Price fails to break the trendline (rejection at current level)
Bearish signals appear (e.g., rejection candles / bearish engulfing)
📉 Downside targets:
Return to 0.02100 – 0.02000 zone
Breakdown → towards 0.01610 (major support)
💀 If 0.01610 is broken, it opens the possibility for a new lower low and further downside continuation
---
⚖️ Conclusion
Price is currently at a key decision zone
Breakout = potential bullish reversal
Rejection = continuation of the downtrend
👉 The trendline area is the main key level — price reaction here will determine the next major move.
#CGPT #CryptoAnalysis #TechnicalAnalysis #TradingView #Altcoins #CryptoTrading #SupportResistance #Trendline #Breakout #Reversal #Bearish #Bullish #ChartAnalysis #CryptoMarket
#CGPT/USDT - READY TO FLY#CGPT
The price is moving within a descending channel on the hourly timeframe. It has reached the lower boundary and is trending towards a bounce. A retest of this boundary is expected.
The Relative Strength Index (RSI) indicates a downward trend, and this trend is likely to continue due to the overbought condition.
There is a key support zone in green at 0.02290. The price has bounced off this zone several times, making it a strong support level.
The price is trending towards the 100-period moving average, which we are approaching. This trend supports an upward move.
Entry Price: 0.02337
Target 1: 0.02370
Target 2: 0.02414
Target 3: 0.02643
Stop Loss: At the resistance zone in green
Remember this simple rule: Money management.
Any questions, please leave a comment.
Thank you.
#CGPTUSDT - READY TO FLY#CGPT
The price is moving within a descending channel on the hourly timeframe. It has reached the lower boundary and is trending towards a bounce. A retest of this boundary is expected.
The Relative Strength Index (RSI) indicates a downward trend, and this trend is likely to continue due to the overbought condition.
A key support zone has been identified in green at 0.01870, and the price has bounced off this zone several times, making it a strong support level.
The price is trending towards the 100-period moving average, which we are approaching. This trend supports a potential upward move.
Entry Price: 0.01920
First Target: 0.01956
Second Target: 0.02000
Third Target: 0.02053
Stop Loss: At the resistance zone in green
Remember this simple rule: Money management.
Any questions? Please leave a comment.
Thank you.
#CGPT/USDT - READY TO FLY#CGPT
The price is moving within a descending channel on the hourly timeframe. It has reached the lower boundary and is heading towards a breakout, with a retest of the upper boundary expected.
The Relative Strength Index (RSI) is showing a downward trend, approaching the lower boundary, and an upward bounce is anticipated.
There is a key support zone in green at 0.02300. The price has bounced from this level several times and is expected to bounce again.
The RSI is showing a trend towards consolidation above the 100-period moving average, which we are approaching, supporting the upward move.
Entry Price: 0.2370
Target 1: 0.02423
Target 2: 0.02524
Target 3: 0.02639
Stop Loss: Below the green support zone.
Remember this simple thing: Money management.
For any questions, please leave a comment.
Thank you.
#CGPT/USDT Can Rich $ 0.02268?#CGPT
The price is moving within a descending channel on the hourly timeframe. It has reached the lower boundary and is trending towards a bounce. A retest of this boundary is expected.
The Relative Strength Index (RSI) indicates a downward trend, and this trend is likely to continue due to the overbought condition.
A key support zone (in green) was found at 0.02140, and the price has bounced off this zone several times, making it a strong support level.
The price is trending towards the 100-period moving average, which we are approaching. This trend supports an upward move.
Entry Price: 0.02170
First Target: 0.07200
Second Target: 0.02236
Third Target: 0.02268
Stop Loss: At the resistance zone (in green)
Remember this simple rule: Money Management.
Any questions, please leave a comment.
Thank you.