CHIPBINANCE:CHIPUSDT.P
**Analysis:** 📊
- Current price: **~0.02932 USDT** 🔍
- Resistance: **0.03018 – 0.03050** 🚧
- Major resistance: **0.03192 – 0.03250 - 0.03500** ⛰️
- Support: **0.02933 – 0.02903** 🛡️
- Major support: **0.02837 – 0.02800** ⚓
**Bounce Zone:** 🔁
- Price is sitting near support around **0.02933 – 0.02903** 📍
- Bounce possible from current area if support holds ✅
Disclaimer: Not Financial Advice. Low Cap. ⚠️
CHIP / TetherUS
No trades
No trades
In-depth trading ideas
CHIPUSDT Forming Bullish MomentumCHIPUSDT is forming a clear bullish momentum pattern, a classic bullish wave signal that often indicates an upcoming breakout. The price has been consolidating within a narrowing range, suggesting that selling pressure is weakening while buyers are beginning to regain control. With consistent volume confirming accumulation at lower levels, the setup hints at a potential bullish breakout soon. The projected move could lead to an impressive gain of around 90% to 100% once the price breaks above the wedge resistance.
This bullish momentum pattern is typically seen at the end of downtrends or corrective phases, and it represents a potential shift in market sentiment from bearish to bullish. Traders closely watching CHIPUSDT are noting the strengthening momentum as it nears a breakout zone. The strong trading volume adds confidence to this pattern, showing that market participants are positioning early in anticipation of a reversal.
Investors’ growing interest in CHIPUSDT reflects rising confidence in the project's long-term fundamentals and current technical strength. If the breakout confirms with sustained volume, this could mark the start of a fresh bullish leg. The current market structure suggests that buyers are steadily gaining control while bearish pressure continues to weaken.
Traders might find this a valuable setup for medium-term gains, especially as the bullish momentum pattern completes and buying momentum accelerates. A confirmed breakout could attract additional attention from market participants and potentially drive the price toward significantly higher levels in the coming weeks.
✅ Show your support by hitting the like button!
✅ Leaving a comment below! (What is your opinion about this Coin?)
Your feedback and engagement keep me inspired to share more insightful market analysis with you!
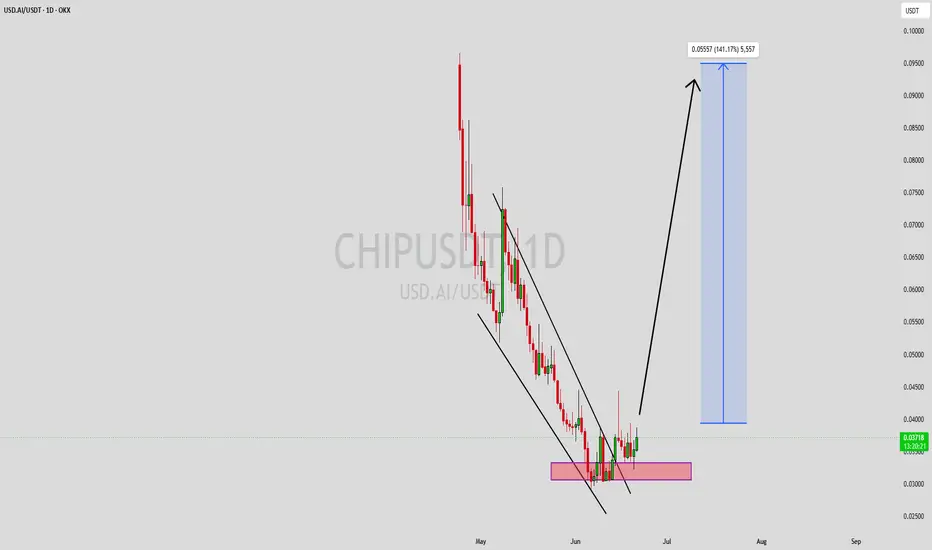
USD-AI (CHIP): ~160% Short-term —Losing is part of the gameThis is an easy chart to read and an easy target to hit. It is supposed to be easy if CHIPUSDT produces a bullish continuation.
This trading pair already produced a bottom pattern and recovery, a broken downtrend, ready to produce a new move. This new move can translate into anything. Can be a long-term uptrend, a fake breakout, short-lived, etc. Right now the chart has bullish potential though.
As usual, it looks good but things can change suddenly. Whenever I open a position I tend to define a stop-loss level. If the market moves down, after a while I just close the trade at a loss. If the market moves up, that's what we are looking for.
While I am showing the bullish potential for this and other projects it never means that this is the only possible outcome or that it must happen. It simple means that's the direction we are aiming for.
The SMA Fill indicator; it is turning green and now working as support. At the same time today's candle is trading above 0.148 Fib. extension. So there is no need to blame or cry or fight or complain if market conditions change. It is normal and it happens. We are not meant to win 100% nor 70% of the time nor any specific amount of times. We simply choose a chart setup that has high potential for rewards vs low risk.
Let's say the risk is capped at 20% and we enter this trade with $100. The maximum loss is always $20 regardless of what happens. The risk has been defined so we know what we are getting into.
If the trade resolves bullish, the target hits we get $263, that's 163% profits. A loss would result in $80 ($100 - $20). A win would result in $263 ($100 + $163).
Are we good? If you cannot handle a loss, then you cannot trade. Losing is part of the game.
Thank you for reading.
Namaste.
CHIPUSDT Forming Bullish MomentumCHIPUSDT is forming a clear bullish momentum pattern, a classic bullish wave signal that often indicates an upcoming breakout. The price has been consolidating within a narrowing range, suggesting that selling pressure is weakening while buyers are beginning to regain control. With consistent volume confirming accumulation at lower levels, the setup hints at a potential bullish breakout soon. The projected move could lead to an impressive gain of around 90% to 100% once the price breaks above the wedge resistance.
This bullish momentum pattern is typically seen at the end of downtrends or corrective phases, and it represents a potential shift in market sentiment from bearish to bullish. Traders closely watching CHIPUSDT are noting the strengthening momentum as it nears a breakout zone. The good trading volume adds confidence to this pattern, showing that market participants are positioning early in anticipation of a reversal.
Investors’ growing interest in CHIPUSDT reflects rising confidence in the project’s long-term fundamentals and current technical strength. If the breakout confirms with sustained volume, this could mark the start of a fresh bullish leg. Traders might find this a valuable setup for medium-term gains, especially as the wedge pattern completes and buying momentum accelerates.
The combination of a tightening price structure, steady accumulation, and improving momentum makes CHIPUSDT an attractive coin to watch. A successful breakout above resistance could trigger strong bullish momentum and potentially unlock substantial upside potential in the coming weeks.
✅ Show your support by hitting the like button!
✅ Leaving a comment below! (What is your opinion about this coin?)
Your feedback and engagement keep me inspired to share more insightful market analysis with you! 🚀📈
CHIP (USA-AI) Breaks Downtrend: Can Grow for MonthsNow you can buy...
When a chart setup becomes like this it is the hardest to predict when the downtrend will end. We tend to jump in and it moves lower, then again and lower it goes and this keeps on happening until we give up.
CHIPUSDT made an attempt last week to break the downtrend line but there was a rejection. Today it looks different though, the big green candle is going straight up.
The break of the downtrend can be significant. Short-term it leads to growth but, it gets better, if the bottom is in, then we get a bullish wave at the minimum which can translate into months of rising prices.
This chart setup looks good. The targets can be seen mapped on the chart. It is no coincidence though, CHIP recovers and starts to grow after Bitcoin hits bottom. You know Bitcoin will also grow.
Namaste.
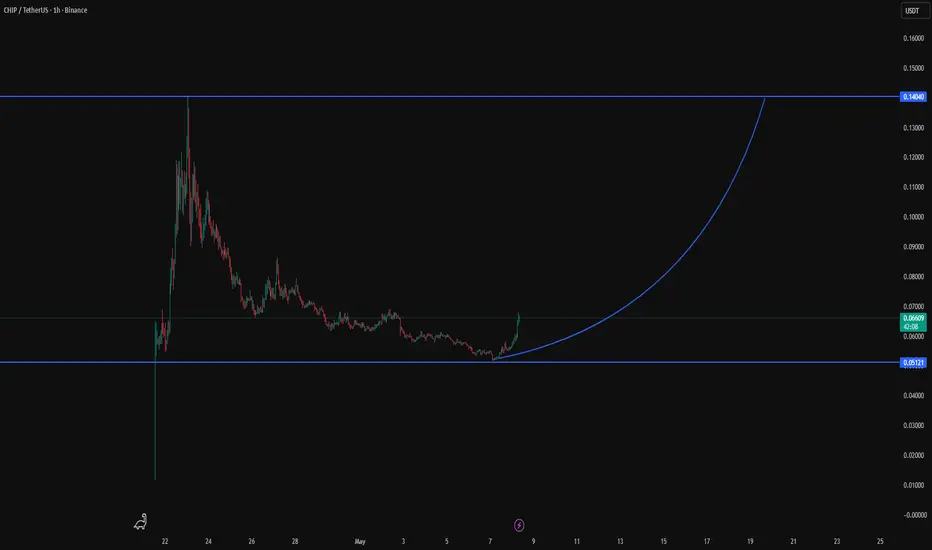
Chip up/downOn the 6H chart, CHIPUSDT appears to be forming a bullish recovery structure inside a broader downtrend, with signs of a possible ascending triangle / higher-low breakout setup.
Pattern Description
Price was in a clear descending trend, shown by the downward-sloping blue trendline and the orange moving average acting as dynamic resistance.
After reaching the low around the 0.052–0.054 zone, buyers stepped in aggressively and created a sharp rebound.
The rebound produced:
a higher low
rising support trendline
repeated tests of resistance around 0.067–0.069
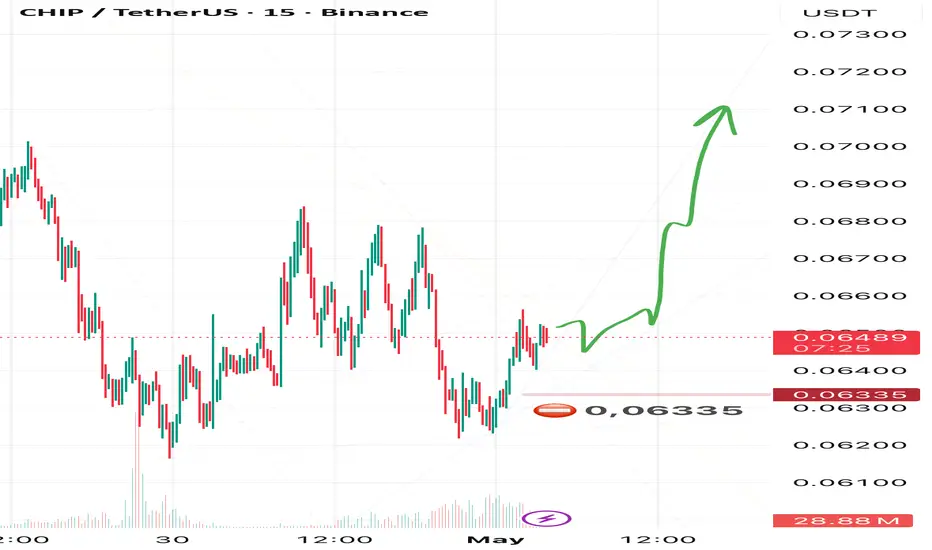
CHIP: Relief Rally or Just a Trap?CHIP / 15m setup 📊
After a short but sharp sell-off 📉 CHIP is starting to show early signs of recovery ⚡️
But don’t get too excited yet ⚠️ because this could still be just a corrective bounce, not a full reversal.
Plan 🎯
• From current levels or after a dip to 0.064 ⬇️ → looking for an impulse move
• First target: 0.067 📍
• Final target: 0.071 🚀
Confirmation ✅
• Consider entries only after a clean close above 0.065 on the 1H timeframe ⏱️
Invalidation ❌
• Any touch of 0.06335 cancels the scenario ⛔️
Structure is still fragile, context matters 🧠
Not financial advice ⚠️
Trade your own system 💼
Follow for update
CHIPUSDTSo we see an uptrend on the chart, so let's short it and take a loss.
I want you to understand my idea - take profit in this case will be an UNWANTED outcome, so I hide it behind the extreme, just as we usually hide the stop loss.
"LONG" entry 0.0828, "SL" is 0.0523, "TP" (desired price move!) is 0.1157
Lets see what happened.