Chiliz (CHZ) 100x Bull flag?Yes, 10,000%.
On the above 12 day chart price action has corrected over 60% since March. A number of reasons now exist for a long position. They include:
1) Price action and RSI resistance breakouts.
2) Support confirmation. Orange arrows. This is called a double bottom.
3) Trend reversal. A hig
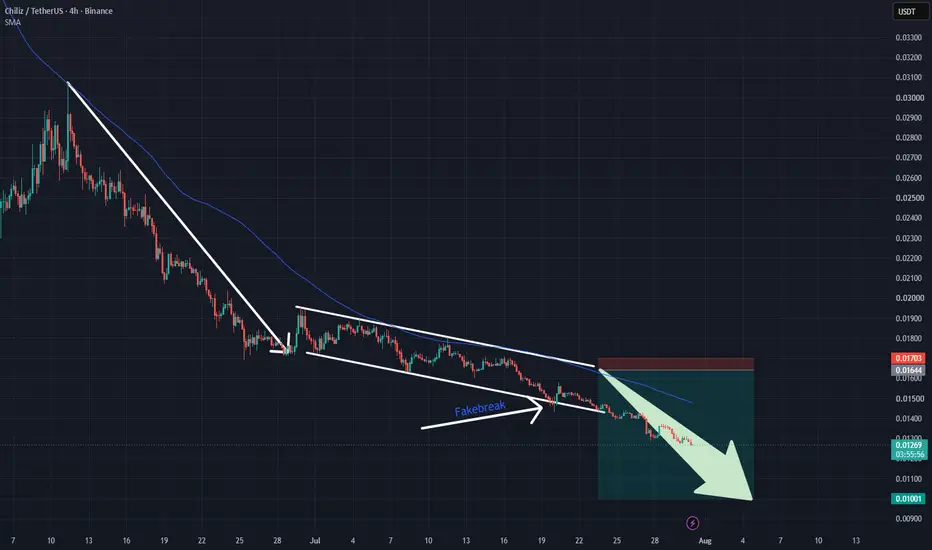
CHZ: Descending Channel Broken DecisivelyCHZ: Descending Channel Broken Decisively – Flexible Dual-Scenario Execution Strategy
Chiliz (CHZ) bypassed our anticipated technical relief bounce, plunging straight down in line with its primary bearish trajectory. Following a liquidity sweep fakebreak at the lower boundary, aggressive selling p
CHZ: Medium-Term Descending Channel DominatesCHZ: Medium-Term Descending Channel Dominates – Patient Strategy to Target an Optimal Short Setup
Chiliz (CHZ) is moving fully within a medium-term descending channel following two steep downward legs, confirming that the bears maintain primary control over the market framework. The sole positive
Chz1 Corinthians 9:24 — "Know ye not that they which run in a race run all, but one receiveth the prize? So run, that ye may obtain."
CHZ — the coin of the crowd. The stadium. The roar of nations.
When the games return. When the fans rise. When the glory of sport is felt again.
0.02 is where the prize
CHZ Bullish Breakout + Harmonic Pattern Confirmation#CHZ is showing strong bullish momentum on the 1D timeframe as a harmonic pattern has completed near a key demand zone.
Adding more confidence to the setup, price has successfully broken a major resistance level, indicating a potential continuation of the uptrend.
Technical Confluence:
Completed H
CHZ: liquidity sweep before the next leg downThe Macro Picture 🗺️
CHZ has been locked in a relentless descending structure since the May $0.052 peak, grinding out lower highs and lower lows with barely a pause. Every bounce has been shallow and quickly sold — the market is defined by persistent supply, and buyers have shown no appetite to def
CHZUSDT Important ChartCurrently squeezing and preparing for a big move on the short term, this is only a 1 hour timeframe chart and right now we are approaching the end, so this move is about to happen this week, we will throw a signal at WEEX VIP once we get a confirmation. 🚀
Click on the pinned post to join.
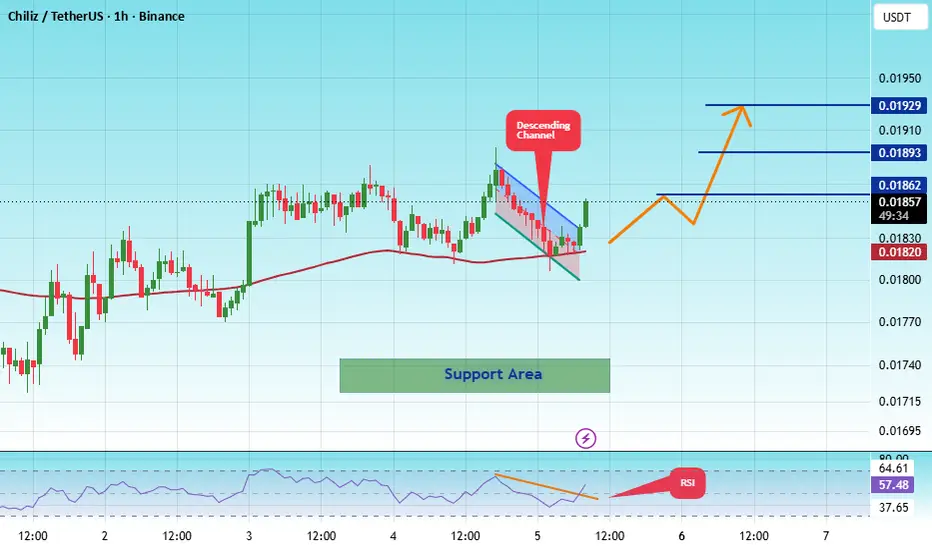
#CHZUSDT Reversal Potential Breakout & Fibonacci Retest#CHZ
The price is moving within a descending channel on the 1-hour timeframe and has reached the lower boundary. It is now poised for a bounce and is expected to retest this boundary.
The Relative Strength Index (RSI) indicates a downward trend, which is likely to continue given the overbought con
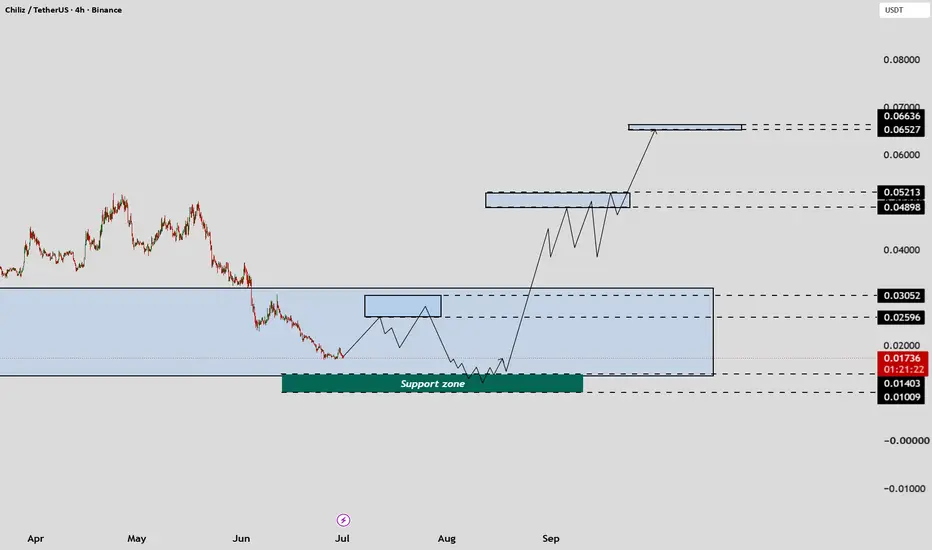
CHZUSDTCHZUSDT Analysis Update
Here's the latest update on CHZUSDT based on my current Elliott Wave count.
According to the updated wave structure, I expect the price to rally toward the $0.025 and $0.030 levels first. After reaching those zones, the market is likely to experience one final pullback into
See all ideas
Summarizing what the indicators are suggesting.
Oscillators
Neutral
SellBuy
Strong sellStrong buy
Strong sellSellNeutralBuyStrong buy
Oscillators
Neutral
SellBuy
Strong sellStrong buy
Strong sellSellNeutralBuyStrong buy
Summary
Neutral
SellBuy
Strong sellStrong buy
Strong sellSellNeutralBuyStrong buy
Summary
Neutral
SellBuy
Strong sellStrong buy
Strong sellSellNeutralBuyStrong buy
Summary
Neutral
SellBuy
Strong sellStrong buy
Strong sellSellNeutralBuyStrong buy
Moving Averages
Neutral
SellBuy
Strong sellStrong buy
Strong sellSellNeutralBuyStrong buy
Moving Averages
Neutral
SellBuy
Strong sellStrong buy
Strong sellSellNeutralBuyStrong buy
Displays a symbol's price movements over previous years to identify recurring trends.