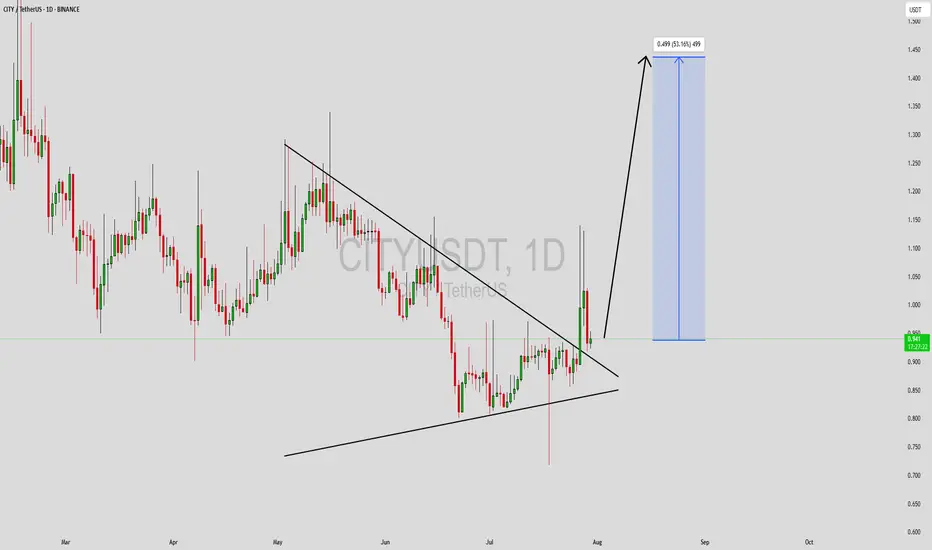
CITYUSDT 1D#CITY is facing a resistance cluster that includes the descending resistance, the Ichimoku Cloud, and the daily SMA100. Looks promising. In case of a breakout above these levels, the potential upside targets are:
🎯 $0.7077
🎯 $0.7771
🎯 $0.8464
🎯 $0.9451
🎯 $1.0709
⚠️ Always remember to use a tight s
CITY / Tether USD PERPETUAL CONTRACT
No trades
No trades
CITYUSDT 1D#CITY is trading within a falling wedge pattern on the daily timeframe. In case of a breakout above both the wedge resistance and the daily SMA50, the potential upside targets are:
🎯 $0.711
🎯 $0.780
🎯 $0.848
🎯 $0.946
🎯 $1.071
⚠️ Always use tight stop-losses and maintain strict risk management.
CITYUSDT 2D#CITY is moving inside a descending channel on the 2-day chart. Consider buying near the support zone. In case of a breakout above the channel resistance, the potential targets are:
🎯 $1.506
🎯 $1.749
🎯 $1.992
🎯 $2.339
🎯 $2.780
⚠️ As always, use a tight stop-loss and apply proper risk management.
CITYUSDT Forming Falling WedgeCITYUSDT (Manchester City Fan Token) has built a recognizable falling wedge pattern, a reliable bullish reversal formation that’s taking shape after a corrective phase. Price is narrowing between descending resistance and rising support trendlines, indicating diminishing selling pressure and growing
CITYUSDT Forming Descending ChannelCITYUSDT has recently broken out of a well-defined descending channel pattern, indicating a potential shift from a bearish trend into a bullish reversal phase. This breakout is a significant technical signal, especially when accompanied by increasing trading volume, which confirms renewed interest a
CITYUSDT UPDATE
Pattern: Falling Wedge Breakout
Current Price: \$0.9778
Target Price: \$1.39
Target % Gain: 45.03%
Technical Analysis: CITYUSDT has broken out of a falling wedge pattern on the 1D timeframe, confirming a bullish reversal. Strong bullish candles and increased volume support further upside toward t
City is on my radar)It may be in the last phase of a long-term downtrend.
I will not be surprise if there will be strong moves here.
* The purpose of my graphic drawings is purely educational.
* What i write here is not an investment advice. Please do your own research before investing in any asset.
* Never take my p
CITYUSDT is BullishPrice was in a downtrend, however the bulls seem to be gaining control of price action as a bullish divergence on daily time frame as emerged. Moreover, previous lower high is also broken and a higher high is printed instead, now if if freshly printed higher high is broken then we can expect a bulli
See all ideas
Summarizing what the indicators are suggesting.
Oscillators
Neutral
SellBuy
Strong sellStrong buy
Strong sellSellNeutralBuyStrong buy
Oscillators
Neutral
SellBuy
Strong sellStrong buy
Strong sellSellNeutralBuyStrong buy
Summary
Neutral
SellBuy
Strong sellStrong buy
Strong sellSellNeutralBuyStrong buy
Summary
Neutral
SellBuy
Strong sellStrong buy
Strong sellSellNeutralBuyStrong buy
Summary
Neutral
SellBuy
Strong sellStrong buy
Strong sellSellNeutralBuyStrong buy
Moving Averages
Neutral
SellBuy
Strong sellStrong buy
Strong sellSellNeutralBuyStrong buy
Moving Averages
Neutral
SellBuy
Strong sellStrong buy
Strong sellSellNeutralBuyStrong buy