COAIUSDT Forming Bullish MomentumCOAIUSDT is forming a clear bullish momentum pattern, a classic bullish wave signal that often indicates an upcoming breakout. The price has been consolidating within a narrowing range, suggesting that selling pressure is weakening while buyers are beginning to regain control. With consistent volume confirming accumulation at lower levels, the setup hints at a potential bullish breakout soon. The projected move could lead to an impressive gain of around 60% to 70% once the price breaks above the wedge resistance.
This bullish momentum pattern is typically seen at the end of downtrends or corrective phases, and it represents a potential shift in market sentiment from bearish to bullish. Traders closely watching COAIUSDT are noting the strengthening momentum as it nears a breakout zone. The healthy trading volume adds confidence to this setup, showing that market participants are positioning early in anticipation of a bullish reversal.
Investors' growing interest in COAIUSDT reflects increasing confidence in the project's long-term fundamentals and current technical strength. If the breakout confirms with sustained buying volume, this could mark the start of a fresh bullish leg. Traders may find this a valuable setup for medium-term gains, especially as the momentum pattern completes and buying pressure continues to accelerate.
✅ Show your support by hitting the like button and
✅ Leaving a comment below! (What is You opinion about this Coin)
Your feedback and engagement keep me inspired to share more insightful market analysis with you!
In-depth trading ideas
$COAI USD – Breakout or 4th Rejection?COAI Still Holding the Rising Support — Breakout or Another Rejection? 👀
COAI has now tested this resistance zone 3 times, and every attempt has been rejected. This tells me that sellers are still protecting this area, so I’m not expecting an easy breakout. Until we see a strong close above this resistance, I’m staying patient instead of chasing the price.
The good news is that the rising support trendline is still holding very well. Every pullback has created a higher low, which means buyers are still in control of the overall structure. As long as price respects this rising support, the bullish idea is still valid, and another move toward the resistance zone is possible.
For me, the best long setup only comes after a clean confirmation. I want to see price hold above the rising support, RSI continue moving above the 50 level with bullish momentum, and volume increase during the next push. Strong volume will show that buyers are serious, not just creating a small bounce.
The long setup will be cancelled if the rising support trendline breaks with a strong candle, RSI drops below 50 and starts showing bearish momentum, or selling volume becomes stronger than buying volume. If those conditions happen, I’ll avoid long positions and wait for a new structure instead. Right now, the trend is still bullish, but the resistance zone is the key level everyone should watch. 🚀
COAI is still undergoing a correction (12H)It appears that we have a double correction on the chart, with the second leg forming a Diametric pattern that is currently in Wave G.
It seems that Wave G has not finished yet, and the price is currently in the middle of this bearish Wave G.
There are two possible scenarios:
* Wave b of Wave G forms a Diametric and completes within the red zone.
* Wave b forms a Symmetrical pattern, sweeps the red zone, and then drops toward the targets marked on the chart.
Let's see what happens.
If you have a coin or altcoin you want analyzed, first hit the like button and then comment its name so I can review it for you.
Do you also think COAI is bearish?
COAI: Is a 35% Correction Around the Corner?COAI has delivered strong upside momentum, but after an extended rally, the risk of a deeper pullback increases significantly. If buyers fail to defend key support levels, a correction of up to 35% could be on the table.
Such retracements are common in high-volatility altcoins and often help reset market sentiment before the next major move. The key is whether COAI can maintain its current structure or if profit-taking triggers a larger decline.
Watch support zones and volume closely—confirmation is more important than prediction.
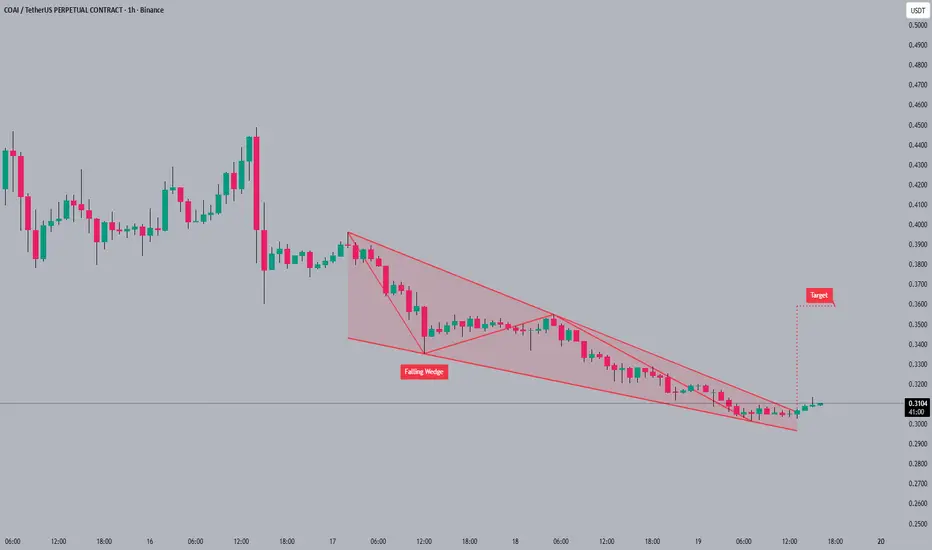
#COAI#COAI is currently trading at the bottom of a falling wedge pattern 🤔. The falling wedge is a bullish pattern that could signal an upcoming breakout. If the breakout happens, the next target is around 0.37 🚀.
It's important to be patient and wait for confirmation before entering a trade 🧘.
#COAI #crypto #trading #altcoin
07-04-26 COAIThe blue line represents an area that previously served as a strong support floor before being impulsively broken through. In theory, when the price returns to it, it will act as a ceiling (resistance).
A diagonal line indicates a short-term uptrend (minor trend). The current price appears to be attempting to break this trend line downwards.
If the price is unable to bounce back to $0.3000 and instead breaks through the local low at $0.2811, then the entry scenario at the blue line may not be picked up.
Volume during the last bounce (early April) appears quite stable. There are no signs of significant distribution (high selling volume) in the current area. Wait for a surge in selling volume to confirm that this short-term uptrend is over.
The challenge is simply to be patient in waiting for the price to pick up the area or deciding whether to chase the price if it immediately dives from the current level.
COAI/USDT - Reversal Setup from Descending TrendlinePrice is approaching a key breakout point after a prolonged downtrend, with resistance trendline getting weaker on each test. Holding above current support suggests potential reversal. A confirmed breakout could drive price toward the 0.50+ zone. Invalidation below recent lows.
Thank you for 1000 Followers! It has been quite a Journey....1,000 followers!!!!
To everyone who has followed, studied the charts, engaged with the ideas, and taken the time to use and give feedback on my Pine Scripts — thank you. Every interaction has made the analysis sharper and the tools better.
This journey has been about one thing: showing up with quality. No noise, no hype — just clean setups, honest analysis, and tools built the way serious traders think.
We are just getting started. Expect more refined setups, deeper market breakdowns, and even more powerful scripts ahead.
Stay locked in. The best ideas are still coming.
— ifiok trades
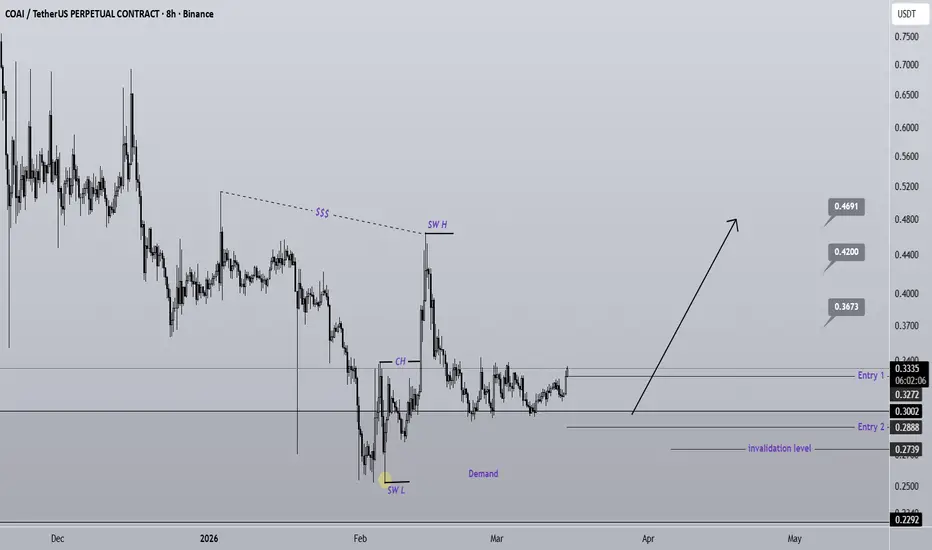
COAI may become super bullish (8H)Before anything else, when trading volatile and high risk coins, you must follow proper risk management and control your exposure.
We have a bullish CH on the chart, which indicates the presence of buyers.
There is also a liquidity pool above the price, which may be swept soon.
The price has reached a strong support zone. It appears that sufficient buy orders may have been accumulated in this area.
A bullish trigger has appeared on the chart, and the price may soon experience bullish movement.
Two entry points have been identified for opening a buy position, and the position should be entered using a DCA (Dollar-Cost Averaging) strategy.
The targets are marked on the chart.
A daily candle closing below the invalidation level will invalidate this analysis.
If you would like us to analyze a coin or altcoin for you, first like this post, then comment the name of your altcoin below.
What is your opinion about this altcoin?
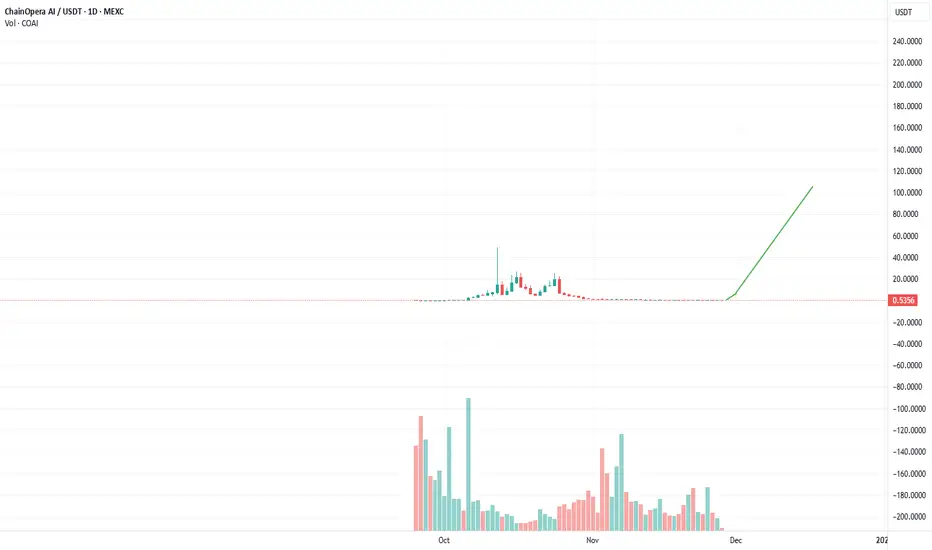
COAIUSDT Post Crash Base Forming for Next MoveCOAIUSDT previously delivered an exceptional parabolic expansion of approximately 162x, followed by a sharp mean-reversion that erased nearly 98% of the advance. After this aggressive drawdown, price action has stabilized and transitioned into a potential consolidation phase, suggesting that the market is attempting to rebuild structure.
The ongoing pullback appears corrective in nature rather than impulsive, indicating early signs of a continuation setup. As long as the key structural support highlighted on the chart remains intact, the bullish bias is preserved, and the next expansion leg is expected to drive price toward the projected target zone.
A clear invalidation level is defined to control risk should the structure fail.
Correction Finally Complete?In a previous analysis, I was looking forward to a C wave rally toward recent highs after price reacted to the 88.6% fib level. Unfortunately, there wasn’t enough follow through. Seeing as though most alt coins are starting to make their moves, it’s plausible that it’s COAI’s turn after reaching the accumulation zone before the last explosive rally.
New wave C targets:
1- 22.86
2- 31.45 (most probable: 138% extension)
3- 36.76
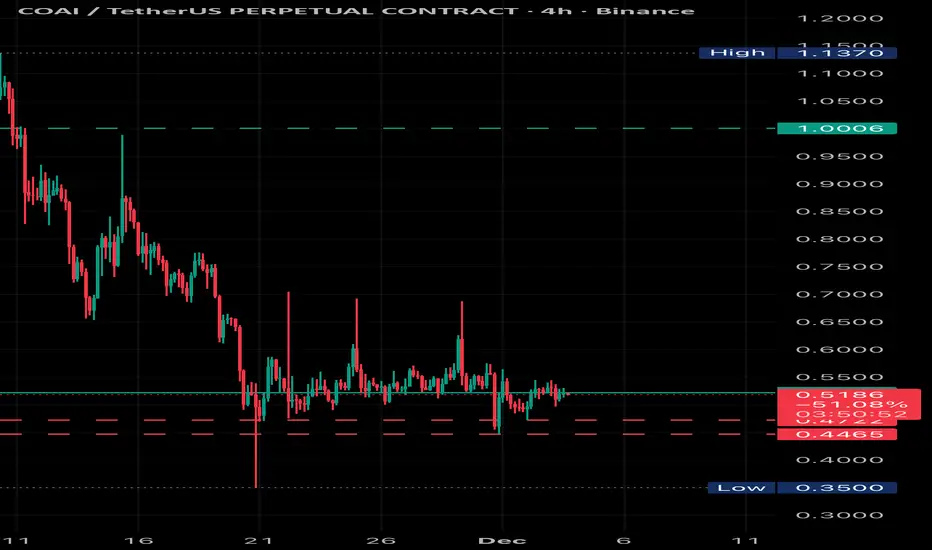
COAI in Accumulation – Range Expansion SetupCOAI has transitioned into a clear accumulation phase after the impulsive move and subsequent decline. Price is currently trading within a defined range, indicating balance between buyers and sellers.
The next significant move will come from a range expansion.
A breakout above the upper boundary of the accumulation would open the way for a bullish continuation, with a long target around $1.00.
If the accumulation range breaks down to the downside , bearish continuation becomes likely, with a downside target near $0.33.
Until a decisive breakout occurs, price remains range-bound and patience is key.
Key levels: Range high / Range low
COAI Trade Plan & Risk
🔸 Preferred Setup: Long reclaim (ATH hunt scale-in).
🔸 Entry Zone
Long: 0.5278–0.53 reclaim (POC absorption).
🔸 Stop (Invalidation)
Longs: below 0.48 (FVG fail).
🔸 Targets
Long TP1: Squeeze 1.00 (liq cluster).
Long TP2: Extended 5.00 (pre-ATH).
Long TP3: ATH+ 45.00 (narrative moon).
🔸 Position Sizing
0.5-1% risk initial; scale to 3% on conf; derate 15% for concentration.
🔸 Risk Flags
• Whale dump (82% dom).
• BTC <92K macro.
• Fakeout squeeze low.
🔸 Flip Conditions
Bear: Hold <0.53 POC.
🔸 Alternative Scenario
Sweep 0.35 → reverse short to 0.60.
🔸 Model Self-Critique
1. Prediction variance high (bear/bull split).
2. Low circ supply inflates MC upside risk.
What IsThe Rebuy Range For The COAI ? (4H)⚠️ First of all, note that this coin is highly volatile and risky, so don’t forget to manage your position size, leverage, and risk.
⚠️ Considering the number of wave extensions and irregular candling, this coin doesn’t have a single scenario, but the scenario on the chart is the most probable one.
⚠️ This setup is not a sell/short; it is a buy/long.
It seems a double correction on COAI is completing, and we are currently in the second part of the correction, which is a diametric. We appear to be in wave D of this diametric, which is nearing completion.
We are only buyers of COAI in the green zone.
Targets are marked on the chart. Take profit step by step at the targets, and after reaching the first target, move your stop-loss to the entry zone.
A daily candle closing below the invalidation level will invalidate this analysis.
For risk management, please don't forget stop loss and capital management
When we reach the first target, save some profit and then change the stop to entry
Comment if you have any questions
Thank You
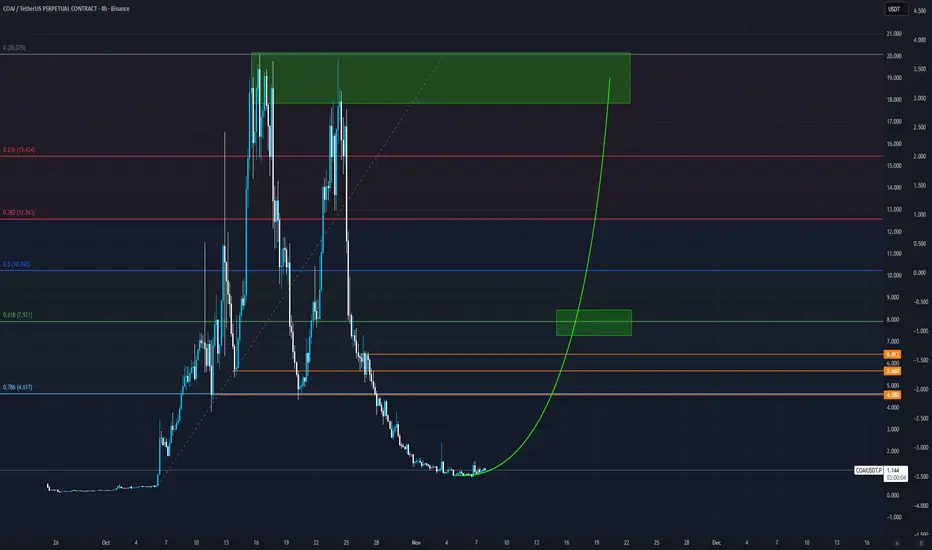
COAI Possible Elliot Wave CountCOAI recently broke above the descending trend line after hitting the 78.6 fibonacci retracement of the sharp move up in early October. The chart can be interpreted as 5 waves up and 3 down, potentially creating a long opportunity up to recent high and perhaps even larger if this is the start of a larger cycle.
Alternatively, this retracement could also be a B wave, in which case a rally is still expected.
A sustained break above $0.99 will be needed as a first signal of trend reversal.
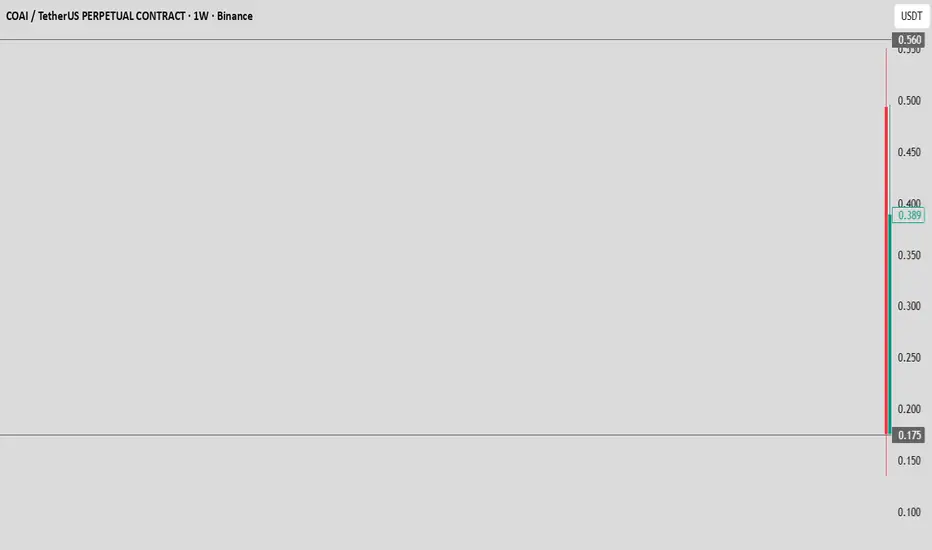
COAIWe can see an extremely large spike to the upside (up to ~0.56–1.2 USDT).
This is followed by an extremely large red breakdown.
In recent weeks, the price dropped to 0.175 USDT and then bounced back to around 0.39 USDT.
This is not a normal trend but a liquidity event → likely manipulation by a big player (a whale or a market maker).
HIgh risk - High reward – COAI📈 HIgh risk - High reward – COAI
RSI is heavily oversold on both the 1h and 4h timeframes, with a clear bullish divergence forming on the 15m. Price has experienced a deep and extended decline from the local high, signaling exhaustion of selling pressure. A recovery bounce from this zone is highly probable. This is a high-risk, high-reward setup, requiring strict adherence to the stop-loss.
🎯 Trade Setup:
Take Profit (TP): 9.831
Stop Loss (SL): 0.438
Risk/Reward Ratio (RR): 1 : 26.23
A disciplined long entry targeting a strong rebound driven by extreme oversold conditions and bullish divergence.
COAIUSDT.P: short setup from daily support at 0.831BINANCE:COAIUSDT.P is currently trading near its historical lows.
The setup looks ambiguous: on one hand, there are signals supporting a continuation of the short trend;
on the other, we might be seeing parabolic-style accumulation.
In any case, a local 5:1 move looks realistic in my view.
The chart stands out because on the lower timeframe, the price hit the support level almost to the tick,
a level formed a few days ago when the asset halted its drop and entered consolidation.
Such precise touches usually indicate a limit player positioned at the level —
and if that level gets broken, the asset could fall sharply.
I expect low volatility near the level,
and an additional confirmation would be a daily close below the current bar’s low or right at the level.
Key factors for this scenario:
Global & local trend alignment
Volatility contraction on approach
Price void / low liquidity zone beyond level
Momentum stall at the level
Immediate retest
No reaction after a false
Closing near the level
COAI IdeaSo currently COAI is doing the impossible. Gaining volume and open interest still after dipping from 60$ to 0.78$ . My entry is currently at 0.97$ of course there are a lot of scalping options but they won't give me a nicer entry. So with open interest rising we still could see some nice pumps before the party ends.