Coffee — Weekly FVG LongBias: Long
Coffee has shown proven strength on the higher timeframe. Displacement higher confirms the bullish HTF profile, and the buy side liquidity at 435.92 is the clear draw on liquidity.
The setup
The Weekly FVG (284.21 – 297.20) is the POI. Price is not required to retrace this deep — but if it does, this is the most likely zone for reversal. I'm not chasing current price. The entry only exists if the market offers it.
Entry: Weekly FVG, 284.21 – 297.20
Invalidation: Weekly close below 239.62
Target: Buy side liquidity at 435.92
Time horizon
Slow setup. The retrace may take up to a month to develop, and delivery toward the draw could take 2–4 months.
No retrace into the FVG, no trade.
In-depth trading ideas
Coffee CFD ($COFFEE) Update: Another 2RR Target Secured! Coffee CFD ( PEPPERSTONE:COFFEE ) Update: Another 2RR Target Secured! – Strategic Rejection at Upper LTB Signals Macro Bearish Continuation toward 22,000
### ☕ Coffee C CFD Daily Technical Matrix (Ref: COFFEE_2026-06-19_09-21-50.png)
Consistency is the core foundation of our framework at ChartPro Data. We are thrilled to announce that **our previous short-term trade study has officially captured its full 2RR take-profit target!** Following this precise structural completion, we are delivering an immediate tactical update as the commodity pivots at a crucial structural milestone.
Coffee C CFD is experiencing intense institutional selling pressure during today's session, plummeting **-3.39% to print at 26,595.3**.
---
### 🔍 Structural Geometry & Multi-Line Rejection:
1. **The Upper Descending LTB Test:** The recent local counter-trend rally expanded directly into the dominant overhead Descending Trendline (the upper parallel red LTB line) defining the primary multi-month bearish channel.
2. **Moving Average Confluence Layer:** This diagonal boundary beautifully intersected with the dynamic resistance of the **72-period SMA (red line at 28,094.8)**. The price printed a sharp, high-volume rejection shadow precisely at this confluence node, validating a massive block of institutional supply orders.
3. **Macro Trend Dominance:** The broader, higher-timeframe trend remains heavily bearish, structurally anchored by price action sustained far below the institutional long-term **200-period EMA (purple line at 30,751.4)**.
---
### 📉 The Macro Road Map: Targeting the Channel Baseline
With the local counter-trend bounce now officially exhausted and rejected, the market sentiment points definitively toward a strong re-alignment with the master **MACRO trend**:
* **The Bearish Vector Acceleration:** The immediate order flow has flipped back to absolute sell-dominance (as modeled by our prominent downward red projection arrow).
* **The Ultimate Destination (22,000 Region):** The primary structural and mathematical target for this expanding downward wave sits at the lower parallel boundary of our macro channel. We project a steady leg down to sweep liquidity near the major historical support corridor around the **22,000.0** psychological level.
### Tactical Summary:
Chasing counter-trend longs in this environment is highly inefficient. The technical playbook favours managing short positions or utilising any minor local intraday pullbacks to position in favour of the macro trend, defining risk strictly above the recent rejection high near the 72 SMA.
---
📊 **ChartPro Data** | By Rogerio Zaglia
*Soft Commodities Architecture, Systematic Trend Re-Alignment & Mathematical Target Sourcing.*
⚠️ **Disclaimer:** For educational and informational purposes only. This technical update represents a personal trading framework and does not constitute financial or investment advice.
Coffee Daily Update: 1:1 Risk/Reward Milestone Achieved – 50% PrCoffee Daily Update: 1:1 Risk/Reward Milestone Achieved – 50% Profits Secured & Stop Moved to Entry
### ☕ Coffee C Daily Active Trade Update (Ref: COFFEE_2026-06-16_08-39-46.png)
We are publishing a systematic risk-management update for our active Coffee C long position ( PEPPERSTONE:COFFEE - FOREX.com), which was originally structured and shared on **June 11, 2026**.
### 📈 Structural Advance & 1:1 RR Intersection
* **The Reversal Validated:** Our tactical mean-reversion framework off the lower channel boundary has generated powerful follow-through. Driven by today's bullish daily candle advancing **+2.22%**, price action has extended to print at **25,939.8**.
* **Partial Target Hit:** This upward impulse has hit our intermediate grey milestone line at **25,939.8**. This signifies the exact completion of a **1:1 Risk/Reward ratio** relative to our initial entry price (**24,815.7**) and invalidation floor (**23,575.3**).
### 🛡️ Executing Active Capital Protection Protocols:
In strict adherence to our mechanical trade management rules, the following risk mitigation steps are now finalized:
1. **Partial Take-Profit:** We have liquidated **50% of our active long exposure** at the market to secure realized gains and lock in mathematical equity growth.
2. **Break-Even Transition:** The protective Stop Loss for the remaining 50% runner position has been officially trailed directly to the **original entry node (24,815.7)**. This trade is now entirely risk-free.
### 🔍 Technical Trend Evolution & Upside Magnet
The remaining half of the position is left open to seek our final target matrix. Price continues its structural expansion phase to retest key dynamic equilibrium levels located just above our final profit-taking node (**27,281.7**):
* **Overhead Confluences:** The primary macro magnets remain the descending **72-period EMA (red line at 27,985.1)** and the upper boundary of the multi-month Descending Parallel Channel.
* Should the broader soft commodity flow maintain this momentum, a sustained breach of the channel will open a fast liquidity pocket toward the long-term institutional trend base—the **200-period EMA (blue line at 30,860.2)**.
---
📊 **ChartPro Data** | By Rogerio Zaglia
*Systematic Commodity Research, Active Risk Engineering & Trend Rotations.*
⚠️ **Disclaimer:** For educational and informational purposes only. This active technical study represents a personal trading framework and does not constitute financial or investment advice.
Coffee Daily: Tactical Long Setup off Channel Support Targeting Coffee Daily: Tactical Long Setup off Channel Support Targeting Mean-Reversion with 2:1 RR
### ☕ Coffee C Technical Study (Ref: COFFEE_2026-06-11_09-53-03.png)
We are highlighting a compelling structural mean-reversion long setup on the Coffee C Daily chart ( FOREXCOM:COFFEE - FOREX.com), as price action forms a localized reversal pivot at key descending channel support.
### Technical Assessment & Price Action:
* **The Channel Reversal:** Coffee has been grinding lower inside a highly reliable, multi-month descending parallel channel (marked by the thick outer red lines). Following a recent test of the channel's lower boundary, institutional demand stepped in, driving the current session up **+1.23% to 24,774.3**.
* **The Pivot Trigger:** Price is actively attempting to confirm a local trend pivot off the lows. This structural shift signals an overextended market ready to resolve a sharp corrective bounce back toward its key equilibrium zones.
### Execution Plan & Systematic Risk Management (2:1 Risk/Reward):
We have plotted a strict, mechanical parameters matrix designed to extract asymmetric gains from this rotational pop:
1. **The Entry Node:** Triggering at the current consolidation pivot point of **24,815.7** (grey trigger line).
2. **The Invalidation Floor (Stop Loss):** Placed neatly below the recent structural low at **23,575.3** (red boundary line). A daily close beneath this invalidates the reversal thesis.
3. **The Upside Target (Take Profit):** Plotted at **27,296.6** (green boundary line). This target is strategically positioned just below the upper channel resistance line and the **72-period EMA (red line at 28,108.6)**, ensuring execution before major overhead supply re-emerges.
### Strict Trade Management Rule:
To preserve trading capital and enforce systematic execution, a **Break-Even rule** is hard-coded into this trade. As soon as price action hits a 1:1 risk-to-reward ratio (near the 26,056 node), the active stop loss will be aggressively trailed directly to **entry (24,815.7)**, creating a completely free ride to our primary **27,296.6** destination.
---
📊 **ChartPro Data** | By Rogerio Zaglia
*Quantitative Soft Commodity Research, Channel Geometry & Systematic Trade Execution.*
⚠️ **Disclaimer:** For educational and informational purposes only. This technical study represents a personal trading framework and does not constitute financial or investment advice.
Coffee price continues to maintain a bearish biasSince the beginning of the month, coffee has maintained a consistent short-term bearish bias, accumulating a decline of more than 4.00% in its price.
The selling pressure, which has already extended over several weeks of trading, remains mainly driven by expectations of a larger coffee harvest in Brazil for the 2026–2027 period, with the season officially beginning in July. This production is estimated to grow by around 11.5% compared to the previous season, supported by favorable weather conditions, according to data from the Coffee Trading Academy.
This event is relevant considering that Brazil remains the world’s largest coffee producer, accounting for approximately 35% of global production. In this context, an improvement in harvests could generate a significant increase in global supply over the coming months.
This has started to raise concerns about a potential imbalance between supply and demand, as production growth may not be matched by demand at the same pace. As a result, expectations of higher production have become the main fundamental catalyst behind the bearish pressure seen in coffee prices, and as long as this outlook remains in place, the selling bias is likely to remain relevant in the short term.
The bearish trend remains the relevant pattern: Since October 2025, coffee has developed a structure of lower highs, which has led to the formation of a long-term bearish trendline in the price.
So far, no significant bullish correction has emerged to threaten this structure, meaning this pattern remains the main technical reference that could continue to influence price movements over the coming weeks.
RSI: The RSI currently remains below the neutral 50 level, suggesting that the average short-term momentum continues to reflect a selling bias.
As long as this behavior remains in place, bearish pressure may continue to dominate coffee price action in the coming sessions.
MACD: The MACD shows a similar dynamic, with the histogram holding below the 0 level, indicating that short-term moving average strength also reflects a relevant bearish bias.
If this behavior persists, it could continue to support the continuation of selling pressure in coffee prices in the short term.
Key levels to watch:
31,685 – Relevant resistance: A recent high level located above the long-term bearish trendline. Price movements that manage to break above this area could confirm the emergence of a more relevant bullish bias and even open the door to the formation of a short-term uptrend.
30,273 – Near-term barrier: A reference level located around the bearish trendline and close to the 50-period moving average. Moves above this level could start to put the dominant bearish structure at risk and give way to a more consistent bullish bias in the coming sessions.
27,024 – Key support: A 2026 low that acts as the main downside barrier. Price movements below this area would reaffirm the dominance of the selling bias and could lead to an extension of the bearish trend in the coming weeks.
Written by Julian Pineda, CFA, CMT – Market Analyst
Coffee Froth Starting to Fade“The cure for high prices is high prices” may finally be catching up with coffee.
The fundamental backdrop has started to soften with better crop prospects in Brazil and improving robusta supply from Vietnam helping to shift the narrative away from the scarcity fears that fuelled coffee’s explosive rally.
Now the price action on the charts is starting to reflect that shift too.
Having bounced from beneath $2.80/lb on several occasions in recent months, bears have finally gotten their way with the price breaking down through $2.7545, the former swing high set in September 2024 that had flipped to support in recent years. Sitting in a strong downtrend having failed again to retest the record highs in October last year, the breakdown suggests there may be more downside to come for coffee.
While the price action is undeniably bearish, accompanied by building downside momentum with RSI (14) trending lower beneath 50 but not yet oversold, a signal confirmed by MACD which has already staged a bearish crossover, the price now finds itself sitting between former support at $2.7545 and $2.645, the swing high set in October 2024 that when eventually broken heralded the start of the bull run towards the record highs.
As such, the preference is to wait for either a bounce, back test and failure at $2.7545 before considering short entries, allowing for a stop to be placed above the level for protection targeting $2.645. Beyond, there are only a series of minor levels to monitor as potential targets before more pronounced support kicks in at $2.04 and $1.1940.
If the latest bearish move extends towards $2.645 without any form of bounce, price action at the level may be informative as to whether it could be used to set a short or countertrend long, allowing for a stop to be placed on the opposite side to entry depending on how the price interacts with the level.
Good luck!
DS
coffeInside Key Range – Bullish Trap Set for BreakoutHello to all the dear traders! 👋
I hope you're having a great day and are on the path to success and profits in the financial markets. Today, I have a new analysis of Coffee (C) on the daily timeframe for you. This analysis will provide insights into the recent price movements and technical patterns that could be helpful for your decision-making in the future.
📊 Coffee (C) Chart Analysis
Currently, on the Coffee chart, we observe a classic Double Top pattern, which is a highly reliable reversal pattern in technical analysis. This pattern forms when the price rises to a certain level twice but then fails to break through this level and starts to decline again. This behavior indicates weakness in the bullish trend and could lead to a trend reversal.
At the moment, the price is fluctuating in a support zone. This zone is one of the most crucial levels for the price, and we need to see if it can hold and push the price higher or if it will break down.
🧠 Trend Analysis and Scenarios:
Scenario 1: Support Holds at Current Level
If the price manages to hold at this support zone and get support, we could see a medium-term bullish movement. In this case, the price will likely move toward higher resistances, and new buying opportunities might be considered.
Scenario 2: Break of the Support Zone
If the price breaks below the support zone, the Double Top pattern will be confirmed. This could indicate that the price will move toward lower targets, and the selling pressure will increase. In this scenario, we will look for the next support levels to guide us.
📝 Summary and Recommendations:
If the support holds at the current level, we can expect a medium-term bullish move, which could be a good buying opportunity for long-term traders.
If the support is broken, the Double Top pattern will be confirmed, and the price is likely to head toward lower targets.
🔴 Disclaimer:
This analysis is for educational purposes only and does not constitute financial or investment advice. All traders should conduct their own research before making any decisions in the market and rely on their analysis.
📌 Relevant Tags for the Analysis:
#Coffee #Coffeetrading #TechnicalAnalysis #DoubleTop #SupportZone #Breakout #Forex #StockAnalysis #TradingView #MarketUpdate #PriceAction #SupportAndResistance
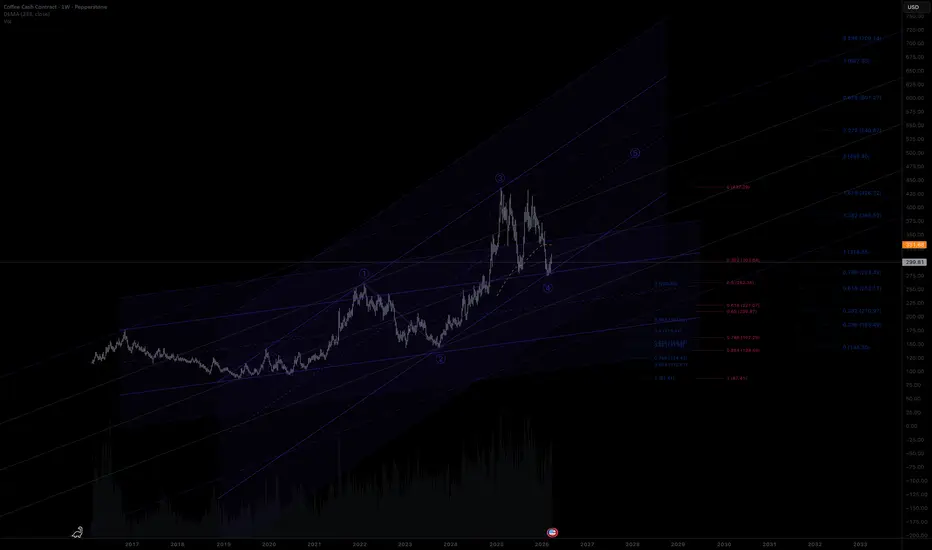
Wave 5 up - Interesting geometryCoffee has been in a correction for over a year in a range between $300-$400. Looking at the fibs it looks like a large impulsive wave up, where wave 5 could be about to start.
Price channels and a pitchfork fit the current upward trend very well. Price is in an interesting zone, ideally with strong support on £300 to confirm new upward move.
The target would be $500+ possible $600 with an extension.
Wave 2 correction = 61%
Wave IV correction = 38%
Checklist
Increasing volume
5 waves up
Correction complete (pull back)
Above DEMA 233 Day -
PITCHFORK/GEOMETRY -
NO Trade yet
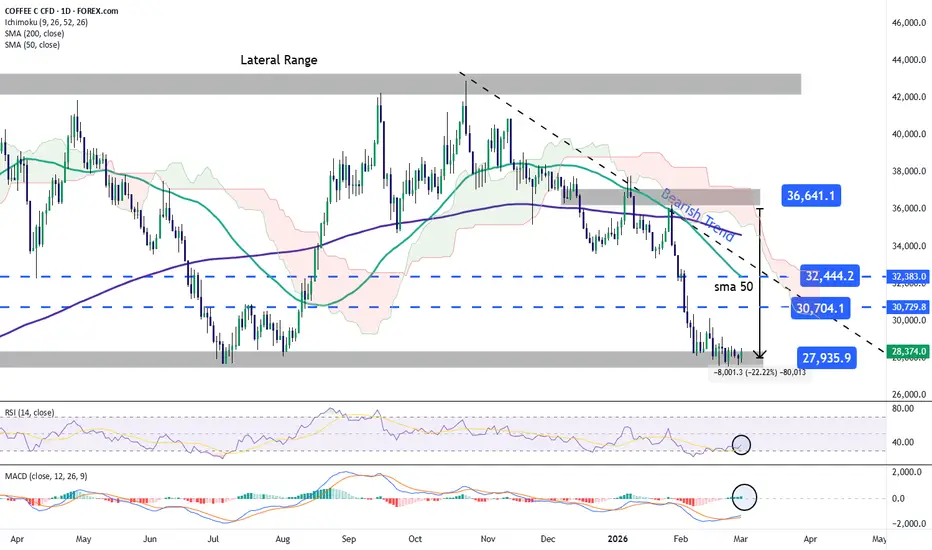
Coffee fails to break out of its indecision biasOver the last four trading sessions, coffee prices have recorded average fluctuations of around 2.5%, a relatively low figure compared with previous weeks when price movements could reach as much as 5% per day. For now, this behavior has begun to highlight a consistent indecision bias in short-term price movements.
Despite the fact that recent sessions have been marked by a strong season of rains and flooding in Minas Gerais, the main coffee-producing state in Brazil, the market has not reacted with particularly strong bullish pressure. This is noteworthy considering that Brazil produces around 35% of the world’s coffee and that persistent rainfall could potentially generate supply disruptions. However, this recent weather event has largely been interpreted by the market as temporary and unlikely to significantly affect production in 2026. In fact, previous forecasts suggest that production may stabilize during the current year. As a result, although the weather conditions have led to a slight increase in coffee prices in the short term, the market continues to display a consistent indecision bias near the lows observed in 2026. In this context, this phase of indecision may remain relevant during the coming trading sessions unless weather developments begin to point toward a more meaningful disruption in production over the following weeks.
Bearish trend remains highly dominant:
Despite recent recovery attempts in coffee prices, bullish movements remain insufficient to trigger a clear break above the long-standing bearish trend line that has been in place since October 2025. For this reason, this technical pattern continues to be the most relevant element currently visible on the chart. If selling pressure re-emerges during the coming sessions, it could extend this trend line further, reinforcing the bearish structure that has dominated the market over the past several months. In this scenario, a much stronger recovery would be required to eliminate the strong long-term selling bias that continues to influence coffee price movements.
RSI: The RSI indicator is currently hovering very close to the neutral 50 level. This behavior suggests that there is a relatively balanced dynamic between bullish and bearish forces over the past 14 trading sessions. If this pattern continues, it could point to sustained neutrality in price action and reinforce the phase of indecision that has begun to characterize the market in recent sessions.
MACD: A similar situation can be observed in the MACD indicator, as its histogram remains very close to the neutral 0 line. This suggests that the strength of short-term moving averages is currently in neutral territory, which also contributes to the lack of a clear directional bias in coffee prices in the short term.
Key levels to watch:
33.443: Major resistance. This level corresponds to a previous neutrality barrier observed in earlier weeks and stands above the current bearish trend line. Price movements reaching this level could open the door to a more meaningful shift in market dynamics, potentially allowing bullish pressure to take control and even leading to the formation of a new upward trend line in the coming weeks.
30.704: Near-term resistance that corresponds to highs observed in July 2025. This level also aligns with the 50-period simple moving average and the long-term bearish trend line. Price movements that manage to break above this barrier could end the current neutrality bias and begin to challenge the broader bearish structure that has dominated the market in recent months, potentially giving way to stronger bullish pressure in upcoming sessions.
27.935: Relevant support level corresponding to the lows recorded in 2026 and standing as the most important bearish barrier in the short term. Price movements that fall below this level could reactivate meaningful selling pressure and lead to a further extension of the long-term bearish trend that has dominated the coffee market in recent months.
Written by Julian Pineda, CFA, CMT – Market Analyst
Coffee Prices Return to Levels Not Seen Since Mid-2025Coffee prices have been under significant pressure in recent weeks. Since the last bullish peak in late January 2026, near the 36,000 level, prices have declined by more than 20%, bringing the market back toward the 28,000 area — levels not seen since mid-2025.
The sustained selling pressure is largely driven by improved supply expectations. Last year, persistent drought conditions significantly limited production in Brazil, the world’s largest coffee producer, accounting for roughly 35%–40% of global output.
However, improved rainfall forecasts in Brazil have begun to reduce the weather risk premium, with better production conditions expected for the 2026 and 2027 harvests. This shift toward a more robust supply outlook has weighed on prices. Additionally, the change in expectations may have triggered institutional liquidation of positions accumulated in previous months. If the improved production outlook holds, selling pressure could remain relevant in the coming sessions.
A New Downtrend Gains Relevance
Since late October 2025, coffee price action has formed a medium-term descending trendline, consolidating a dominant bearish bias in the market.
The price is now approaching key levels not seen since mid-2025. If selling pressure remains consistent, the current downtrend could intensify, potentially leading to more aggressive short-term downside movements.
RSI
The RSI is no longer signaling extreme oversold conditions but continues to trade below the neutral 50 level. This suggests that average momentum over the past 14 sessions remains tilted to the downside. As long as this dynamic persists, bearish pressure is likely to remain dominant in the short term.
MACD
In contrast, the MACD histogram remains close to the zero line, reflecting equilibrium in short-term moving average momentum. This indicates the absence of a strong directional force and leaves room for potential technical corrective rebounds in the coming sessions. However, any such rebounds currently appear insufficient to reverse the broader bearish trend.
Key Levels to Watch
32,444 – Major resistance: This level aligns with the 50-period simple moving average and the descending trendline. Sustained bullish moves toward this area could challenge the current bearish structure and open the door for a short-term buying bias.
30,704 – Near-term barrier: A relevant neutrality zone that may act as a reference level in the event of short-term corrective rallies.
27,935 – Key support: A level not seen since July 2025 and currently the most important downside barrier. A sustained break below this area could reinforce the continuation of the prevailing downtrend and confirm a dominant bearish bias in the medium term.
Written by Julian Pineda, CFA, CMT – Market Analyst
COFFEE Breakout to the DownsideLook at the broader picture. Price has been making lower highs and lower lows, respecting a clean descending trendline. Sellers have been in control for a while.
Now focus on that support zone, from where price bounced multiple times. But notice what changes on the most recent test.
Instead of a clean reaction like before, price breaks below with momentum.
That’s a major shift. When demand fails like this, it often flips into resistance.
Now price holds below the broken zone with no strong reclaim or immediate buyer response.
That tells us selling pressure is real. The small bounce we see afterward is corrective.
It lacks momentum and happens below structure.
As long as price remains below the broken level and the descending trendline, I expect the move to continue towards 315.0 level.
Invalidation; a strong reclaim back above the highlighted zone would require a reassessment.
Until that happens, for me this is a trend continuation scenario.
The market already made its decision, now it’s following through.
We all want COFFEE to be cheaper, but uptrend might hold on! Although most CFD-traders might don't care - COFFEE is an interesting commodity right now, especially with current trends with nervous stock markets/indices.
In general:
- Coffee prices correlate with DXY and stock indices/VIX. Especially when stock markets go down
- Coffee is in higher demand as it is used as hedge against falling stock prices
- Coffee is in a long-term bull-market
If correlations align, especially if stock markets decrease more, there is more upside potential for the Coffee price.
CRITICAL WATCHING POINTS
Correlations for taking a LONG on COFFEE:
DXY (Dollar Index):
- Above 100.50 = BEARISH for coffee
- Below 99.70 = BULLISH for coffee
SPX/Stock Indices:
- Rally (VIX < 18) = BEARISH for coffee
- Weaken (VIX > 23) = BULLISH for coffee
BCOM:
- Break below 107 = BEARISH for commodities/coffee
- Break above 108.50 = BULLISH for commodities/coffee
Coffee Major Support Zone:
Hold above 355 = bull market intact
Break below 350 = could be a major problem (or we finally get cheaper coffee in the supermarket?!)
Coffee Futures: Overbought and Poised for CorrectionCoffee prices have surged to all-time highs near $440, following the post-COVID commodity boom. While most of us love coffee, this rally might soon give us cheaper beans—and a profitable short opportunity.
Why Bearish?
RSI Divergence: Weekly RSI shows strong bearish divergence, signaling momentum exhaustion.
Volume Disparity: Price climbed while volume weakened—a classic reversal setup.
Macro Factors: Brazil’s crop outlook is improving, El Niño impact fading, and global demand softening amid economic uncertainty.
Seasonality: Historically, post-harvest periods see price corrections.
COT Data: Large speculators are trimming long positions, adding to bearish sentiment.
Key Levels:
Resistance: $440(recent high).
Support: $290 (first major zone), $160 (long-term trendline).
Trade Setup:
Target: $160 for a potential 57% downside.
Stop-Loss: Above ~$475.
Watch USD strength and commodity indices for confirmation. If the dollar continues to firm, coffee prices could accelerate lower.
Risk/Reward: Attractive for swing traders with patience.
What do you think—are we about to see a major correction in coffee?
COFFEE | HMA Support Holds | Bullish Breakout Imminent🎯 COFFEE CFD: The Double-Bottom Espresso Shot Setup ☕💰
📊 Market Overview
Asset: COFFEE (Commodities CFD)
Strategy Type: Swing/Day Trade - Cash Flow Management
Bias: 🟢 BULLISH
Timeframe: 2h
🔍 The Setup - Why This Brew is About to Percolate
Alright coffee addicts and chart nerds, let's break down this caffeinated opportunity! ☕⚡
Technical Confirmation:
🎯 Hull Moving Average (HMA) is acting as our dynamic support level
📍 Double Bottom Formation confirmed after price retested the HMA support TWICE
🔥 Buyers stepped in aggressively at the dynamic support zone, confirming bullish momentum
📈 The trend reversal is LOCKED IN - bulls are taking control
This isn't your average coffee break setup - we've got a textbook double-bottom pattern forming right on our dynamic HMA support. Price knocked twice, buyers answered both times. You know what that means? It's go time! 🚀
💎 Entry Strategy - The "Thief" Layered Approach
Primary Entry Signal:
✅ Breakout Confirmation: Wait for price to breach and CLOSE above @385 resistance zone
⚠️ IMPORTANT: Set your price alerts at 385 on your trading platform so you don't miss this breakout! TradingView, MT4, MT5 - whatever you use, SET THAT ALARM! ⏰
🎯 Layered Entry Zones (Scaling In):
This is the "Thief OG" method - you can choose ANY of these levels post-breakout:
Layer 1: 360
Layer 2: 365
Layer 3: 370
Layer 4: 375
Layer 5: 380
Pro Tip: You don't have to enter all at once! Scale in as price confirms momentum. Buy the dip, catch the rip! 🎢
🛑 Risk Management
Stop Loss: @350
Risk-Reward Ratio: Approximately 1:2 (Solid setup! 💪)
📢 Disclaimer Note:
Dear Ladies & Gentlemen (Thief OG's) - This SL is MY personal level. YOU control YOUR money, YOUR risk. Adjust according to your account size and risk tolerance. Trade smart, not hard! 🧠💰
🎯 Profit Targets - Know When to Take Your Coffee to Go
Target Zone: @420 🎯
Why 420?
Strong historical resistance level
Overbought conditions likely
Potential bull trap zone - don't get greedy!
💡 Strategy: Scale OUT just like you scaled IN. Take profits along the way. Lock in gains before the market locks YOU out! 🔒💵
📢 Disclaimer Note:
Dear Ladies & Gentlemen (Thief OG's) - This TP is MY personal target. YOU control YOUR profits. If you're in the green, secure your bag at your own discretion. Nobody ever went broke taking profits! 💰✨
📈 Correlated Pairs to Watch
Keep an eye on these related markets - they move together like coffee and cream ☕🥛
PEPPERSTONE:SUGAR (SB1!) - Commodity correlation
ASX:BRL (Brazilian Real) - Brazil = #1 coffee producer, currency strength matters
PEPPERSTONE:COCOA (CC1!) - Soft commodities sector correlation
DXY (US Dollar Index) - Inverse relationship; weaker dollar = stronger commodities
Key Point: If sugar and cocoa are rallying, coffee usually follows the party! Also, watch weather reports from Brazil - drought conditions = bullish coffee prices. ☀️🌧️
⚡ Key Takeaways
✅ Double-bottom pattern confirmed on HMA dynamic support
✅ Bullish momentum building
✅ Wait for 385 breakout confirmation
✅ Layer entries between 360-380
✅ Manage risk with SL @350
✅ Secure profits near 420 resistance
✅ Watch correlated pairs for confirmation
🎭 The "Thief Style" Philosophy
This is the Thief OG strategy - we steal opportunities from the market like a caffeinated ninja!
This analysis is for educational and entertainment purposes. We're here to learn, laugh, and hopefully make some money along the way!
Remember: The market doesn't care about your feelings. Stick to YOUR plan, manage YOUR risk, and protect YOUR capital. This is a game of probabilities, not certainties!
✨ If you find value in my analysis, a 👍 and 🚀 boost is much appreciated — it helps me share more setups with the community!
#Coffee #CommoditiesTrading #CFDTrading #SwingTrading #DayTrading #TechnicalAnalysis #DoubleBottom #HullMovingAverage #HMA #Breakout #BullishSetup #TradingStrategy #PriceAction #SupportAndResistance #RiskManagement #ThiefStyle #CoffeeMarket #CommodityTrading #TradingIdeas #ChartAnalysis #ForexCorrelation #SoftCommodities
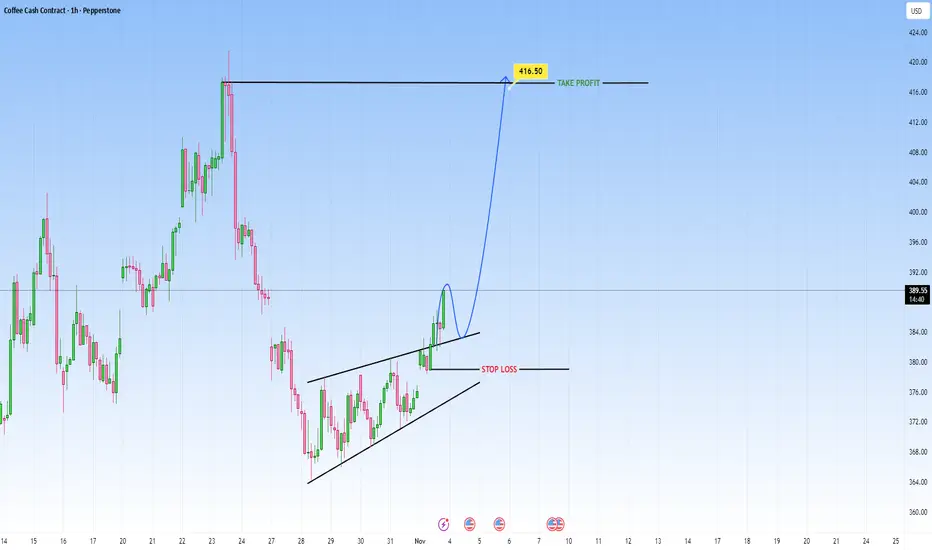
COFFEE Could Rise From herePrice on Coffee began consolidating inside a rising wedge, showing controlled accumulation from buyers. Normally, a rising wedge hints at weakness, a signal that buyers are losing momentum.
But here’s the twist: instead of breaking down, price broke out upward with strong momentum.
That’s a sign of buyer dominance, what should’ve been a reversal turned into a breakout.
The upside target would be near 416.50, aligning with the next major resistance level.
As long as price holds above the breakout zone, the momentum remains bullish, with buyers driving this move forward.
1000 USD: Coffee Bull Market Overview: Prices set to DOUBLE ☕ Coffee (Arabica, ICE “KC”) — Outlook to 2026
Where we are: Nearby Arabica trades ~405–410 US¢/lb after a parabolic 2025 on weather stress, thin deliverable stocks, and policy shocks. The Dec ’25 contract is ~400 ¢/lb.
Big picture 2025/26: Official global production is pegged at a record ~178.7 M bags (robusta-led) versus ~169.4 M bags consumption; ending stocks remain tight near ~22.8 M. Inside that headline, arabica is the pinch point: Brazil’s arabica is down year over year on heat/drought, and multiple private houses flag an arabica deficit on the order of ~–8.5 M bags for 2025/26.
________________________________________
🤖 1) Brazil 2025 flowering & 2026 crop execution (↑ to 9.5/10)
Why it matters: Brazil is the swing producer for arabica; 2026 outcomes hinge on Sep–Oct 2025 flowering and the trees’ carryover stress from 2024–25 dryness/frost. Local co-ops in Cerrado report frost-related damage with six-figure bag impacts to 2026 potential.
What we’re seeing: The latest national estimate cuts 2025 output to ~55.2 M bags total (arabica ~35.2 M), confirming a weaker arabica “off” year. Talk of a “super 2026” has faded unless rains arrive and stick through flowering and early fruit set.
Why 9.5/10? A missed flowering or poor fruit set is the cleanest path to a 2026 arabica shortfall big enough to rip futures.
________________________________________
🌍 2) U.S. 50% tariff on Brazilian coffee (new 9.0/10)
Why it matters: The U.S. typically imports ~8 M bags from Brazil. A 50% tariff (effective Aug 6, 2025) distorts flows, inflates U.S. landed costs, and channels more hedging into NY “KC,” structurally supporting futures. Brazil trade groups directly linked August’s vertical move to the tariff shock.
Why 9.0/10? If the tariff persists into 2026, basis stays elevated and retail prices remain sticky even if global aggregates look “adequate.”
________________________________________
🧭 3) EU Deforestation Regulation (EUDR) go-live (↑ 8.8/10)
Why it matters: Traceability/geolocation rules begin Dec 30, 2025 for large/medium operators (SMEs Jun 30, 2026). Compliance temporarily shrinks “eligible” supply and reprices differentials.
Why 8.8/10? Early-2026 could see EU-grade shortages, wider diffs, and higher KC via arbitrage.
________________________________________
📉 4) Exchange (ICE) certified stock drawdown (↑ 8.5/10)
Why it matters: Deliverable supply amplifies squeezes. Arabica certified stocks ~0.67–0.78 M bags in early September—thin for the season.
Why 8.5/10? With low float, any weather or logistics hiccup can air-pocket futures into blow-off spikes.
________________________________________
🌡️ 5) ENSO/La Niña watch & Brazil rainfall tail-risk (holds 8.0/10)
Why it matters: La Niña-skewed patterns risk ill-timed rain (flower knock-off) or too-little rain (poor fruit set) in Minas Gerais during Sep–Oct. Early September dryness was flagged; late-September storms are pivotal.
Why 8.0/10? The timing of rain matters as much as totals; a mis-timed pattern is enough to dent 2026 yields.
________________________________________
🇻🇳 6) Vietnam robusta recovery vs. water stress (↑ 7.8/10)
Why it matters: Robusta tightness forced blend shifts. A rebound toward ~31 M bags in 2025/26 would cap KC via spread relief; persistent water stress/tree fatigue would keep robusta tight, forcing arabica to carry the world.
Why 7.8/10? Binary swing factor: a real rebound cools spreads; a miss extends the squeeze into 2026.
________________________________________
🏛️ 7) Policy & trade fragmentation beyond U.S. tariffs (↑ 7.5/10)
Why it matters: Frictions and exemptions remain fluid. Retaliation or parallel measures could redirect flows to EU/Asia, move basis, and distort origin diffs.
Why 7.5/10? The tariff is already biting; add-ons would compound tightness.
________________________________________
💵 8) FX (BRL) & producer selling (↑ 7.0/10)
Why it matters: A stronger BRL curbs farmer selling; a weak BRL unleashes hedges and pressures KC. Policy/inflation noise keeps BRL volatile.
Why 7.0/10? Not first-order, but magnifies weather/policy shocks.
________________________________________
🏭 9) Demand elasticity & substitution (holds 6.8/10)
Why it matters: 2025 sticker shock clipped demand by roughly –0.5%. 2026 could stabilize if prices plateau; if retail rises further (tariffs/EUDR), more down-trading or substitution (robusta/other beverages) caps upside.
Why 6.8/10? A genuine headwind to the $10/lb path unless supply breaks further.
________________________________________
🚢 10) Logistics, certifications & differentials (new 6.5/10)
Why it matters: Tight washed/tenderable pools, evolving ICE rules/diffs, and shipping bottlenecks can widen basis and squeeze deliverables.
Why 6.5/10? Secondary, but adds fuel to any fundamental spark.
________________________________________
📈 11) Spec positioning & financial flows (↑ 6.5/10)
Why it matters: 2025’s run featured panic buying in a low-float market. Another weather scare + thin stocks invites CTA/momentum flows through round-numbers.
Why 6.5/10? Not fundamental—but can yank KC vertically.
________________________________________
🧪 12) “Record global production” optics vs. arabica reality (new 6.0/10)
Why it matters: The record headline is robusta-led. Inside, Brazil arabica declines and exporters stay cautious. The market trades the arabica bottleneck, not the aggregate.
Why 6.0/10? This optics gap sustains volatility—bulls can still win if arabica under-delivers.
________________________________________
Updated Catalyst Scorecard
Rank Catalyst Score
1 Brazil 2025 flowering → 2026 crop 9.5
2 U.S. 50% tariff on Brazil 9.0
3 EU EUDR (Dec 30, 2025 start) 8.8
4 Low ICE certified stocks 8.5
5 ENSO/La Niña rainfall risk 8.0
6 Vietnam robusta recovery risk 7.8
7 Wider trade policy fragmentation 7.5
8 FX (BRL) & selling behavior 7.0
9 Demand elasticity/substitution 6.8
10 Logistics, diffs & certification frictions 6.5
11 Spec/CTA flows 6.5
12 “Record crop” optics vs arabica bottleneck 6.0
________________________________________
📊 Supply–Demand Snapshot — Why Arabica Is the Pinch Point
• World 2025/26: Production ~178.7 M; consumption ~169.4 M; ending stocks ~22.8 M (still lean).
• Brazil arabica: ~40.9 M (down ~2.8 M YoY); robusta records elsewhere (Brazil/Indonesia); Vietnam recovery penciled near 31 M.
• Private balance: Arabica deficit ~–8.5 M for 2025/26 (vs ~–5.5 M in 2024/25).
• ICE plumbing: Certified arabica ~0.67–0.78 M bags and trending lower → thin deliverables, higher tail-risk premia.
________________________________________
🔍 Recent Headlines You Should Know
• KC spiked toward/above $4/lb in early 2025 on panic buying, weather, and policy shocks.
• “Record global crop” headlines coexist with lower Brazil arabica and tight ending stocks.
• U.S. 50% Brazil tariff (Aug 6, 2025) credited with a ~30% surge in August.
• EUDR deferred to Dec 30, 2025 for large/medium operators; compliance scramble into 1H26.
• Early-Sep 2025 Minas dryness kept flowering risk live; markets watching late-Sep showers.
________________________________________
🎯 Street & Agency Views (as of Sep 2025)
• Early-2025 consensus had end-2025 ~$2.95/lb, expecting mean reversion. The market disagreed post-tariffs.
• One multilateral outlook saw >50% y/y up in 2025, then –15% in 2026, assuming supply normalization and Colombia recovery.
• Several trade houses continue to highlight a widening arabica deficit into 2025/26.
Takeaway: Consensus expects some 2026 cooling, but policy + compliance + arabica weather can overwhelm “aggregate surplus” narratives.
________________________________________
🧭 Pathways to 1,000 ¢/lb in 2026 (Aggressive Target)
We’re already near 400 ¢. To reach $10/lb, the market needs a stack of arabica-specific shocks that persist into 2026:
1. Brazil under-delivers in 2026: Patchy/failed flowering (Sep–Oct ’25) and/or heat during fruit set reduce yields; 2026 arabica ≤ ~38–40 M.
2. Tariffs persist through 2026: U.S. 50% duty remains in force, lifting U.S. basis and rerouting flows; fewer tenderable lots into ICE.
3. EUDR friction bites in 1H26: Non-compliant lots stranded; compliant premiums surge; differentials widen and pull KC higher.
4. Certified stocks < ~500k bags: Roaster drawdown + limited grading/tendering triggers backwardation and squeeze mechanics.
5. Vietnam misses rebound: Water stress or tree fatigue keeps robusta tight; arabica must carry blends globally.
6. Pro-cyclical flows: Thin deliverables + headlines = momentum/CTA accelerants through round numbers (500 → 700 → 900 → 1,000).
Probability assessment: Not the base case, but plausible if two or more of (1–4) coincide while financial flows amplify. Call it ~20–25% conditional on Q4’25 weather and policy staying restrictive.
________________________________________
🧮 Scenario Framework (NY Arabica, nearby; end-2026)
• Bull (30%) — Squeeze: Brazil 2026 < 40 M; tariff persists; EUDR tight; certifieds < 0.5 M; Vietnam under-shoots.
Price: 800–1,000 ¢/lb (blow-off spikes possible above 1,000 on transient squeezes).
• Base (50%) — Elevated & volatile: Brazil 2026 ~41–44 M; tariff partially eased or offset; EUDR frictions fade by 2H26; Vietnam rebounds.
Price: 450–650 ¢/lb with episodic spikes on weather or logistics.
• Bear (20%) — Normalization: Strong Brazil flowering → 2026 ≥ 45 M; tariff rolled back; EUDR compliance smoother; certifieds rebuild > 1.2 M; demand softens.
Price: 280–420 ¢/lb (vol still above pre-2024 norms).
________________________________________
🗓️ Watchlist & Timeline (what to track)
• Sep–Oct 2025: Brazil flowering windows (Minas/Cerrado/N. São Paulo). Look for rain onset, follow-up, and heat bursts.
• Nov–Dec 2025: Fruit set confirmation; disease incidence; updated 2026 potential.
• Dec 30, 2025: EUDR go-live (large/medium operators).
• Q1–Q2 2026: Compliance bottlenecks, EU diffs, tenderable quality flows into ICE.
• All 2025/26: Tariff status, BRL swings, certified stock trajectory, Vietnam water/harvest updates.
________________________________________
⚠️ Risk Matrix (what flips the call bearish)
• Timely rains in Sep–Oct 2025 and mild temps → robust fruit set; Brazil 2026 ≥ 45 M.
• Tariff rollback or broad exemptions reduce U.S. basis support.
• Vietnam outperform (> 31 M) relieves spreads; Indonesia robusta stays strong.
• Certified stocks rebuild > 1.2 M bags by mid-2026.
• Demand destruction accelerates (retail fatigue, substitution), capping upside.
________________________________________
📌 Positioning Lens (informational, not advice)
• Drivers of upside convexity: Brazil weather into October, policy stickiness (tariff/EUDR), and certified stock path.
• Tell-tales of a squeeze: Steepening backwardation, diffs blowing out for compliant washeds, and rapid certified draw alongside rising exchange open interest.
• Tell-tales of normalization: Strong flowering reports, improved grading pass-rates, certified rebuilds, and easing EU compliance premia.
________________________________________
Bottom Line
• The base case remains elevated and volatile into 2026, not automatic mean reversion.
• A credible path to 1,000 ¢/lb exists if Brazil’s 2026 arabica disappoints, policy frictions persist, EUDR pins EU-grade supply, and certifieds fall sub-0.5 M, with CTA flows doing the rest.
• Conversely, timely Brazil rains, tariff relief, and a clean EUDR transition cap the rally and pull prices toward the high-$3s/low-$4s.