COMP – Buyers vs. Sellers | Breakout Loading### **Technology Overview**
Compound (COMP) is a decentralized DeFi lending protocol that enables users to lend and borrow digital assets without intermediaries. The COMP token serves as the protocol's governance token, allowing holders to participate in key decisions regarding the platform's development and future direction.
### **Technical Analysis**
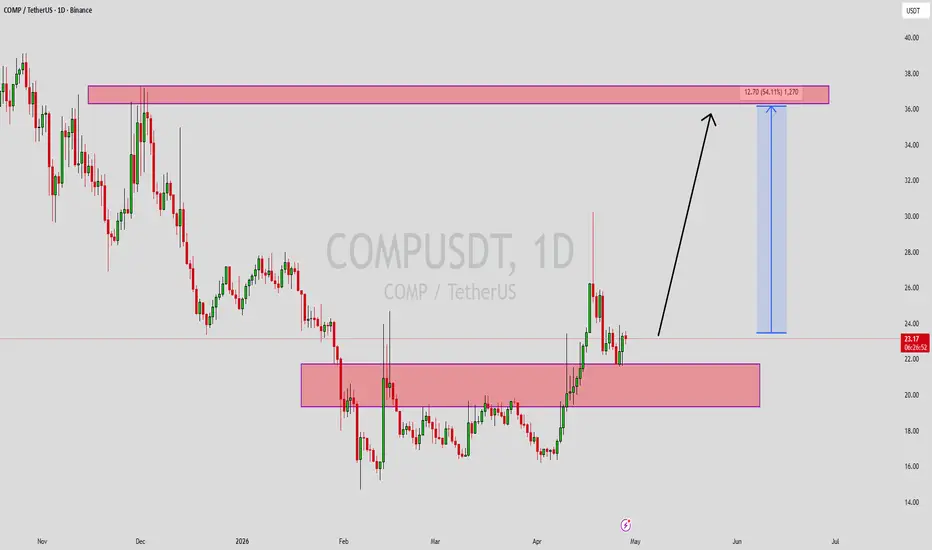
On the **30-minute chart**, the **yellow lines represent the trading range (value area) of the current structure**, with the price now approaching the upper boundary.
The **red zone above marks the last major supply area**, where sellers previously stepped in and pushed the price lower. This makes it a key area to monitor for the market's next reaction.
We'll only consider a **long position after a confirmed breakout above the previous sellers' level**. Once buyers prove they can absorb the remaining supply and maintain acceptance above that area, we'll look for an entry. Until that confirmation is received, there is no trade.
**The target shown on the chart is an initial target only.** Trade management and any additional targets will depend on price action, market structure, and proper risk management.
**Disclaimer:**
This analysis is for educational and informational purposes only and should not be considered financial or investment advice. Always conduct your own research and manage your risk before making any trading decisions.
**Good luck to all of us!**
**Yours, The Chief.**
In-depth trading ideas
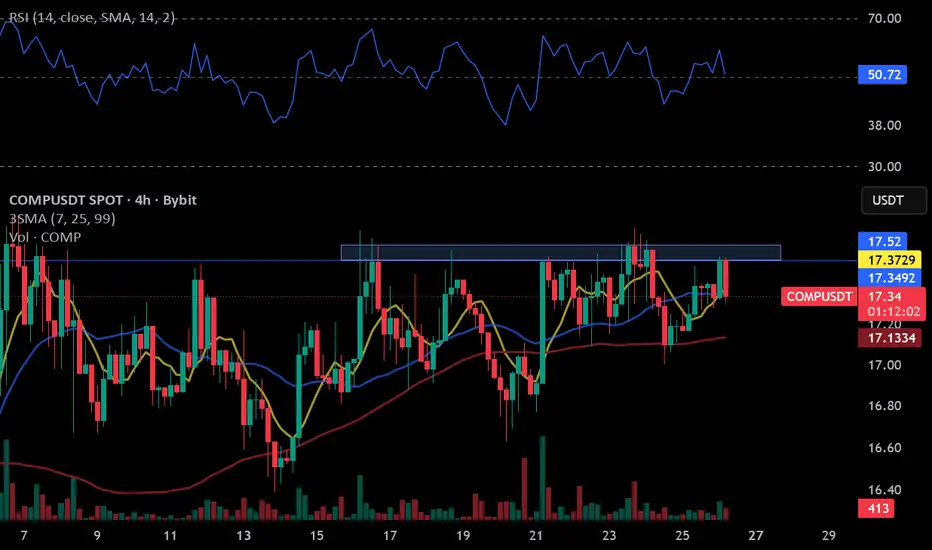
COMPUSDT COMPUSDT has remained below the 17.52 resistance level for the past 21 days. A confirmed breakout above this zone could trigger a strong bullish move.
Despite Bitcoin's recent market conditions, COMP has shown notable resilience and has not experienced any significant bearish reaction. On the 4-hour timeframe, the price is forming a series of higher lows while maintaining equal highs, creating an ascending triangle pattern. This structure reflects increasing buying pressure, and a confirmed breakout above 17.52 could pave the way for further upside.
As always, wait for a confirmed breakout and manage your risk accordingly.
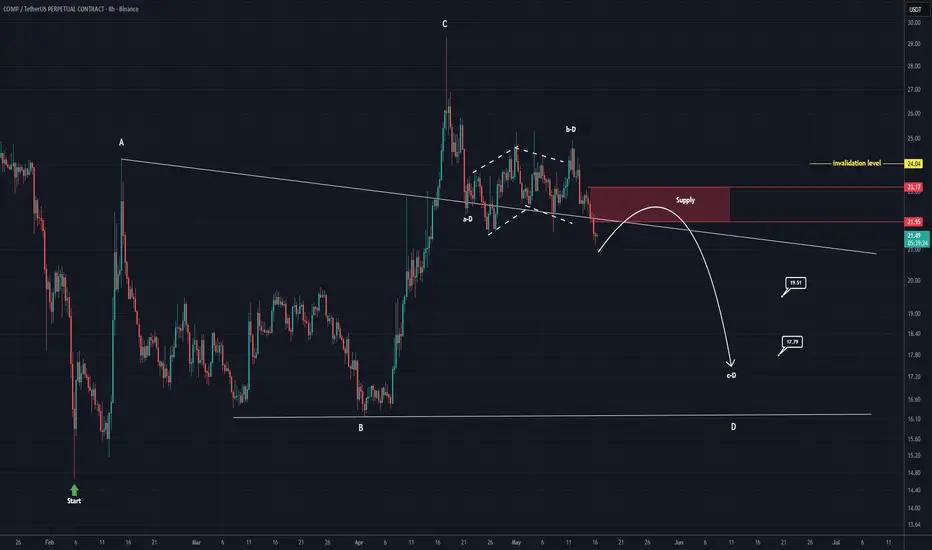
COMP is at risk of initiating a deep drop! (8H)COMP is currently retesting previously broken trendlines and a flipped resistance zone, which is now acting as a key decision area for price action.
In fact, COMP appears to be attempting to complete wave E of a larger corrective structure, suggesting that the final leg of the pattern may still be in progress before a potential continuation to the downside.
The highlighted red zone represents a high-probability entry area for a short position, where bearish reactions are expected if price confirms rejection.
All downside targets are clearly marked on the chart for reference and structured risk management.
However, a daily candle close above the invalidation level would fully invalidate this scenario and negate the current bearish outlook, signaling a potential shift in market structure.
If you have a symbol you want analyzed, first hit the like button and then comment its name so I can review it for you.
Do you also think COMP is bearish?
COMP Under Pressure | Is a Crash Coming? (8H)From the point where we placed the green arrow on the chart, a triangle pattern appears to be forming. We are currently in wave D of this triangle. Wave 1 and wave 2 have already been completed, and we now expect wave 3, meaning wave C of wave D, to develop soon.
The supply zone could provide a potential short entry opportunity.
Targets are marked on the chart. Move to breakeven at the first target.
A daily candle close above the invalidation level would invalidate this scenario.
If you have a coin or altcoin you want analyzed, first hit the like button and then comment its name so I can review it for you.
Do you also think COMP is bearish?
Wave F Target: High Volume Zone Rebound Ahead of Next Leg DownI am currently anticipating a rebound in the blue area, which represents a previous High Volume Node (HVN). This move should complete Wave F.
Red Rectangle Watch: Please note the volume area marked by the red rectangle. I believe this minor support will not hold the price for long.
Downside Targets: My main targets are the demand zones between $17.40 and $15.60.
Conclusion: There is a high probability of the market making a new low after this corrective structure plays out.
compusdt longInstructions:
Entry point: yellow
Stop loss: red
Take profit: green
👉Leverage x 5-10-20 for crypto
👉Leverage x 20-50-100 for commodities, stocks, indices, and forex
👉Margin 1-5% max.
Always practice risk and money management.
Invest a maximum of 5% on any trade or across all your trades.
Invest only what you can afford to lose, as no one is in control of the market.
👉Our analyses are primarily based on:
breakouts: two trend lines (ascending and descending) and a line indicating a horizontal breakout.
chart patterns: shoulders and head, triangle parttern, elliott impulse, etc etc.
We don't always have the time to track them at all times or to represent them visibly, given the numerous signals, the number of channels to manage, and especially because of the often rapid pace of market movements.
indicators: We associate at least two indicators with this technique.
👉Depending on the circumstances, we use specific indicators, often setting 3 or more take profit levels.
👉Indeed, there are good days in trading and also bad days. No one can promise to win every trade, and like all traders worldwide, we also experience stop-loss orders. However, we win more than we lose and remain positive.
👉You can close the position before or after the take profit orders indicated by the green lines if you are personally satisfied; the same applies to stop loss orders.
👉We must stay positive, clear-headed, and humble.
we cannot provide all instructions or all trades here on this channel.
Good luck to us all, and may God guide us. Amen.
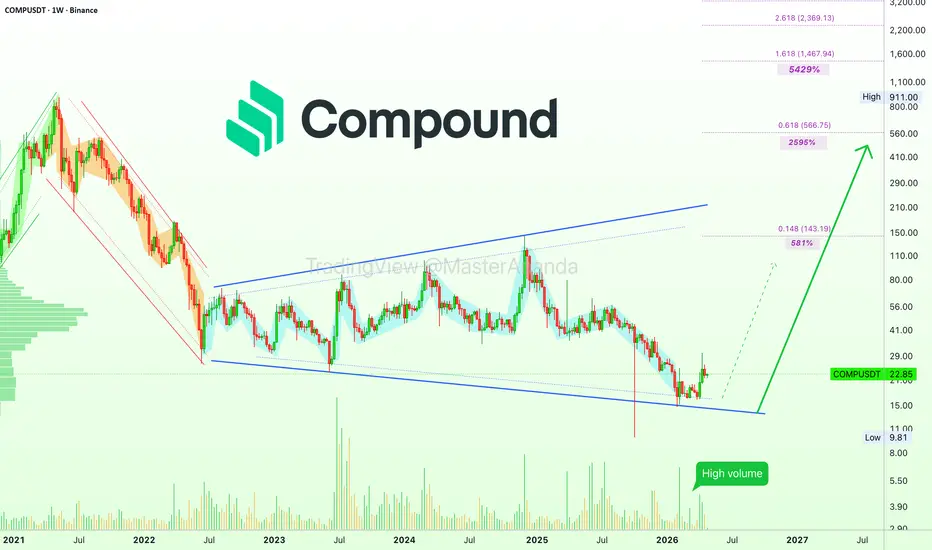
Compound: 480% First · Resistance is about to breakSince mid April resistance is being challenged on this chart based on the weekly timeframe. COMPUSDT is trying to move higher, without success so far, yet, the chart conditions continue to improve.
Buyers are being rejected at resistance but there are no new lows. Five weeks with the same barrier still active but we continue with a green market and chart. COMPUSDT is ready to move higher.
Long-term growth shows huge potential available for this trading pair. But we have to start somewhere, and this somewhere is a 481% target around $143. This target can be hit short- to mid-term.
June 2022 Compound produced a major bottom ending the previous bearish cycle. From June 2022 through December 2024 the market produced a wide consolidation period. There was a mild bullish bias but nothing out of the ordinary.
The lack of bull market resulted in a fresh drop, a bottom appeared October 2025. We have the higher low that is present on thousands of projects in early February 2026, and now we can see clearly how Crypto is moving toward a new price increase. Growth is right around the corner.
Growth has been happening for months. As the market sentiment changes from extreme fear to hope, enthusiasm and fresh gains. The market is ready for a new market cycle, a long-term uptrend.
Compound is ready to grow. Resistance is about to break.
Namaste.
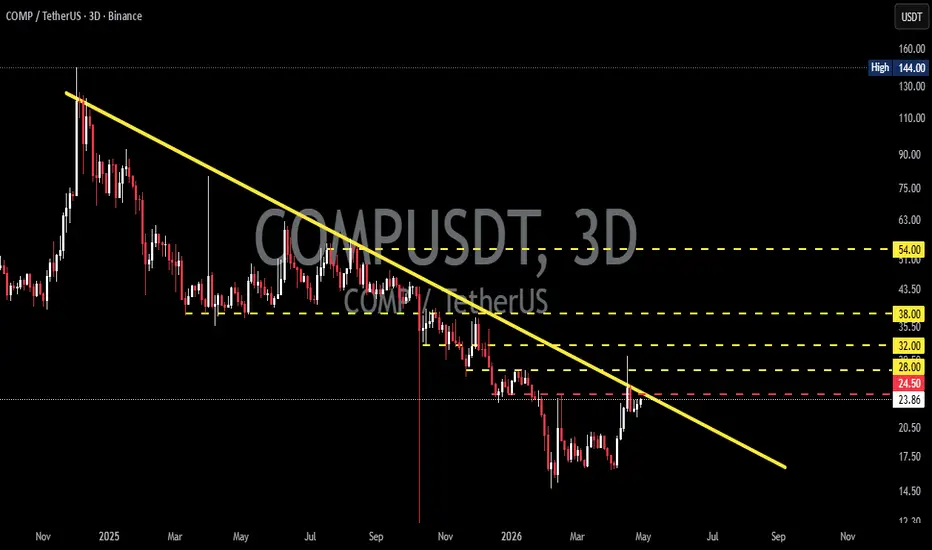
COMP/USDT — Descending Trendline, Breakout or Rejection?On the 3D timeframe, COMP/USDT remains in a strong downtrend structure, clearly defined by a descending trendline (yellow line). Price continues to form lower highs and lower lows, indicating sustained selling pressure in the mid- to long-term.
Currently, price is testing a key decision zone:
Trendline resistance
Horizontal resistance around 24.5 USDT
This area will likely determine the next major move.
---
📉 Structure & Pattern
🔻 Descending Trendline (Downtrend Structure)
A consistent downward trendline acting as resistance → strong bearish control.
🔻 Range Compression / Mini Accumulation Price has been moving sideways in the lower range (around 17–23 USDT), which may indicate:
Accumulation (bullish scenario)
Continued distribution (bearish continuation)
🔻 Key Support & Resistance Levels
Resistance: 24.5 – 28 – 32 – 38 – 54 USDT
Support: 17 – 14.5 USDT (previous lows)
---
🚀 Bullish Scenario
Bullish confirmation requires a strong breakout and confirmation:
✅ Conditions:
Break and close above trendline + 24.5
Increasing volume (valid breakout)
🎯 Targets:
28 USDT
32 USDT
38 USDT (major resistance)
Extended target: 54 USDT
📌 Interpretation: A breakout above the descending trendline could signal the beginning of a trend reversal or at least a significant relief rally.
---
🐻 Bearish Scenario
If price fails to break the trendline:
❌ Signals:
Rejection at 24.5 / trendline
Strong bearish candle formation
🎯 Targets:
20 USDT
17 USDT
Further breakdown toward 14.5 USDT (previous low)
📌 Interpretation: A rejection would confirm another lower high, continuing the bearish trend.
---
⚠️ Conclusion
COMP is currently at a major decision zone.
This is a clear battle between buyers and sellers:
Breakout = potential reversal
Rejection = continuation of the downtrend
Traders should wait for clear price action confirmation before entering positions.
#COMPUSDT #CryptoAnalysis #TechnicalAnalysis #Altcoin #TradingView #CryptoTrading #SupportResistance #Trendline #Breakout #Bearish #Bullish #CryptoMarket #PriceAction #Downtrend #ReversalSetup
COMPUSDT Forming Bullish MomentumCOMPUSDT is currently forming a clear bullish momentum pattern, a classic wave structure that often signals an upcoming breakout. The price has been consolidating within a narrowing range, indicating that selling pressure is gradually weakening while buyers are beginning to regain control. With consistent volume supporting accumulation at lower levels, the setup suggests a strong potential for a bullish breakout in the near term.
If the price breaks above the wedge resistance, the projected move could be moderate yet promising, with a potential gain of around 40% to 50%. This type of bullish momentum pattern is typically seen at the end of downtrends or corrective phases, signaling a possible shift in market sentiment from bearish to bullish.
Traders closely monitoring COMPUSDT are observing strengthening momentum as it approaches a key breakout zone. The presence of solid trading volume adds confidence to this setup, indicating that market participants may be positioning early in anticipation of a reversal.
Growing investor interest in COMPUSDT reflects rising confidence in its technical structure and overall potential. If the breakout is confirmed with strong and sustained volume, it could mark the beginning of a fresh bullish leg. This setup may present a valuable opportunity for medium-term traders as momentum builds and the pattern completes.
✅ Show your support by hitting the like button
✅ Leave a comment below (What is your opinion about this coin?)
Your feedback and engagement keep me motivated to share more insightful market analysis with you!
COMPUSDT 3D#COMP is moving within a descending channel on the 3-day timeframe chart. Consider entering this coin only after a clean breakout above the channel. In that case, the upside targets are:
🎯 $31.91
🎯 $37.24
🎯 $42.56
🎯 $50.13
🎯 $59.78
⚠️ Always remember to use a tight stop-loss and maintain proper risk management.
Compound · Early bullish action & long-term growthGood afternoon my fellow Cryptocurrency trader, I hope you are having a wonderful day.
›› Is the current move real or fake?
›› Are we witnessing the start of a new cycle, a new bullish period or a bull-trap, which one is it?
›› How to know if this move promises higher prices or if the results will be the same as before?
Great questions, let's ask the chart.
Compound has been bearish for years, when it comes to the broader market cycle and chart structure —since May 2021.
Compound has been bearish also based on the last market cycle, since December 2024.
Between June 2022 through December 2024, we had bullish action, higher highs and higher lows. From December 2024 through present day the market was bearish. Here we can see the alternating waves.
The all-time low came in October 2025. In February, COMPUSDT produced a higher low vs this ATL. And notice how trading volume was extremely low.
This month the action is turning bullish. It is the best since December 2024 supported by really high volume, a volume breakout, and this is the signal that supports additional growth.
A four months long higher low supported by a high volume bullish breakout is a combination good enough to support a change of trend.
›› How long can this uptrend last? What to expect?
If an uptrend develops it can last years, the same as previous cycles.
If we are only witnessing a bullish jump before lower prices, an inverted correction, then the duration can be 1-3 months.
Seeing how a new all-time low was hit followed only by a higher low, it is more likely that the bottom is in and thus a new uptrend forms.
If we were set to experience lower this year on COMPUSDT, the low in February 2026 would be lower compared to October 2025. That's the logic based on TA.
Thank you for reading. Your continued support is highly appreciated.
Namaste.
Bears are in control of COMP price action (8H)Price has reacted to a supply zone and then broke below the bullish trendline to the downside. We also have a bearish ICH structure on the chart, and the candle that touched the supply was rejected immediately with a wick. Based on this, it is expected that COMP may move toward lower levels.
Two clear entry points have been marked for DCA entries.
Targets are marked on the chart, and at the first target you should move to break even.
A daily candle close above the invalidation level will invalidate this analysis.
invalidation level: 27.10$
If you would like us to analyze a coin or altcoin for you, first like this post, then comment the name of your altcoin below.
What is your opinion about COMP?
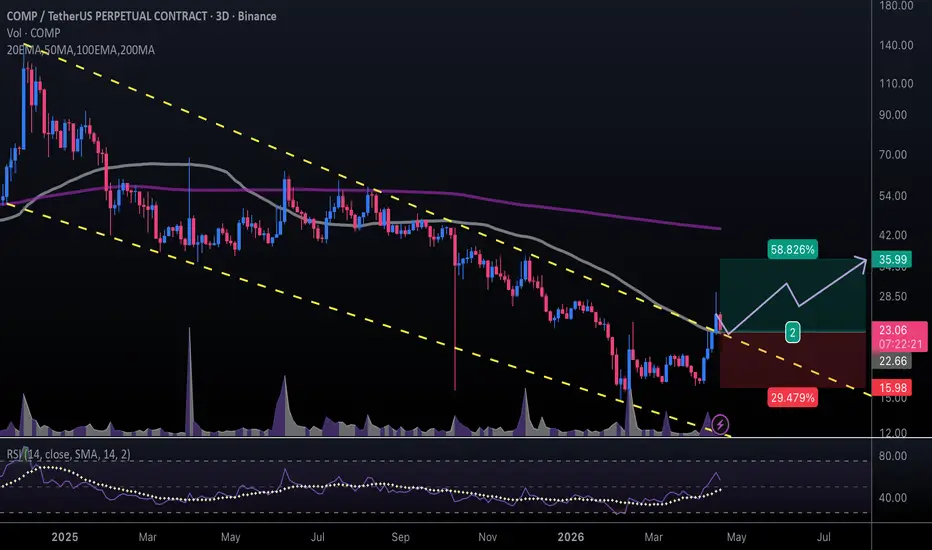
#COMPUSDT #3D (Binance) Falling wedge breakout and retest [LONG]Compound regained 50MA support and is pulling back to it, seems likely to resume bullish towards 200MA resistance next.
⚡️⚡️ #COMP/USDT ⚡️⚡️
Exchanges: Binance Futures
Signal Type: Regular (Long)
Leverage: Isolated (2.0X)
Amount: 5.1%
Entry Targets:
1) 22.66
Take-Profit Targets:
1) 35.99
Stop Targets:
1) 15.98
Published By: @Zblaba
CRYPTOCAP:COMP BINANCE:COMPUSDT.P #3D #Compound #DeFi compound.finance
Risk/Reward= 1:2.0
Expected Profit= +117.7%
Possible Loss= -59.0%
Estimated Duration= 3-4 months
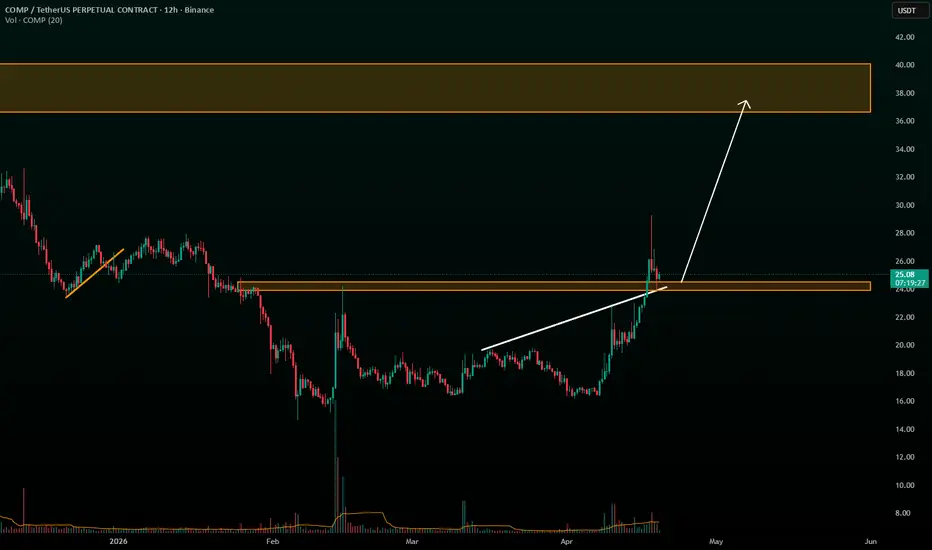
COMP/USDTKey Level Zone: 23.90 - 24.50
LMT v2.0 detected.
The setup looks promising—price previously trended upward with rising volume and momentum, then retested this zone cleanly. This presents an excellent reward-to-risk opportunity if momentum continues to align.
Introducing LMT (Levels & Momentum Trading)
- Over the past 3 years (SINCE 2022), I’ve refined my approach to focus more sharply on the single most important element in any trade: the KEY LEVEL.
- While HMT (High Momentum Trading) served me well—combining trend, momentum, volume, and structure across multiple timeframes—I realized that consistently identifying and respecting these critical price zones is what truly separates good trades from great ones.
- That insight led to the evolution of HMT into LMT – Levels & Momentum Trading.
Why the Change? (From HMT to LMT)
Switching from High Momentum Trading (HMT) to Levels & Momentum Trading (LMT) improves precision, risk control, and confidence by:
- Clearer Entries & Stops: Defined key levels make it easier to plan entries, stop-losses, and position sizing—no more guesswork.
- Better Signal Quality: Momentum is now always checked against a support or resistance zone—if it aligns, it's a stronger setup.
- Improved Reward-to-Risk: All trades are anchored to key levels, making it easier to calculate and manage risk effectively.
- Stronger Confidence: With clear invalidation points beyond key levels, it's easier to trust the plan and stay disciplined—even in tough markets.
Whenever I share a signal, it’s because:
- A high‐probability key level has been identified on a higher timeframe.
- Lower‐timeframe momentum, market structure and volume suggest continuation or reversal is imminent.
- The reward‐to‐risk (based on that key level) meets my criteria for a disciplined entry.
***Please note that conducting a comprehensive analysis on a single timeframe chart can be quite challenging and sometimes confusing. I appreciate your understanding of the effort involved.
Important Note: The Role of Key Levels
- Holding a key level zone: If price respects the key level zone, momentum often carries the trend in the expected direction. That’s when we look to enter, with stop-loss placed just beyond the zone with some buffer.
- Breaking a key level zone: A definitive break signals a potential stop‐out for trend traders. For reversal traders, it’s a cue to consider switching direction—price often retests broken zones as new support or resistance.
My Trading Rules (Unchanged)
Risk Management
- Maximum risk per trade: 2.0%
- Leverage: 3x
Exit Strategy / Profit Taking
- Sell at least 70% on the 3rd wave up (LTF Wave 5).
- Typically sell 50% during a high‐volume spike.
- Move stop‐loss to breakeven once the trade achieves a 1.5:1 R:R.
- Exit at breakeven if momentum fades or divergence appears.
The market is highly dynamic and constantly changing. LMT signals and target profit (TP) levels are based on the current price and movement, but market conditions can shift instantly, so it is crucial to remain adaptable and follow the market's movement.
If you find this signal/analysis meaningful, kindly like and share it.
Thank you for your support~
Sharing this with love!
From HMT to LMT: A Brief Version History
HM Signal (Prototype) :
Date: 17/08/2023
- Early concept identifying high momentum pullbacks within strong uptrends
- Triggered after a prior wave up with rising volume and momentum
- Focused on healthy retracements into support for optimal reward-to-risk setups
HMT v1.0:
Date: 18/10/2024
- Initial release of the High Momentum Trading framework
- Combined multi-timeframe trend, volume, and momentum analysis.
- Focused on identifying strong trending moves high momentum
HMT v2.0:
Date: 17/12/2024
- Major update to the Momentum indicator
- Reduced false signals from inaccurate momentum detection
- New screener with improved accuracy and fewer signals
HMT v3.0:
Date: 23/12/2024
- Added liquidity factor to enhance trend continuation
- Improved potential for momentum-based plays
- Increased winning probability by reducing entries during peaks
HMT v3.1:
Date: 31/12/2024
- Enhanced entry confirmation for improved reward-to-risk ratios
HMT v4.0:
Date: 05/01/2025
- Incorporated buying and selling pressure in lower timeframes to enhance the probability of trending moves while optimizing entry timing and scaling
HMT v4.1:
Date: 06/01/2025
- Enhanced take-profit (TP) target by incorporating market structure analysis
HMT v5 :
Date: 23/01/2025
- Refined wave analysis for trending conditions
- Incorporated lower timeframe (LTF) momentum to strengthen trend reliability
- Re-aligned and re-balanced entry conditions for improved accuracy
HMT v6 :
Date : 15/02/2025
- Integrated strong accumulation activity into in-depth wave analysis
HMT v7 :
Date : 20/03/2025
- Refined wave analysis along with accumulation and market sentiment
HMT v8 :
Date : 16/04/2025
- Fully restructured strategy logic
HMT v8.1 :
Date : 18/04/2025
- Refined Take Profit (TP) logic to be more conservative for improved win consistency
LMT v1.0 :
Date : 06/06/2025
- Rebranded to emphasize key levels + momentum as the core framework
LMT v2.0
Date: 11/06/2025
- Fully restructured lower timeframe (LTF) momentum logic
Compound tuns hyper-bullish · Big vs small · PP: 150% - 333%This is the most bullish Compound has been since April 2025. The bottom being clearly revealed through price action and trading volume.
Price action: Higher lows since October 2025. Very strong bullishness recently with six consecutive days closing green. A broken down-trendline coupled with a decisive move above EMA55 daily confirms we are ready for a bullish wave.
Trading volume: Buyers clearly have the upper-hand when we consider the volume indicator. The VRVP also supports growth back to baseline levels.
Notice that it is the same all around. Or at the least very similar because of the usual variations. We have two lows, October 2025 and February 2026. Can be either for any project. Bigger projects have less volatility of course; older projects are also holding good. Smaller and newer projects are hitting bottom this year. COMPUSDT last year. The chart looks good.
The first target around $52 opens 150% from current price. If we were to count from the 6-February low that gives us more than 250%.
The second target opens up some 333% around $90. From the 6-Feb low, this would be equal to more than 500%.
So, there you have it, that's the size and potential for the coming months on this project. See how the smaller projects can grow 300% within days, while a bigger project can cap much sooner. It is all about size. Choose wisely.
Namaste.
COMPUSDT – Market Brain View | H4 Long CycleCOMPUSDT – Market Brain View | H4 Long Cycle
Market Brain View
COMPUSDT has completed a strong H4 impulse and is now consolidating near the local high.
The market may continue higher first, then watch for a deeper correction back into the key support zone.
Cycle Structure
Impulse → Consolidation → Expansion → Correction into support.
Entry Logic
Current structure still supports a bullish continuation toward the next resistance zone.
A deeper re-entry zone is around 18.50 if the market pulls back after the expansion.
Profit Map
First target: 22.7 area
If momentum expands, price may continue higher before the next correction phase.
Risk Control
Key support / re-entry zone: 18.50
If price loses structure around this zone, the bullish setup weakens.
Rainbowsniper Logic
Markets move in cycles.
Impulse creates opportunity.
Consolidation builds continuation.
Correction creates the next entry.
Find the Bottom to Buy.
Find the Peak to Sell.
Disclaimer
This analysis is for educational and informational purposes only.
Always manage risk and make your own trading decisions.
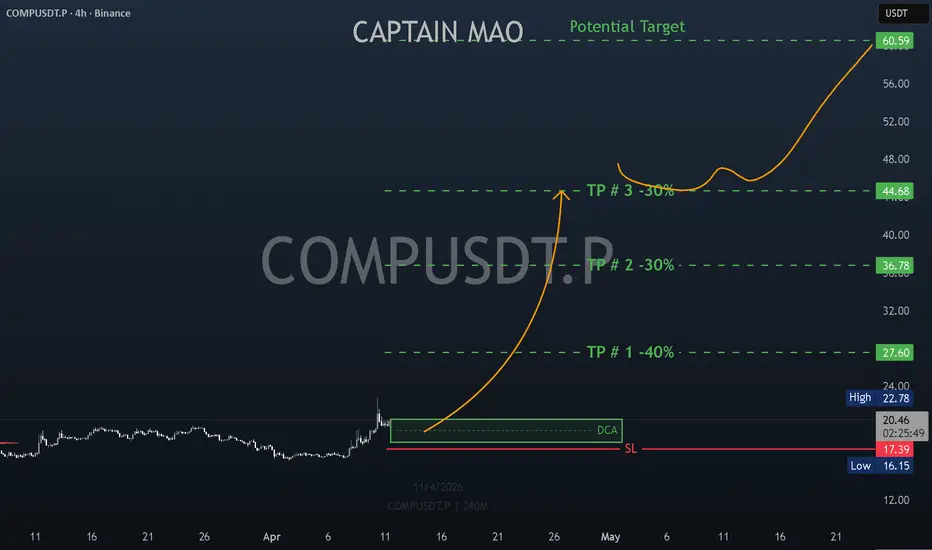
COMP/USDT — Strong Reclaim & Upside PotentialCOMP/USDT has strongly reclaimed the $19 zone, with buyers stepping in aggressively and pushing price back above $20. This reclaim signals a shift in momentum and renewed strength.
Current levels offer a solid area to start DCA, as the structure suggests a potential move toward the $44–$50 resistance zone.
Compound: brewing opportunity? key levels to monitor for todayCompound
Anyone watching COMP quietly coil here while the rest of DeFi grabs headlines again? According to the market, renewed interest in lending protocols and rising on‑chain activity around governance tokens is slowly waking this sector up. Today price is still stuck under that heavy red supply zone above, but bulls haven’t fully let go of control yet.
On the 4H chart, RSI is cooling off from mid levels and price is pulling back toward the green demand area around 18.2‑18.0, which lines up with recent volume support. As long as that box holds, I’m leaning long, looking for a rotation back into the upper range and a possible stab at the 19.5‑20 zone where we last saw strong selling. If fresh DeFi hype continues, that supply could get eaten faster than people expect.
My plan: ✅ watch for a wick into the 18.2‑18.0 zone with a bounce and reclaim of intraday highs, then I’m interested in longs targeting 19.3 first and 19.8‑20 next. If price closes cleanly below 18.0 and stays there, I flip the script and look for a slide toward the next green block near 17 and maybe 16.5. I might be wrong, but right now COMP looks like a dip I’d rather buy than short.
COMPUSDT: Strong BullCompound is showing one of the cleaner bull setups in this session with a critical leverage caveat. Spot at 19.35 with futures at 19.29 — a -0.31% backwardation, Z at -0.5, Yield at -340% APY 0.5σ Bull. Funding is paying longs at a statistically meaningful rate, penalizing shorts with carry cost. S/F Vol at 20.53K spot versus 1.15M futures, S/F S at 397.25K versus 22.24M — Spot:Fut reads Normal. The ratio is elevated toward futures but not in Ghost Market territory. The DEMAND zone on the chart is providing the structural floor this price is sitting directly above, making zone integrity the single most important near-term variable.
Signal count is 44 green to 13 red out of 112 — 70.7% green alignment. Strong BULL at 41.5% edge at 2.42x. C>T 12:2 confirms strong trend-price alignment. EMA stack 4:3 leans bullish but not a clean sweep. Candle 14:0 is a complete bull sweep — zero bearish candle signal across all 14 timeframes. Engulf 5:0 clean. Ichi TK 6:8 is the primary bearish holdout — Ichimoku remains bear dominant across timeframes, signaling the longer-term cloud structure has not yet confirmed the bull case. SS/DD 2:11 is a heavily bearish structural backdrop, the most significant counter-signal in the panel. Spread at 41.5% Strong confirms committed wide-body candles. Squeeze Building at only 3 bars with Mom Bull↓ and BW 10.27% Coiling — the squeeze is in early formation, bandwidth compressing toward a resolution that is still bars away. MeanZ at -1.66σ Fall is statistically significant — price is 1.66 standard deviations below its mean, a historically favorable entry zone for mean reversion trades.
Spot Z -0.7 Quiet, Fut Z -0.72 Quiet, F+S Z -0.72 Quiet. All three volume readings below average. SpotZ 1:5 reads -0.7 vs -0.51 with combined -0.19 Falling↓ — volume is below baseline on both short and longer timeframes, drifting lower. Bull:Bear Z -0.4 vs -0.5 Neutral — neither side dominating at volume level. S.Mom 534% Con↓ Expanding — spot momentum is contracting while bands are still expanding, a transition signal suggesting the momentum peak has passed and consolidation is beginning. This is consistent with the squeeze building in its early stage — energy compressing after an expansion event. Mkt Normal — market quality clean throughout.
Leverage at 55.8x Danger, Percentile at 4.9% Bottom — this is the most important risk parameter in this panel. Leverage is classified Danger, yet the percentile reads near absolute floor at 4.9%, with AT Min at 15.59x 607 bars ago and AT Max at 832.17x 1965 bars ago. The 55.8x Danger reading at the 4.9th percentile means leverage is near historically clean levels for this instrument — Danger is the absolute classification, but relative to COMP's own history this is near the minimum synthetic positioning environment. Price at 24.1% Floor with Hi/Lo at 30.43 vs 15.83 confirms COMP is in the lower quarter of its historical range, providing meaningful upside headroom to mean and prior range midpoint.
OBV Z -0.66 Inflow with Normal divergence is the primary confirming read — and it is the key distinction separating this panel from the bear setups in this session. OBV is in Inflow despite negative absolute Z, meaning volume flow is accumulative even in a quiet volume environment. Smart money is buying the quiet. Pat Tot 3:0 and Star 3:0 give a clean bullish pattern sweep with zero bearish reversal patterns detected. No whale signal. Liquidation cleared. Sqz Div Normal. The 3-bar squeeze building on top of OBV Inflow at a -1.66σ mean deviation is a technically sound early accumulation signature.
The honest read: COMPUSDT is the most structurally credible bull setup in this session, but it requires patience. The squeeze is only 3 bars old — resolution is not imminent. Candle 14:0 sweep, OBV Inflow, -340% APY funding tailwind, -1.66σ below mean, and price sitting directly on the DEMAND zone form a legitimate accumulation thesis. The counterweights are real: SS/DD 2:11 structurally bearish, Ichi TK 6:8 bear dominant, and volume universally quiet with no acceleration signal yet. Clarity at 51% is the lowest conviction threshold for a valid bull setup. The trade is to watch the squeeze develop — when BW begins expanding with spot volume Z recovering above zero and OBV maintaining Inflow, the DEMAND zone entry becomes high-conviction. A close below the DEMAND zone invalidates the thesis entirely.
Is That Crypto Pump Real? Data Says No. Here's Why.
Stop Losing Money to Fake Volume. Find Real Moves Now.
Trade the REAL Crypto Volume. Stop Getting Faked Out.
Compound trades at bargain prices: 3,365% potential with 5XWe are going to be looking at COMPUSDT (Compound) up-close. Just one candle is needed to confirm a bullish wave coming up next. It is a series of events but yesterday's candle coupled with today gives the full confirmation.
The low happened 6-Feb. followed by a strong reaction, the first bullish signal. This move, mid-Feb, gets corrected through a retrace that ends 8-March. On the 11 we get a full green candle and yesterday the action turns red.
Today, COMPUSDT turns bullish again with the session trading above yesterday's close. That's the bullish continuation confirmation. The fact that the market turns green immediately after a red day.
On a bearish market, the full green candle on the 11-March session would be quickly rejected leading to lower prices. A neutral candle followed by green signals the market has more to give.
Now we look at the whole chart since the correction ended. Higher lows and consolidation at bottom prices. You are seeing a true bottom formation. You are seeing the start of massive growth.
It is amazing. You will see how everything changes in a single day.
The above signals are supported by multiple indicators: COMPUSDT is trading above EMA34, the RSI entered the bullish zone and the MACD has been growing for months.
A target first of $32 can be an easy hit. The next main resistance comes at $51. If the final target is $143 for a major bullish wave, we are talking of some 3,365% with 5X.
Thank you for reading.
Namaste.
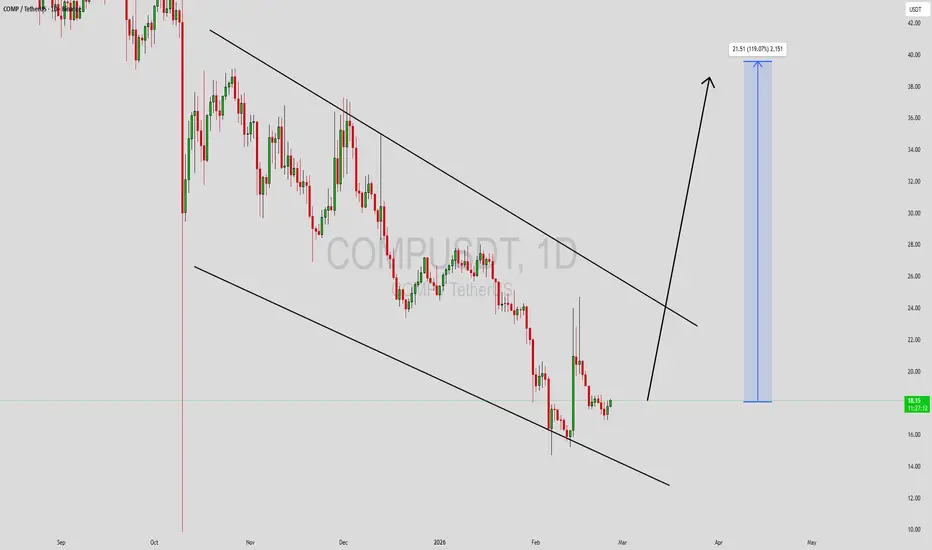
COMPUSDT Forming Falling wedgeCOMPUSDT is forming a clear falling wedge pattern, a classic bullish reversal signal that often indicates an upcoming breakout. The price has been consolidating within a narrowing range, suggesting that selling pressure is weakening while buyers are beginning to regain control. With consistent volume confirming accumulation at lower levels, the setup hints at a potential bullish breakout soon. The projected move could lead to an impressive gain of around 90% to 100% once the price breaks above the wedge resistance.
This falling wedge pattern is typically seen at the end of downtrends or corrective phases, and it represents a potential shift in market sentiment from bearish to bullish. Traders closely watching COMPUSDT are noting the strengthening momentum as it nears a breakout zone. The good trading volume adds confidence to this pattern, showing that market participants are positioning early in anticipation of a reversal.
Investors’ growing interest in COMPUSDT reflects rising confidence in the project’s long-term fundamentals and current technical strength. If the breakout confirms with sustained volume, this could mark the start of a fresh bullish leg. Traders might find this a valuable setup for medium-term gains, especially as the wedge pattern completes and buying momentum accelerates.
✅ Show your support by hitting the like button and
✅ Leaving a comment below! (What is your opinion about this Coin?)
Your feedback and engagement keep me inspired to share more insightful market analysis with you!
COMP: watching for a bounce? key levels to focus on todayCOMP. Who else is watching this DeFi OG drip straight back into the same demand zone that launched the last vertical candle? According to market chatter, DeFi names are back on the radar as traders rotate from majors into higher beta plays, and COMP is sitting right on the front row.
On the 4H chart, price is parked in the 17-18 support block, the same area that started the previous spike. RSI is hugging the 30 line, showing short-term exhaustion from sellers, while that sharp impulse up left a nice liquidity pocket above. For me that tilts the odds toward a bounce rather than an immediate breakdown, with 19.8 as the first magnet.
My base plan: bullish scalp from this zone toward 19.5-19.8, then reassess ✅ A clean 4H close below 17 would kill the long idea and open room toward 16 and maybe lower, so that is where I’d place my invalidation ⚠️ I might be wrong, but right now shorting directly into this support looks braver than buying the dip.