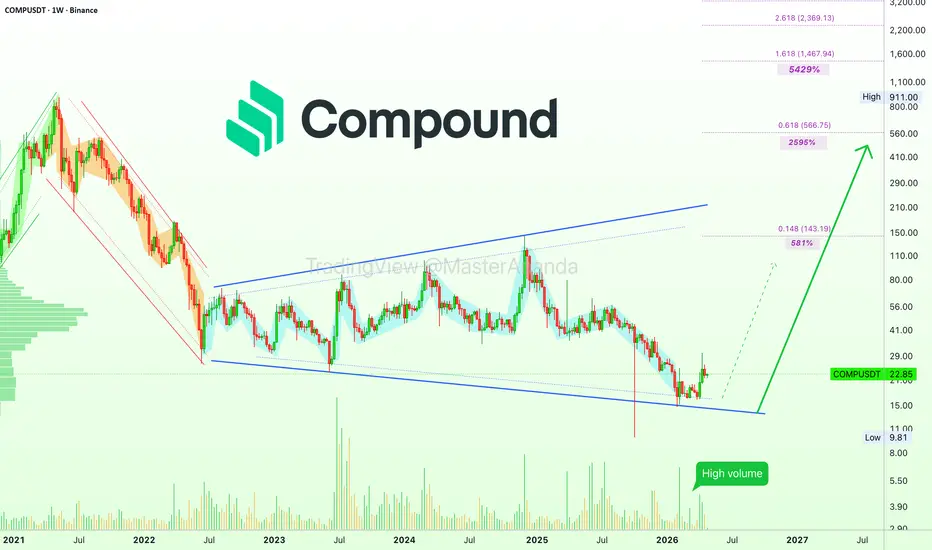
Compound: Bottom complete vs the 2026 Cryptocurrency bull-marketCan COMPUSDT grow 9,000%? Very doubtful, this is beyond a new all-time high, it is beyond the chart structure and cycle projections, I don't think it possible.
For COMPUSDT to produce 9,770% total growth from current prices, around $24, it would need to rise all the way to $2,369. Now, don't get me wrong, it is always possible and many Cryptocurrencies have been known to grow this much during a strong bullish period, it is just not do-able here based on the chart.
A most reasonable target is $
In-depth trading ideas
COMP — Key Technical Structure in Focus | Breakout & Retest SetuCompound (COMP) is the governance token of the Compound protocol, one of the established decentralized finance (DeFi) lending ecosystems. The protocol enables users to supply crypassets to earn interest or borrow against collateral, with rates determined by market supply and demand. Compound currently operates lending markets across multiple blockchain networks.
Fundamental Context
Compound remains an active DeFi lending protocol, currently showing approximately $1.82B in total supplied assets
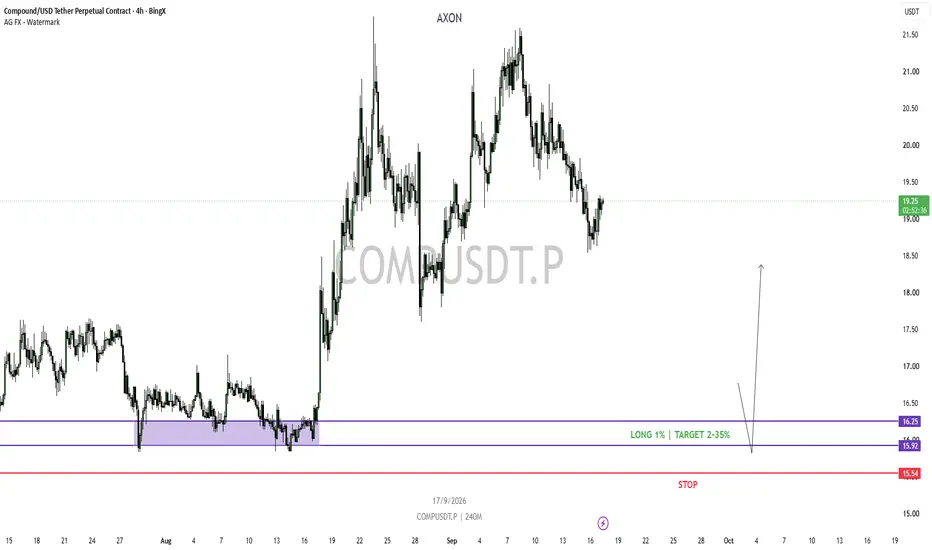
COMP/USDT — Long Setup from a Proven Demand ZoneCOMP is approaching a price area that previously acted as a clear accumulation zone before a strong expansion higher.
The 15.92–16.25 range was tested multiple times before buyers finally took control and pushed price significantly above $20. What makes this area interesting is not a single reaction, but the amount of time price previously spent accepting value here before the breakout.
For this setup I am looking at:
Long zone: 15.92–16.25
Invalidation: 15.54
Risk: 1%
If price returns into
COMPUSDT Forming Bullish MomentumCOMPUSDT is forming a clear bullish momentum pattern, a classic bullish reversal signal that often indicates an upcoming breakout. The price has been consolidating within a narrowing range, suggesting that selling pressure is weakening while buyers are beginning to regain control. With consistent volume confirming accumulation at lower levels, the setup hints at a potential bullish breakout soon. The projected move could lead to an impressive gain of around 30% to 40% once the price breaks above
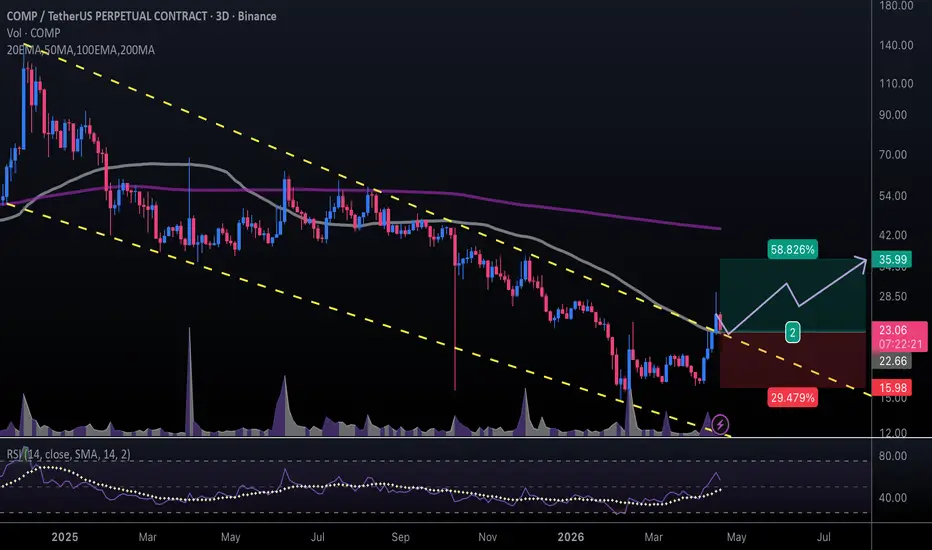
#COMPUSDT #3D (Binance) Falling wedge breakout and retest [LONG]Compound regained 50MA support and is pulling back to it, seems likely to resume bullish towards 200MA resistance next.
⚡️⚡️ #COMP/USDT ⚡️⚡️
Exchanges: Binance Futures
Signal Type: Regular (Long)
Leverage: Isolated (2.0X)
Amount: 5.1%
Entry Targets:
1) 22.66
Take-Profit Targets:
1) 35.99
Stop Targets:
1) 15.98
Published By: @Zblaba
CRYPTOCAP:COMP BINANCE:COMPUSDT.P #3D #Compound #DeFi compound.finance
Risk/Reward= 1:2.0
Expected Profit= +117.7%
Possible Loss= -59.0%
Estimated Duration
COMP — Trapped in a Descending Channel, Breakout Incoming?📊 Technical Analysis
💵 Coin: NYSE:COMP / USDT
⌛ Time Frame: 3D
📉 Pattern: Descending Channel
📍 Current Price: ~$17.89
---
📐 DESCENDING CHANNEL
NYSE:COMP remains within a Descending Channel that has been developing since the major high around $120+.
🔴 The Upper Trendline has acted as dynamic resistance and has repeatedly limited bullish recovery attempts.
🟡 The Lower Trendline acts as dynamic support and defines the lower boundary of the channel.
🟢 The Middle Trendline can be used as a
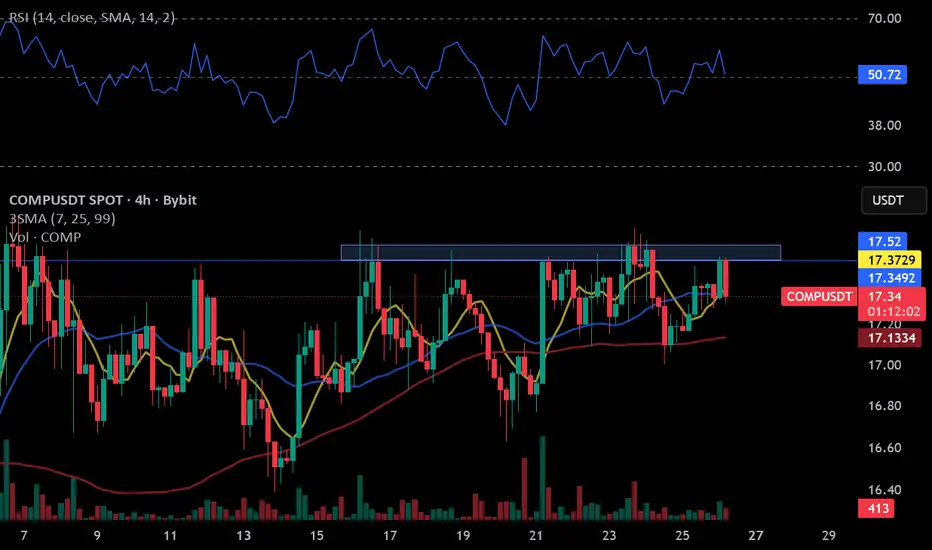
COMPUSDT COMPUSDT has remained below the 17.52 resistance level for the past 21 days. A confirmed breakout above this zone could trigger a strong bullish move.
Despite Bitcoin's recent market conditions, COMP has shown notable resilience and has not experienced any significant bearish reaction. On the 4-hour timeframe, the price is forming a series of higher lows while maintaining equal highs, creating an ascending triangle pattern. This structure reflects increasing buying pressure, and a confirmed bre
COMP – Buyers vs. Sellers | Breakout Loading### **Technology Overview**
Compound (COMP) is a decentralized DeFi lending protocol that enables users to lend and borrow digital assets without intermediaries. The COMP token serves as the protocol's governance token, allowing holders to participate in key decisions regarding the platform's development and future direction.
### **Technical Analysis**
On the **30-minute chart**, the **yellow lines represent the trading range (value area) of the current structure**, with the price now approac
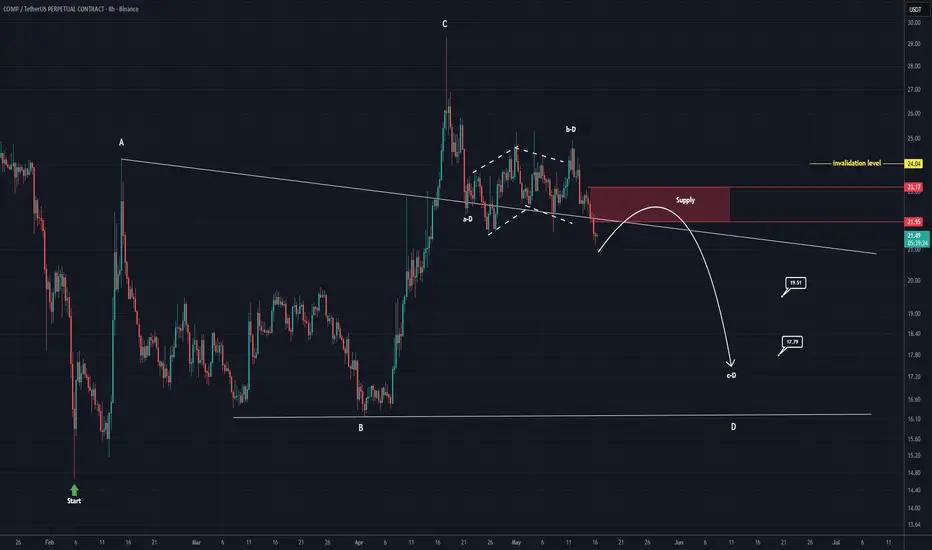
COMP is at risk of initiating a deep drop! (8H)COMP is currently retesting previously broken trendlines and a flipped resistance zone, which is now acting as a key decision area for price action.
In fact, COMP appears to be attempting to complete wave E of a larger corrective structure, suggesting that the final leg of the pattern may still be in progress before a potential continuation to the downside.
The highlighted red zone represents a high-probability entry area for a short position, where bearish reactions are expected if price conf
COMP Under Pressure | Is a Crash Coming? (8H)From the point where we placed the green arrow on the chart, a triangle pattern appears to be forming. We are currently in wave D of this triangle. Wave 1 and wave 2 have already been completed, and we now expect wave 3, meaning wave C of wave D, to develop soon.
The supply zone could provide a potential short entry opportunity.
Targets are marked on the chart. Move to breakeven at the first target.
A daily candle close above the invalidation level would invalidate this scenario.
If you have
Wave F Target: High Volume Zone Rebound Ahead of Next Leg DownI am currently anticipating a rebound in the blue area, which represents a previous High Volume Node (HVN). This move should complete Wave F.
Red Rectangle Watch: Please note the volume area marked by the red rectangle. I believe this minor support will not hold the price for long.
Downside Targets: My main targets are the demand zones between $17.40 and $15.60.
Conclusion: There is a high probability of the market making a new low after this corrective structure plays out.
Compound: 480% First · Resistance is about to breakSince mid April resistance is being challenged on this chart based on the weekly timeframe. COMPUSDT is trying to move higher, without success so far, yet, the chart conditions continue to improve.
Buyers are being rejected at resistance but there are no new lows. Five weeks with the same barrier still active but we continue with a green market and chart. COMPUSDT is ready to move higher.
Long-term growth shows huge potential available for this trading pair. But we have to start somewhere, and
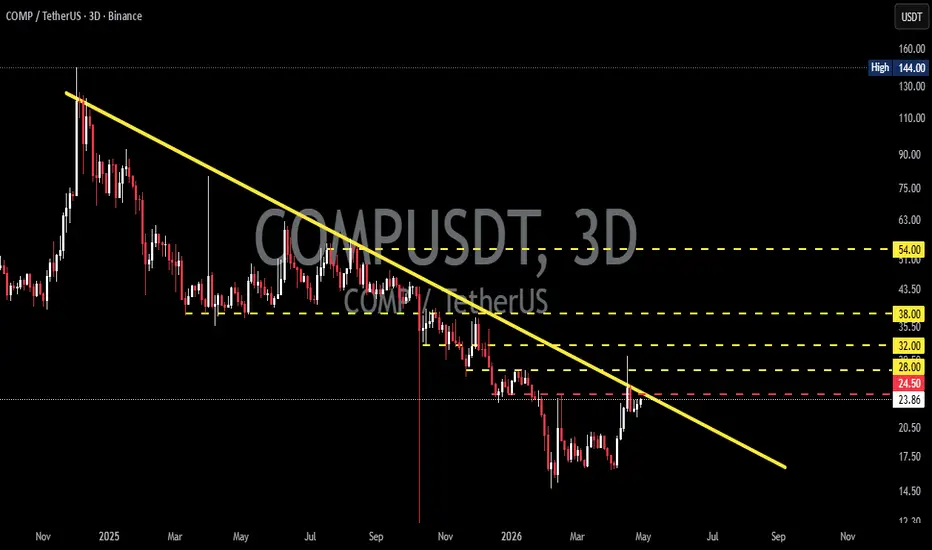
COMP/USDT — Descending Trendline, Breakout or Rejection?On the 3D timeframe, COMP/USDT remains in a strong downtrend structure, clearly defined by a descending trendline (yellow line). Price continues to form lower highs and lower lows, indicating sustained selling pressure in the mid- to long-term.
Currently, price is testing a key decision zone:
Trendline resistance
Horizontal resistance around 24.5 USDT
This area will likely determine the next major move.
---
📉 Structure & Pattern
🔻 Descending Trendline (Downtrend Structure)
A consistent
COMPUSDT Forming Bullish MomentumCOMPUSDT is currently forming a clear bullish momentum pattern, a classic wave structure that often signals an upcoming breakout. The price has been consolidating within a narrowing range, indicating that selling pressure is gradually weakening while buyers are beginning to regain control. With consistent volume supporting accumulation at lower levels, the setup suggests a strong potential for a bullish breakout in the near term.
If the price breaks above the wedge resistance, the projected mov
COMPUSDT 3D#COMP is moving within a descending channel on the 3-day timeframe chart. Consider entering this coin only after a clean breakout above the channel. In that case, the upside targets are:
🎯 $31.91
🎯 $37.24
🎯 $42.56
🎯 $50.13
🎯 $59.78
⚠️ Always remember to use a tight stop-loss and maintain proper risk management.
Compound · Early bullish action & long-term growthGood afternoon my fellow Cryptocurrency trader, I hope you are having a wonderful day.
›› Is the current move real or fake?
›› Are we witnessing the start of a new cycle, a new bullish period or a bull-trap, which one is it?
›› How to know if this move promises higher prices or if the results will be the same as before?
Great questions, let's ask the chart.
Compound has been bearish for years, when it comes to the broader market cycle and chart structure —since May 2021.
Compound has been
Bears are in control of COMP price action (8H)Price has reacted to a supply zone and then broke below the bullish trendline to the downside. We also have a bearish ICH structure on the chart, and the candle that touched the supply was rejected immediately with a wick. Based on this, it is expected that COMP may move toward lower levels.
Two clear entry points have been marked for DCA entries.
Targets are marked on the chart, and at the first target you should move to break even.
A daily candle close above the invalidation level will inval
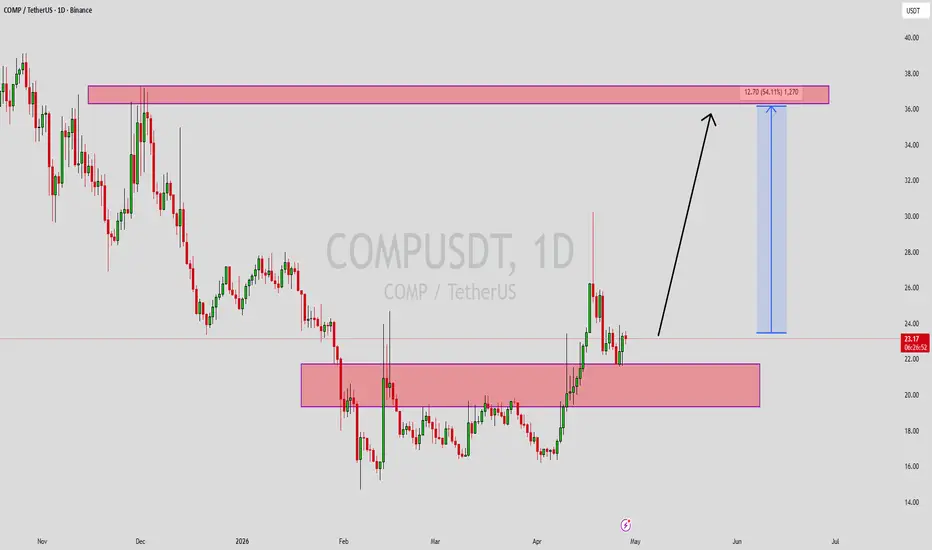
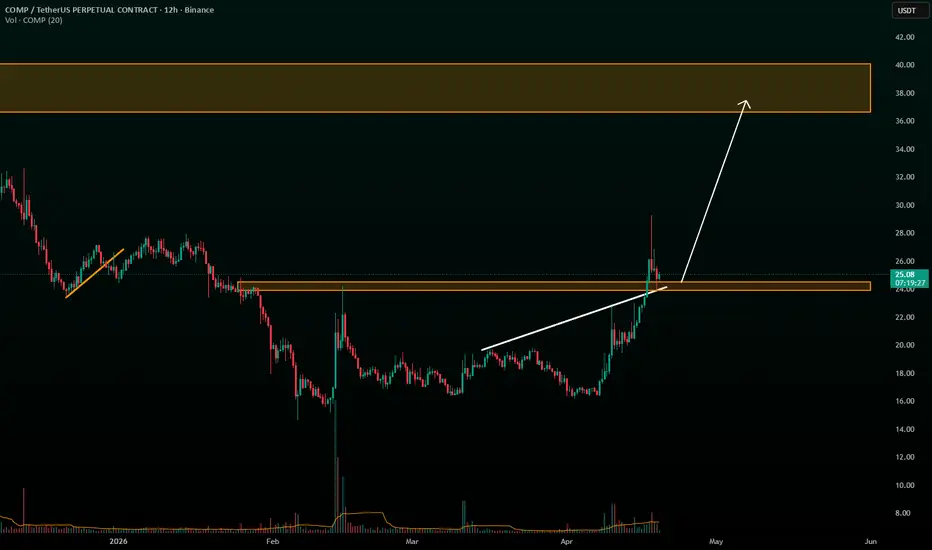
COMP/USDTKey Level Zone: 23.90 - 24.50
LMT v2.0 detected.
The setup looks promising—price previously trended upward with rising volume and momentum, then retested this zone cleanly. This presents an excellent reward-to-risk opportunity if momentum continues to align.
Introducing LMT (Levels & Momentum Trading)
- Over the past 3 years (SINCE 2022), I’ve refined my approach to focus more sharply on the single most important element in any trade: the KEY LEVEL.
- While HMT (High Momentum Trading) served m
Compound tuns hyper-bullish · Big vs small · PP: 150% - 333%This is the most bullish Compound has been since April 2025. The bottom being clearly revealed through price action and trading volume.
Price action: Higher lows since October 2025. Very strong bullishness recently with six consecutive days closing green. A broken down-trendline coupled with a decisive move above EMA55 daily confirms we are ready for a bullish wave.
Trading volume: Buyers clearly have the upper-hand when we consider the volume indicator. The VRVP also supports growth back to b
COMPUSDT – Market Brain View | H4 Long CycleCOMPUSDT – Market Brain View | H4 Long Cycle
Market Brain View
COMPUSDT has completed a strong H4 impulse and is now consolidating near the local high.
The market may continue higher first, then watch for a deeper correction back into the key support zone.
Cycle Structure
Impulse → Consolidation → Expansion → Correction into support.
Entry Logic
Current structure still supports a bullish continuation toward the next resistance zone.
A deeper re-entry zone is around 18.50 if the market pulls b
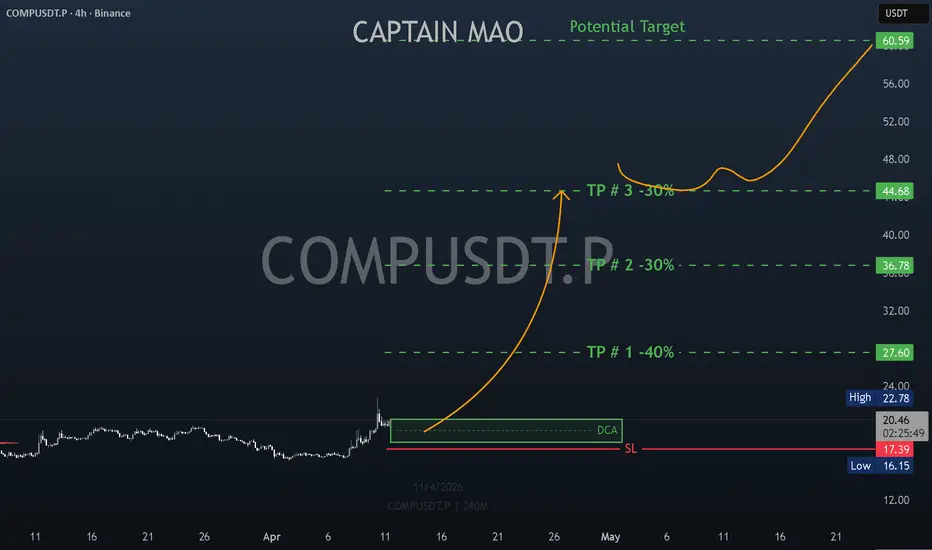
COMP/USDT — Strong Reclaim & Upside PotentialCOMP/USDT has strongly reclaimed the $19 zone, with buyers stepping in aggressively and pushing price back above $20. This reclaim signals a shift in momentum and renewed strength.
Current levels offer a solid area to start DCA, as the structure suggests a potential move toward the $44–$50 resistance zone.
Compound: brewing opportunity? key levels to monitor for todayCompound
Anyone watching COMP quietly coil here while the rest of DeFi grabs headlines again? According to the market, renewed interest in lending protocols and rising on‑chain activity around governance tokens is slowly waking this sector up. Today price is still stuck under that heavy red supply zone above, but bulls haven’t fully let go of control yet.
On the 4H chart, RSI is cooling off from mid levels and price is pulling back toward the green demand area around 18.2‑18.0, which lines u
COMPUSDT: Strong BullCompound is showing one of the cleaner bull setups in this session with a critical leverage caveat. Spot at 19.35 with futures at 19.29 — a -0.31% backwardation, Z at -0.5, Yield at -340% APY 0.5σ Bull. Funding is paying longs at a statistically meaningful rate, penalizing shorts with carry cost. S/F Vol at 20.53K spot versus 1.15M futures, S/F S at 397.25K versus 22.24M — Spot:Fut reads Normal. The ratio is elevated toward futures but not in Ghost Market territory. The DEMAND zone on the chart