COOKIE Holding Above Key Value AreaCOOKIE has delivered an impulsive rally, shifting momentum back in favor of the bulls after reclaiming key technical levels. Price is now trading above the Point of Control (POC), the highest volume-traded area within the previous range, which is acting as an important support level.
Holding above the POC suggests buyers remain in control and increases the probability of a rotational move toward higher resistance if bullish momentum continues. As long as this high-volume level is defended, the overall structure remains constructive and favors continuation to the upside.
The next key level to monitor is the 0.618 Fibonacci retracement. Should price experience a pullback, this Fibonacci level could provide an ideal area for buyers to step back into the market. A successful retest, followed by a strong close above the 0.618 level, would confirm that the retracement is healthy and reinforce the existing bullish trend.
If buyers defend both the Point of Control and the 0.618 Fibonacci support, the probability of another bullish rally increases significantly, with price likely rotating toward the next major resistance levels. Until those supports are lost, any short-term weakness should be viewed as a potential pullback within a broader uptrend rather than the beginning of a bearish reversal.
In-depth trading ideas
COOKIEUSDT 1D#COOKIE has broken above the descending resistance and is now facing the daily SMA100. In case of a breakout above it, the potential upside targets are:
🎯 $0.0230
🎯 $0.0279
🎯 $0.0320
🎯 $0.0360
🎯 $0.0416
🎯 $0.0489
⚠️ Always remember to use a tight stop-loss and maintain proper risk management.
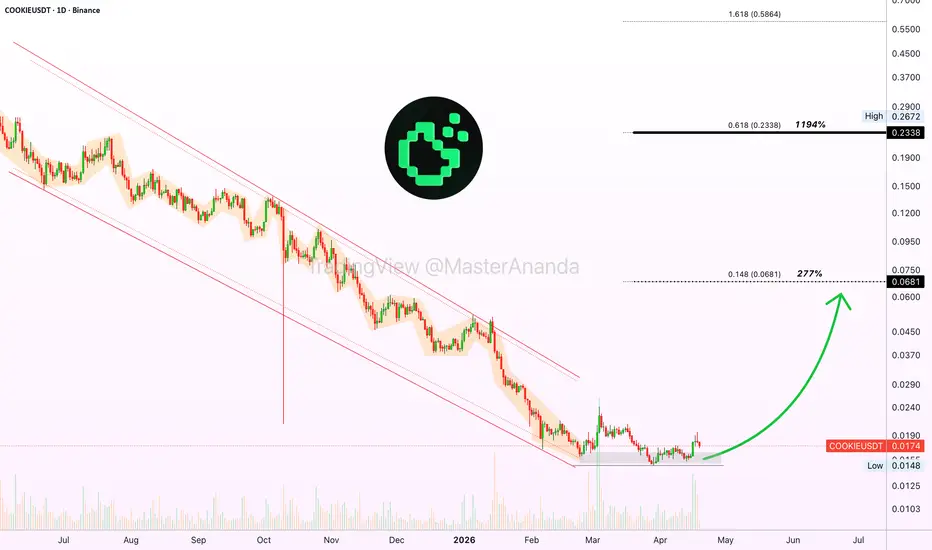
Cookie DAO: Buying the bottom & planning for the long-term"Cookie DAO is an index & data layer for AI agents."
COOKIEUSDT went through the biggest downtrend in its history and is now trading at bottom prices. Volume started to rise in January and this month we have the highest since the start of the downtrend after an all-time low. Whale accumulation at the lows.
We can see how bearish volume becomes lower as the drop intensifies. A signal that shows bearish momentum waning, disappearing until indeed, there are no new lows.
The greatest advantage of being a bottom buyer is the huge potential for growth.
An easy target on COOKIEUSDT can yield 277%. A mid-term target after sustained growth can reach 1,194%. Risk is extremely low; after buying, focus on the long-term. Just buy and hold.
If the market continues lower, there is nothing to worry about, all losses can be recovered in a matter of days when the market turns bullish.
Think of this: Bitcoin hit bottom at $60,000 and this price was available only for a matter of hours. Imagine a lower low at $58,000. How long do you think this price would be available to buyers? Not even ten minutes in most cases.
If Bitcoin is set to grow to $200,000, $300,000 and beyond in the coming years, instead of focusing on "waiting for the bottom," it is better to buy and hold.
$62,000 is as good as $60,000. But $60,000 is not do-able. Most people are lucky if they get to buy below 70K. It is the truth. Any buy below $80,000 will be an amazing buy when focusing on the long-term.
The bottom for the purpose of buying should be thought of as a price range. And the planning should be based on years or months. Buying today, to collect profits in 2-3 years. That's a long-term plan. That's the way to win. Focus on the long-term.
Namaste.
COOKIEUSDT 4H Chart Analysis (as of April 6, 202)
Current Market Price: 0.01668 USDT (+2.84%)
📊Overall Trend:
The token remains in a prolonged downtrend since mid-March, characterized by lower highs and lower lows. Price has been trading below a descending blue resistance trendline.
👀KEY OBSERVATIONS:
- Strong sell-off occurred around March 19–22.
- Price is currently consolidating in a choppy range between ~0.0155 and 0.0170.
- It is testing a significant horizontal level at 0.0168–0.0169, where the red descending trendline is also crossing.
- Blue shaded zones highlight previous consolidation areas (resistance ~0.0172–0.0175, support ~0.0158–0.0162).
TECHNICAL OUTLOOK:
🚀Bullish case: A decisive break above 0.0169–0.0170 could target 0.0173 and the descending resistance (~0.0175–0.0180).
💦Bearish case: Rejection here may lead to another decline toward 0.0158 or 0.0150.
- The structure shows a compression phase within a downward channel volatility is contracting, often a setup for a larger move.
KEY LEVELS:
🔴Resistance: 0.0169 → 0.0173 → descending blue line
🟢Support: 0.0162 → 0.0158 → 0.0150
CONCLUSION:
COOKIEUSDT is stabilizing after a downtrend but still lacks a clear reversal signal. The next few candles will be critical for determining whether it breaks higher or continues the bearish structure.
Cookie DAO: Buying the bottom & long-term planning"Cookie DAO is an index & data layer for AI agents."
COOKIEUSDT went through the biggest downtrend in its history and is now trading at bottom prices. Volume started to rise in January and this month we have the highest since the start of the downtrend after an all-time low. Whale accumulation at the lows.
We are seeing the development of an inverted head and shoulders pattern. A sequence of three lows with the middle one being the lowest.
A bottom in early February. A lower low late February and a higher low in March. This is a reversal signal.
At the same time, we can see how bearish volume becomes lower as the drop intensifies. A signal that shows bearish momentum waning, disappearing until indeed, there are no new lows.
The greatest advantage of being a bottom buyer is the huge potential for growth.
An easy target on COOKIEUSDT can yield 277%. A mid-term target after sustained growth can reach 1,194%. Risk is extremely low; after buying, focus on the long-term. Just buy and hold.
If the market continues lower, there is nothing to worry about, all losses can be recovered in a matter of days when the market turns bullish.
Think of this: Bitcoin hit bottom at $60,000 and this price was available only for a matter of hours. Imagine a lower low at $58,000. How long do you think this price would be available to buyers? Not even ten minutes in most cases.
If Bitcoin is set to grow to $200,000, $300,000 and beyond in the coming years, instead of focusing on "waiting for the bottom," it is better to buy and hold.
$62,000 is as good as $60,000. But $60,000 is not do-able. Most people are lucky if they get to buy below 70K. It is the truth. Any buy below $80,000 will be an amazing buy when focusing on the long-term.
The bottom for the purpose of buying should be thought of as a price range. And the planning should be based on years or months. Buying today, to collect profits in 2-3 years. That's a long-term plan. That's the way to win. Focus on the long-term.
Namaste.
COOKIE/USDT Showing Bullish Signs—Rally Toward $0.02201 PossibleCOOKIE / USDT is currently showing positive signs of a potential bullish rally toward the $0.02139 – $0.02201 target zone. As long as the price continues to hold above our key support level, the probability of bullish continuation remains strong. A sustained hold above this zone could fuel further upside momentum toward our targets. As always, manage risk wisely and avoid entering trades without proper confirmation.
#COOKIE/USDT BROKEN OUT OF DESCENDING TRAINGLE#COOKIE
The price is moving within a descending channel on the 1-hour frame, adhering well to it, and is heading for a strong breakout and retest.
We have a bearish trend on the RSI indicator that is about to be broken and retested, which supports the upward breakout.
There is a major support area in green at 0.0920, representing a strong support point.
We are heading for consolidation above the 100 moving average.
Entry price: 0.0950
First target: 0.0974
Second target: 0.1006
Third target: 0.1040
Don't forget a simple matter: capital management.
When you reach the first target, save some money and then change your stop-loss order to an entry order.
For inquiries, please leave a comment.
Thank you.
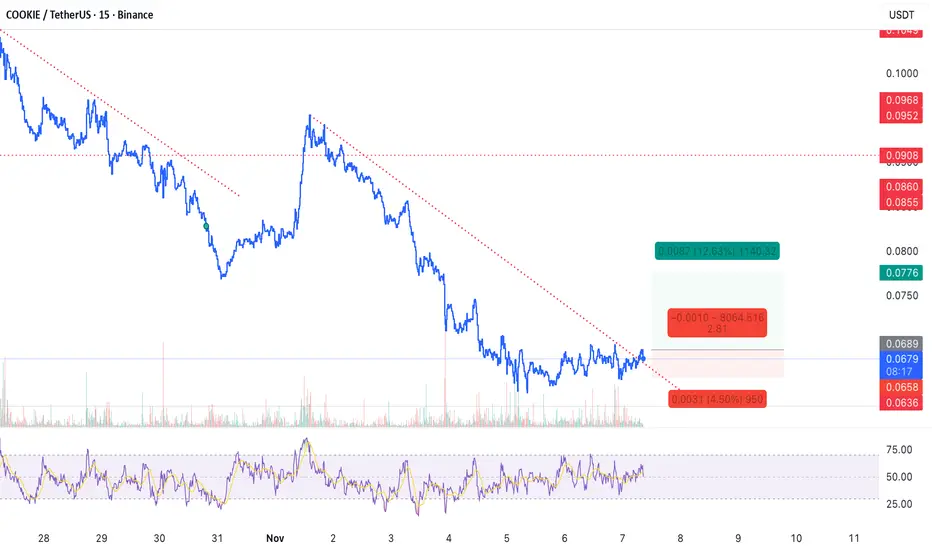
Scalp Long – COOKIE📈 Scalp Long – COOKIE
Price has fully broken out of the downtrend, signaling a potential shift in momentum. RSI is in the buying zone, and price action confirms signs of recovery. Momentum is aligning for a bullish move.
🎯 Trade Setup:
TP: 0.076
SL: 0.0657
RR: 1 : 2.81
A clean breakout-based long setup, supported by strong RSI confirmation
Cookie to the MoonStrong Bullish Pattern Forming
The chart is showing some really promising technical signals for COOKIE right now. Here's what I'm seeing:
Key Bullish Indicators:
1. Descending Wedge Pattern
Classic bullish reversal formation
Price is compressing near the apex with decreasing volume
These patterns historically resolve to the upside 60-70% of the time
We're approaching a critical breakout zone
2. RSI Bullish Divergence
Price making lower lows while RSI is showing higher lows (green arrow)
This is a textbook bullish divergence signal
Suggests weakening bearish momentum despite price decline
RSI bouncing from oversold territory
3. Strong Support Level
Horizontal support line being tested multiple times
Price finding buyers at this level
The more times support holds, the more significant the eventual move
4. Volume Profile
Volume decreasing during the downtrend (typical in wedge patterns)
Low volume = less selling pressure
Breakout should come with volume expansion
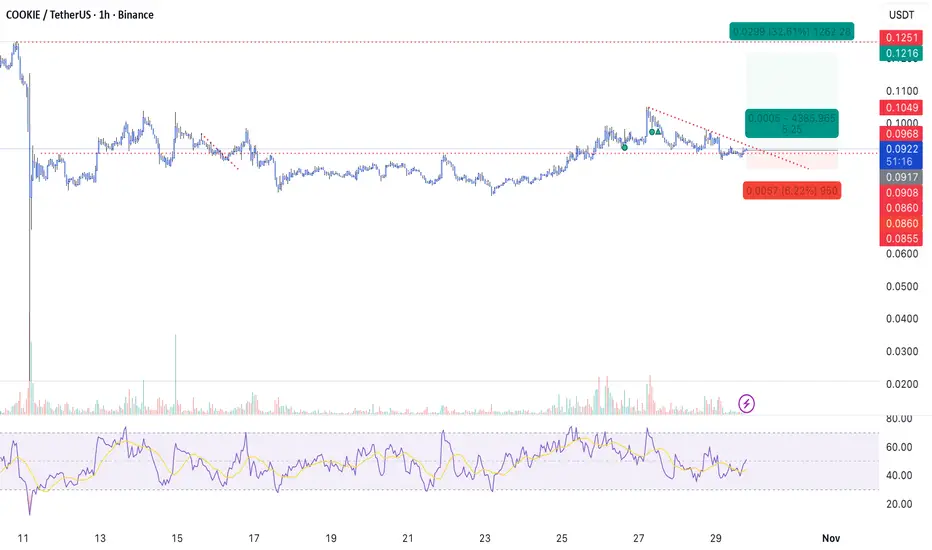
Scalp Long – COOKIE💎 Scalp Long – COOKIE
Price is recovering and preparing to break out of the short-term downtrend, signaling a potential shift in momentum.
🎯 Plan:
→ Enter after confirmation of breakout and retest.
→ TP: 0.1216 | SL: 0.086 | RR: 1 : 5.25
Momentum favors the long side.
Keep entries precise, trail SL as price advances.
Patience is key — only engage once the setup fully confirms.
Scalp Long – COOKIE💎 Scalp Long – COOKIE
RSI has completed its correction and is now in the strong buy zone.
Buying volume is surging, showing renewed market strength.
Price is moving to retest the previous local high, signaling bullish continuation.
🎯 Plan:
→ Enter after confirmation of momentum continuation.
→ TP: 0.1251 | SL: 0.0911 | RR: 1 : 2.49
Market structure favors the long side.
Keep entries clean, trail SL as price climbs.
Stay focused — only engage when the setup confirms.
COOKIEUSDTOf course, here is the English version of the last signal:
🚨 New Signal 🚨
📊 Symbol: COOKIE/USDT
🐂 Position Type: BUY/LONG
🟢 Entry Point: 0.0998
🎯 Take Profit (TP):
0.1209
🚫 Stop Loss (SL):
0.0899
⚠️ Always practice proper risk management.
📌 Note: This setup is based on Smart Money Concepts (SMC) and is targeting the Fair Value Gap (FVG) at a higher price.
COOKIEUSDT 1D#COOKIE is moving inside a falling wedge pattern on the daily chart. In case of a breakout above the wedge resistance and the daily SMA50, the potential targets are:
🎯 $0.1356
🎯 $0.1586
🎯 $0.1771
🎯 $0.1956
🎯 $0.2221
🎯 $0.2557
⚠️ Always remember to use a tight stop-loss and follow proper risk management.
COOKIE/USDT – Accumulation before potential breakout This is truly an amazing chart. ✨ I haven’t seen anything like this in the altcoin world for a long time, and it even reminds me of Bitcoin’s structure.
On the weekly chart, COOKIE has been trading in a yellow accumulation zone, while forming a descending trendline (yellow). The price is approaching a decision point – either a breakdown or a potential breakout to the upside.
Support: around 0.10 – 0.13 USDT
Resistance: descending trendline
Volume profile: shows strong interest in this range
Upside target (if breakout): green zone $3 – $4.5 🟢
📌 Conclusion: The market is in accumulation. Watch closely how price reacts at the trendline. A breakout to the upside could open the door for a significant rally.
COOKIE / USDT — Final Support Test: Breakout or Breakdown?📊 Overview
COOKIE price is currently sitting at a critical decision point: resting right on the major support zone (yellow box) that has held multiple times, while also being pressed down by a long-term descending trendline from January 2025. This forms a classic descending triangle pattern — historically a bearish continuation, but in crypto it can also act as an accumulation base before a strong breakout.
In short, the market is in a make-or-break phase.
---
🔎 Pattern & Price Structure
1. Descending Triangle
Clear lower highs from the 0.825 peak.
Horizontal support zone (yellow box) repeatedly absorbing selling pressure.
Price now squeezed into the apex → signaling that a strong move is imminent.
2. Support Zone (Demand Area)
The 0.12 – 0.13 region is the last line of defense for bulls.
A breakdown below this would validate the bearish structure.
3. Key Resistance Levels
0.1658 → first breakout target.
0.2195 → key resistance above the breakout zone.
0.3074 → major resistance, ideal swing target.
0.5806 → long-term bullish extension if momentum sustains.
---
🚀 Bullish Scenario
Catalyst: confirmed breakout above descending trendline with strong 2D candle close + increased volume.
Additional validation: successful retest of the breakout line showing buyers’ dominance.
Upside targets:
Target 1: 0.1658 (≈ +27%)
Target 2: 0.2195 (≈ +69%)
Target 3: 0.3074 (≈ +137%)
Extended target: 0.5806 (multi-month rally potential).
Bullish strategy: enter on confirmation, take profits gradually, and move stop-loss to breakeven after first target is hit.
---
🐻 Bearish Scenario
Catalyst: breakdown below the yellow support zone (close 2D < 0.12).
Downside targets:
0.09 (≈ -30% from current price).
0.065 (≈ -50%).
Extreme case: retest historical low at 0.0192 (≈ -85%).
Bearish strategy: beware of false breakdowns (long wicks below support quickly reclaimed). Always wait for confirmation.
---
📌 Trading Strategy & Risk Management
Conservative traders: wait for a clear breakout/breakdown confirmation on the 2D timeframe.
Aggressive traders: may play the bounce off support, but must use strict stop-loss just below the yellow zone.
Position sizing: limit risk per trade (1–2% of capital) given the potential volatility once the pattern resolves.
---
📝 Conclusion
COOKIE is at a critical junction. The descending triangle often favors the bears, but in crypto, patterns are frequently invalidated by short squeezes or hidden accumulation. A confirmed breakout could spark a strong rally toward 0.1658 – 0.3074, while a breakdown may drag price below 0.09 and even to 0.065.
Bottom line: COOKIE is in an energy build-up phase. The next breakout or breakdown will likely define the medium-term trend — whether COOKIE becomes a “big winner rally” or continues deeper correction.
---
#COOKIE #CookieDAO #CryptoAnalysis #Altcoins #DescendingTriangle #SupportResistance #TradingStrategy #CryptoTrading #PriceAction
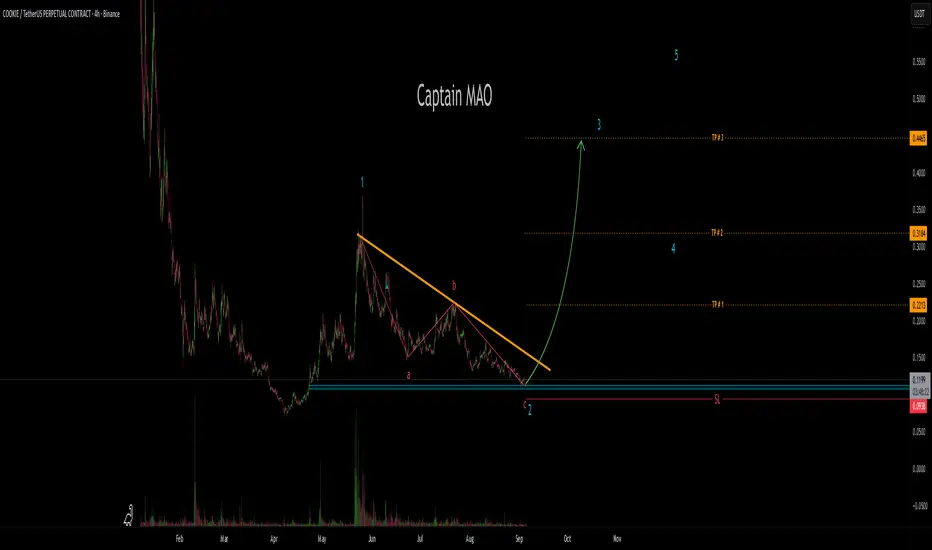
COOKIE/USDT – Wave 3 Setup After ABC CorrectionOver the past 100 days, COOKIE/USDT completed an explosive first wave rally of +300%, confirming strong bullish potential. Since then, price has been in a healthy ABC correction phase, allowing the market to reset and consolidate gains.
Recently, a liquidity sweep and trap has taken place, signaling the final stage of reversal and flushing out weak hands. With the correction phase nearly complete, the structure now points toward the start of Wave 3 typically the strongest and most explosive wave in Elliott Wave theory.
Cookie DAO · The Bullish Wave · Resistance & SupportWe need just one signal here and the market works based on resistance and support. When trading is happening above support, the bulls have the upper-hand, the advantage. When trading is happening below support, the bears have the advantage.
Here we are looking at COOKIEUSDT. The main support is the 3-February low for us. When the action moved below this level, we look for a bottom and reversal pattern. The bottom showed up and the pattern resulted in a cup or inverted triangle. When the action moves back above the 3-February support line the bullish bias is now confirmed.
Now fast forward to present day. COOKIEUSDT produced a retrace after peaking in May and the same support zone was tested. It was challenged for a few days and after suffering briefly, it seems to hold.
Now COOKIE has been green five days moving up. The fact that the action today is happening at the top of the session moving above EMA21 is another positive signal. The day started red and prices actually moved much lower. All the selling was bought and now COOKIE is back green, this signal is double-strong (bullish).
We will see a bullish wave next. Market my words.
Namaste.
COOKIEUSDT Forming Falling WedgeCOOKIEUSDT has recently broken out from a bullish falling wedge pattern on the daily chart, a formation that typically signals a trend reversal and strong upward momentum. The wedge formed after a long consolidation and price compression, which usually results in a breakout supported by increased volume—and that’s exactly what we’re seeing. This breakout now opens the path for a potential move toward a 140% to 150% gain in the near-to-mid term.
The falling wedge breakout is accompanied by rising buying volume, which validates the pattern and confirms growing market interest in COOKIE. Price action has flipped from lower lows to forming higher highs, a technical shift that’s often the early phase of a parabolic move. COOKIEUSDT has established a solid support base, making this breakout structure more reliable for bullish continuation.
Investor sentiment around COOKIE has also been turning positive. With increased attention across crypto communities and favorable positioning on Binance, COOKIE is beginning to draw speculative momentum. The risk-reward ratio remains attractive at current levels, especially considering the technical setup and expected target levels projected around the $0.55–$0.60 zone.
Traders should keep an eye on short-term resistance zones for potential pullbacks and re-entry opportunities. As long as the breakout holds and volume remains strong, COOKIEUSDT could become one of the top-performing mid-cap altcoins in this cycle.
✅ Show your support by hitting the like button and
✅ Leaving a comment below! (What is You opinion about this Coin)
Your feedback and engagement keep me inspired to share more insightful market analysis with you!
COOKIE/USDT on the Verge of a Breakout? Descending Triangle
📊 Complete Technical Analysis
COOKIE/USDT has been forming a classic Descending Triangle since February 2025, indicating prolonged market consolidation. Sellers have been pushing the price down gradually (lower highs), but buyers have strongly defended the horizontal support around $0.16–$0.18.
Now, the price is testing the upper boundary of this structure, signaling a potential explosive breakout.
🔍 Pattern Breakdown
Pattern Name: Descending Triangle
Key Traits:
Lower highs compressing price action
Strong horizontal support zone holding steady
Typically a continuation pattern, but in this case, it can act as a reversal signal if breakout occurs to the upside
Formation Duration: ±6 months
Breakout Confirmation: A daily candle close above ~$0.22 with strong bullish volume
🚀 Bullish Scenario (Upside Breakout)
If COOKIE/USDT successfully breaks above the triangle resistance, here are the potential bullish targets:
Target Price Reason
🎯 Target 1 $0.259 Local resistance zone
🎯 Target 2 $0.299 Key breakout confirmation
🎯 Target 3 $0.407 Measured move from triangle height
🎯 Target 4 $0.626 – $0.700 Historical resistance range
🏁 Final Target $0.842 (ATH Zone) If bullish sentiment fuels momentum
✅ Volume confirmation is crucial. A breakout without strong volume might signal a fakeout.
🛑 Bearish Scenario (Rejection or Breakdown)
On the flip side:
❌ If the price fails to break the triangle resistance (~$0.22) and gets rejected again, we could see a retest of:
Support zone around $0.18
A breakdown below this level could drive the price toward:
$0.140
$0.120
Possibly as low as $0.095 – $0.075 if sentiment worsens
❗ Be cautious of fake breakouts or bear traps near key levels.
📚 Summary & Insights
> The current descending triangle is a textbook setup of “compression under pressure.” If the structure breaks upward with conviction, COOKIE/USDT may enter a powerful bullish trend after months of consolidation.
This setup is ideal for swing traders, breakout traders, or early trend investors seeking solid entries before momentum accelerates.
#COOKIEUSDT #CryptoBreakout #DescendingTriangle #AltcoinAnalysis #BullishReversal #TechnicalAnalysis #TradingView #CryptoTA #AltcoinSetup #ChartPattern
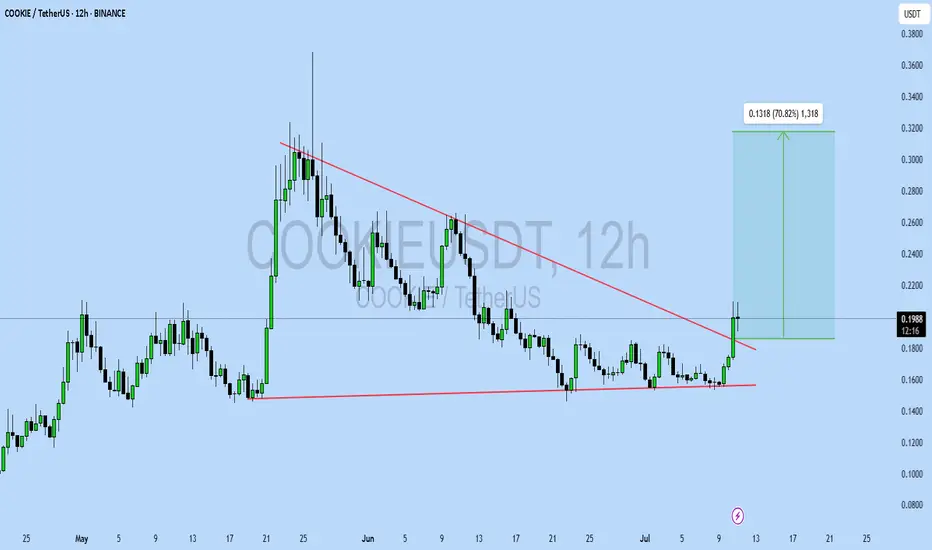
COOKIEUSDT UPDATE
Pattern: Falling Wedge Breakout
Current Price: \$0.1996
Target Price: \$0.32
Target % Gain: 70.82%
Technical Analysis: COOKIE has broken out of a falling wedge pattern on the 12H chart, supported by a strong volume surge. The breakout is confirmed with a close above the trendline, indicating bullish momentum.
Time Frame: 12H