CORNUSD: Bullish Divergence Signals a Potential ReversalCORNUSD is showing signs of a potential bullish reversal after a strong bearish move. Price formed lower lows while RSI showed bullish divergence, suggesting weakening selling momentum. The market then recovered and formed a higher high (HH), indicating a possible shift in market structure.
Price i
Corn - new trend higher?The price action there seems to be strong support 400 and now shot through 450 looking very impulsive.
Could this be the start of a new monthly trend higher this autumn?
Reasons to enter:
- Possible lower crop yields will push up prices and start a new trend higher
- Elliot wave count shows a pos
CORN 1H: Descending Channel Breakout & Seller Liquidity Sweep1. Market Context
On the 1H chart, Corn is compressing near the upper boundary of a major descending channel. After holding a solid double-bottom floor at 447.68 ("Buyer Win") and forming a higher low at 452.00 ("No Buyer"), price is pressing directly against the trendline resistance at 457.12.
2.
CORN - Waiting for the Range Boundary Test!CORN remains range-bound, with price trading between the red resistance area and the blue support zone for an extended period.
Price is currently positioned around the middle of the range, making it less attractive for a trade at current levels. The focus should remain on the two boundaries, where
CORN 1H: Deep Liquidity Sweep & Support Reclaim (Long Setup)1. Market Context
On the 1H chart, Corn crashed through the ascending trendline after triggering multiple "Buyer Lose" liquidations. Price is currently dropping sharply toward the major bottom support floor between 439.86 and 427.37. We wait for the deep sweep into this support zone before entering
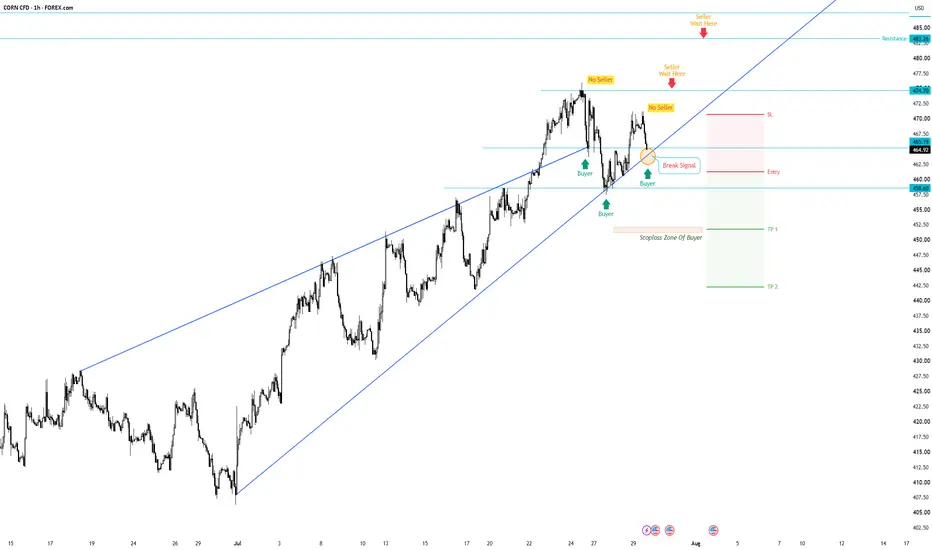
CORN 1H: Ascending Trendline Breakdown & Buyer Liquidity Sweep1. Market Context
On the 1H chart, Corn is trading along a major ascending trendline within an up-channel. The price recently formed a lower high near 471.00 and is now testing the trendline support around 464.92. We wait for a confirmed trendline breakdown to trigger a short setup.
2. Casino / Hou
See all ideas
Displays a symbol's price movements over previous years to identify recurring trends.