CFDs on Corn
No trades
No trades
In-depth trading ideas
๏ปฟCORNUSD: Bullish Divergence Signals a Potential ReversalCORNUSD is showing signs of a potential bullish reversal after a strong bearish move. Price formed lower lows while RSI showed bullish divergence, suggesting weakening selling momentum. The market then recovered and formed a higher high (HH), indicating a possible shift in market structure.
Price is now consolidating near the 4.87 area. I'm watching for bullish confirmation before targeting the 5.00โ5.12 resistance zone.
๐ Key Factors: Bullish RSI Divergence | Market Structure Shift | Potentia
Corn - new trend higher?The price action there seems to be strong support 400 and now shot through 450 looking very impulsive.
Could this be the start of a new monthly trend higher this autumn?
Reasons to enter:
- Possible lower crop yields will push up prices and start a new trend higher
- Elliot wave count shows a possible ABC down has completed.
- Downward pitchfork outer median lines have been breached
- Volume has increased (not shown on this chart)
See here instead:
- Price has support above 200 MA and DEMA
CORN 1H: Descending Channel Breakout & Seller Liquidity Sweep1. Market Context
On the 1H chart, Corn is compressing near the upper boundary of a major descending channel. After holding a solid double-bottom floor at 447.68 ("Buyer Win") and forming a higher low at 452.00 ("No Buyer"), price is pressing directly against the trendline resistance at 457.12.
2. Casino / House Trap Analysis
โข The Trendline Seller Trap: Retail traders have been aggressively shorting every touch of the upper trendline ("Seller"), expecting the downtrend to continue. They have s
CORN - Waiting for the Range Boundary Test!CORN remains range-bound, with price trading between the red resistance area and the blue support zone for an extended period.
Price is currently positioned around the middle of the range, making it less attractive for a trade at current levels. The focus should remain on the two boundaries, where more interesting setups may develop.
โญAs price approaches the red resistance area, we can start looking for sell setups on lower timeframes, while a move toward the blue support area may provide opp
CORN 1H: Deep Liquidity Sweep & Support Reclaim (Long Setup)1. Market Context
On the 1H chart, Corn crashed through the ascending trendline after triggering multiple "Buyer Lose" liquidations. Price is currently dropping sharply toward the major bottom support floor between 439.86 and 427.37. We wait for the deep sweep into this support zone before entering long.
2. Casino / House Trap Analysis
โข The Panic Sell Trap: The House broke the trendline to flush out early buyers ("Buyer Lose") and trick retail traders into opening late short positions at low p
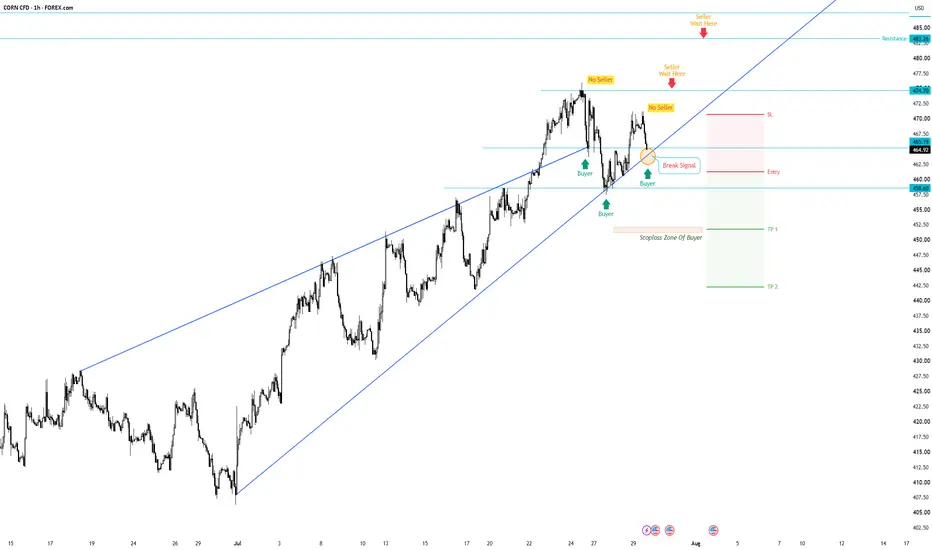
CORN 1H: Ascending Trendline Breakdown & Buyer Liquidity Sweep1. Market Context
On the 1H chart, Corn is trading along a major ascending trendline within an up-channel. The price recently formed a lower high near 471.00 and is now testing the trendline support around 464.92. We wait for a confirmed trendline breakdown to trigger a short setup.
2. Casino / House Trap Analysis
โข The Trendline Buyer Trap: Retail traders keep buying every touch of the ascending trendline ("Buyer"), believing the uptrend will continue. They have stacked a thick layer of stop-l
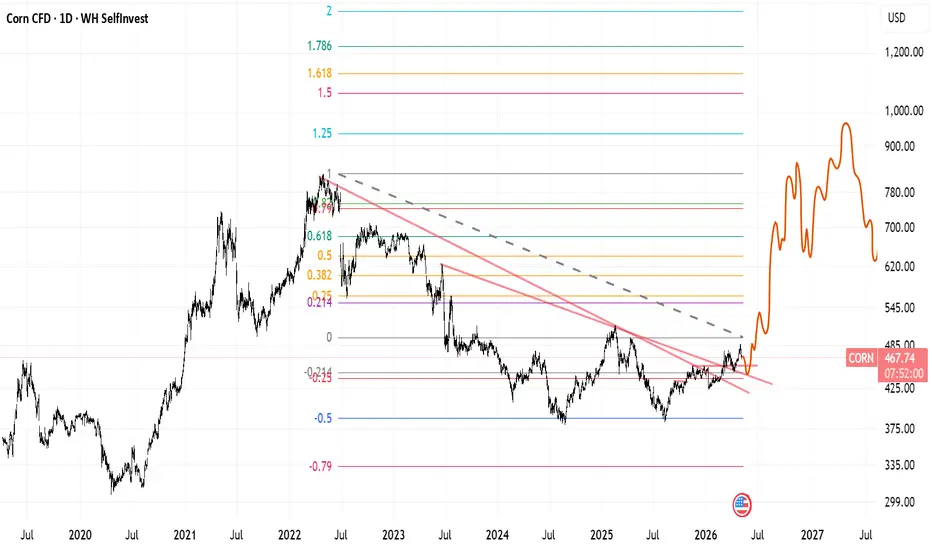
Can Global Food Demand Drive the Next Bullish Cycle๐ฝ Corn (CORN) Daily Analysis | Long-Term Investment Opportunity or Just Another Bounce?
๐ Hello TradingView Family!
I hope you're all doing great and enjoying the markets! โค๏ธ๐
Today we're taking a look at Corn (CORN CFD), one of the world's most strategically important agricultural commodities. While many traders focus only on cryptocurrencies or technology stocks, agricultural markets deserve serious attention because they are directly linked to global food security, inflation, and long-term
$CORN (ZC) โ Weekly Long - STRONG trend reversal๐ TRADE SETUP
โโโโโโโโโโโโโโโโโโโโโโโโโโโโโ
โข Entry: ~$468.55
โข Target: $582.30 (+25.45%)
โข Stop Loss: ~$422.45 (โ8.9%)
โข Risk/Reward: ~2.86R
โข Timeframe: Weekly
โโโโโโโโโโโโโโโโโโโโโโโโโโโโโ
๐ TECHNICAL ANALYSIS
โโโโโโโโโโโโโโโโโโโโโโโโโโโโโ
Price has broken out above a major swing high on the weekly chart with a strong bullish candle. The EMA structure is now fully bullish:
โข 9 EMA (453.30) has crossed above the 21 EMA (445.33) on the weekly chart โ a high-conviction momentum signal
โข Price
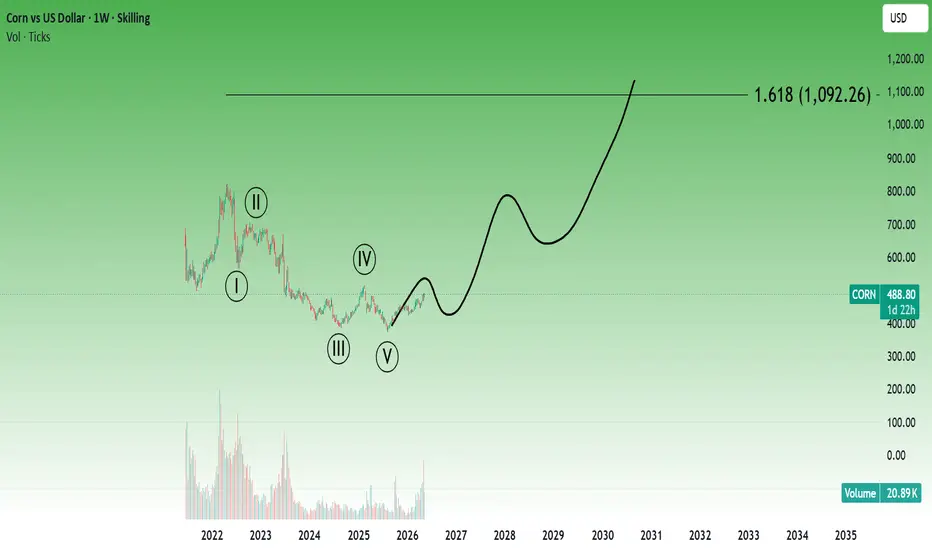
Corn RoadmapAlthough there has been an increase in productivity in corn production in recent years, the downward trend may be replaced by an upward trend in the coming years due to other cost-increasing factors. From a technical perspective, we can say that the price correction movement has been made sufficiently.
* The purpose of my graphic drawings is purely educational.
* What i write here is not an investment advice. Please do your own research before investing in any asset.
* Never take my personal
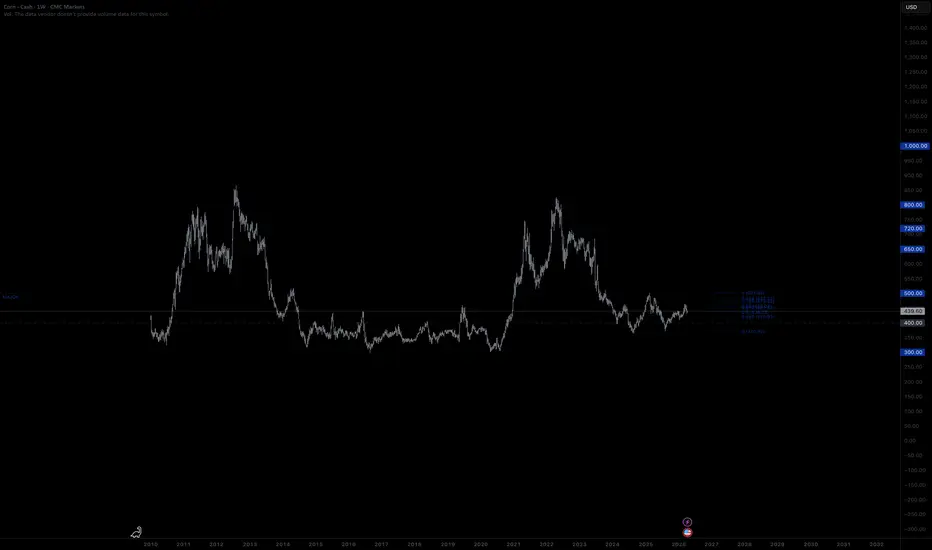
CORN - Near a low possible turning pointCorn has been in a downtrend since the high in May 2022 where the price had been elevated due to Russia invading Ukraine.
Price has been in a range since Aug 2024, oscillating between $380 - $500. Currently in the second wave up, making this a possible correction before the trend reverses down again.
If price can get above $4.80 it might find support and volume around $5,
4 hour chart
30 min chart
Bearish count showing large selling volume around $6-7
CORN Market Outlook: Bullish Trap โ Reversal Opportunity๐๐ MAKE YOU A PROFESSIONAL: CORN Thief Strategy โ The "Layer & Escape" Plan ๐๐
Asset: AMEX:CORN (CBOT Corn Futures / TSXV:ZC ) โ Soft Commodity Profit Pathway
Timeframe: Day Trade / Swing Trade Setup
Current Bias: โ ๏ธ Neutral-to-Bullish (Counter-Trend Bounce Setup) โ Requires Confirmation!
๐บ๏ธ The Professional's Blueprint
Fellow Thief OGs, we are playing the Mean Reversion Heist. After a technical smackdown from channel resistance, price is hovering near a critical vault floor. We aren't chas
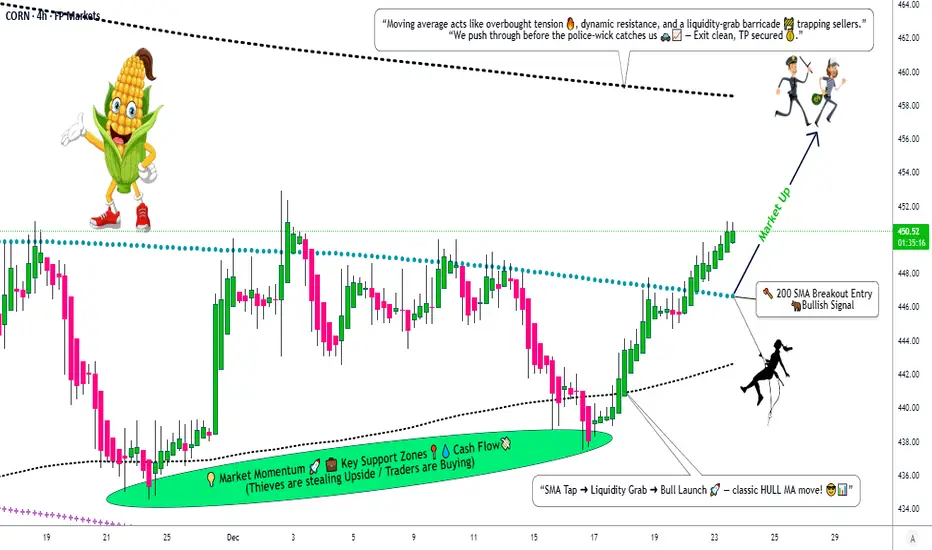
Corn CFD Outlook: Institutional Breakout Setup Explained๐ฝ CORN VS DOLLAR: BULLISH MOMENTUM CONFIRMED | Swing/Day Trade Opportunity
๐ MARKET OVERVIEW
Asset: CORN Futures (ZCH26) / USD
Current Price: $446.40 (Dec 23, 2025)
Market Status: โ
Simple Moving Average Breakout Confirmed
Trade Type: Swing / Day Trade
Signal: ๐ข BULLISH SETUP ACTIVE
๐ฏ TRADE PLAN: "THIEF STRATEGY"
Entry Strategy - Layered Limit Orders (Multiple Entry Points)
The "Thief Strategy" uses multiple limit buy orders to average into positions at different price levels:
Suggested Layer
Cornโฆ ending diagonal or contracting triangle for wave 4? This is setting up for corn to initiate a bottom around the 325-330 area if this scenario plays out. Invalidation would be a push above 5.01. Iโll be watching for a push toward 4.67 to complete a c wave up of a triangle or a (b wave up of a contracting ending diagonal.
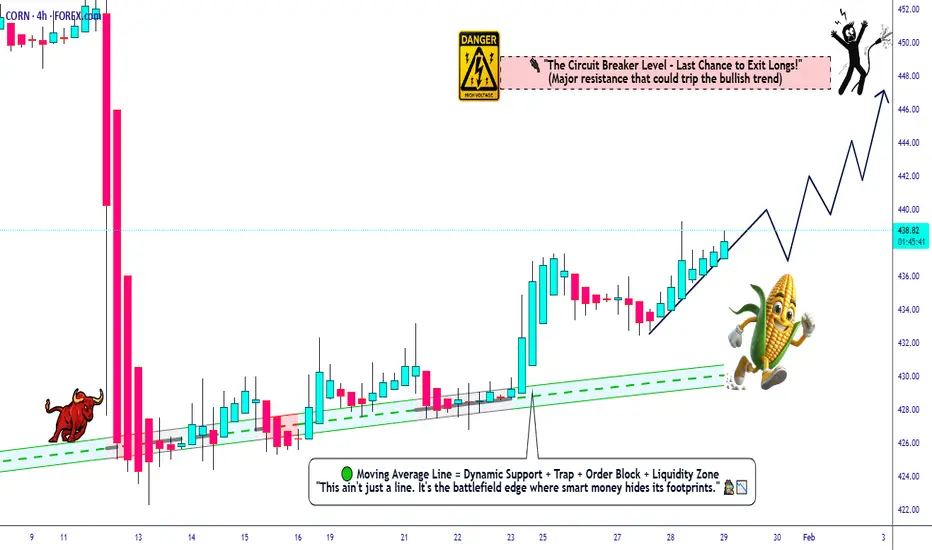
CORN โ Bullish Bias Above Key Moving Averages๐ฝโก CORN CFD | High Voltage Breakout Strategy ๐ (Day/Swing Setup)
๐ฏ TRADE PLAN OVERVIEW
Asset: CORN Futures/CFD (ZC) - Agricultural Commodities Market
Bias: ๐ BULLISH MOMENTUM ACTIVATED - Multiple MA rejections + pullback structure locked in
Strategy Type: Thief's Multi-Layer Limit Entry System ๐ฅท๐ฐ
๐ ENTRY ZONES - THIEF'S STEALTH LADDER METHOD
๐ YOU CAN ENTER AT ANY PRICE LEVEL - But the Thief plays it SMART with layered limits:
Layer 1: 432.00 ๐ฏ (First steal)
Layer 2: 434.00 ๐ฏ (Second steal)
L
CORN Bulls in Control? Retest Pullback Confirms Trend Bias๐ฝ CORN Institutional Edge Plan (Swing/Day Trade Setup)
๐ Market Context
CORN (CFD on US Corn Futures) is showing signs of bullish momentum after testing a key resistance area. Institutional order flow hints at accumulation in the mid-420s region โ a potential pullback zone before continuation higher.
๐งญ Thief Strategy Plan โ Layered Entries
This setup follows the โThief Strategyโ, a layered entry approach using multiple buy limit orders to capture volatility and improve average entry cost.
๐ La
Corn Agro Market Strategy Map โ Bullish Path Ahead!๐๐ฝ CORN Agro Commodities Wealth Strategy Map (Swing/Day Trade)
๐ Plan: Bullish (Swing + Day Trade Setup)
โ
Market sentiment favors bullish bias in CORN.
๐ฏ Swing/Day traders can look for upside continuation until resistance zones.
๐ฏ Entry Plan (Layering Style Method)
๐ You can enter at any price, but pullbacks are safer.
Layered Buy Limit Orders (multi-entry strategy):
๐ข 417
๐ข 420
๐ข 422
๐ข 425
๐ข 427
๐ You can extend or add more layers depending on your personal risk appetite.
๐ก๏ธ Stop Loss (Prot
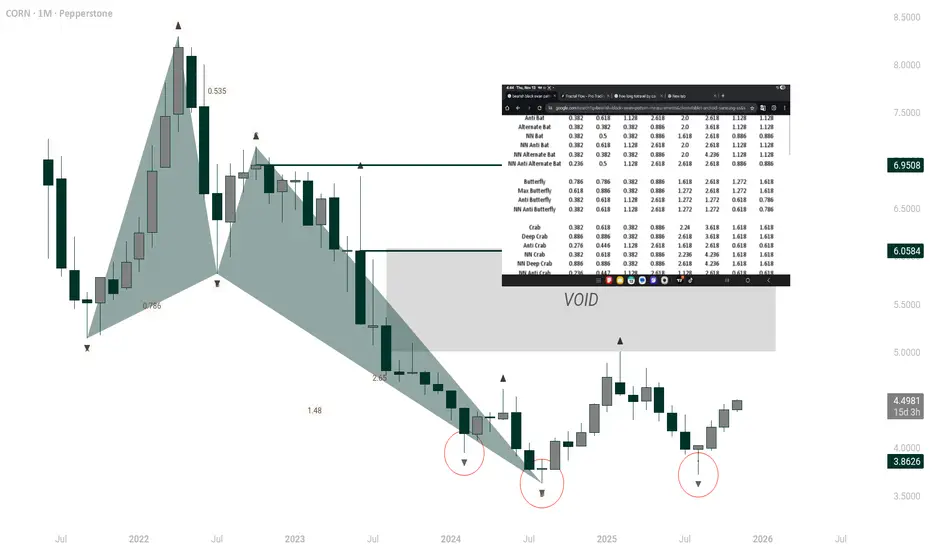
CORN BULLUsing daily market structure and an H4 pattern, alongside, daily CVD divergence I'm convinced corn breaks up towards 4.5 and beyond. THE BIGGER PICTURE which i will show below shows a rather large bullish bat harmonic. I have been long corn from below 3.8. Jump on don't miss the commodity super show.