In-depth trading ideas
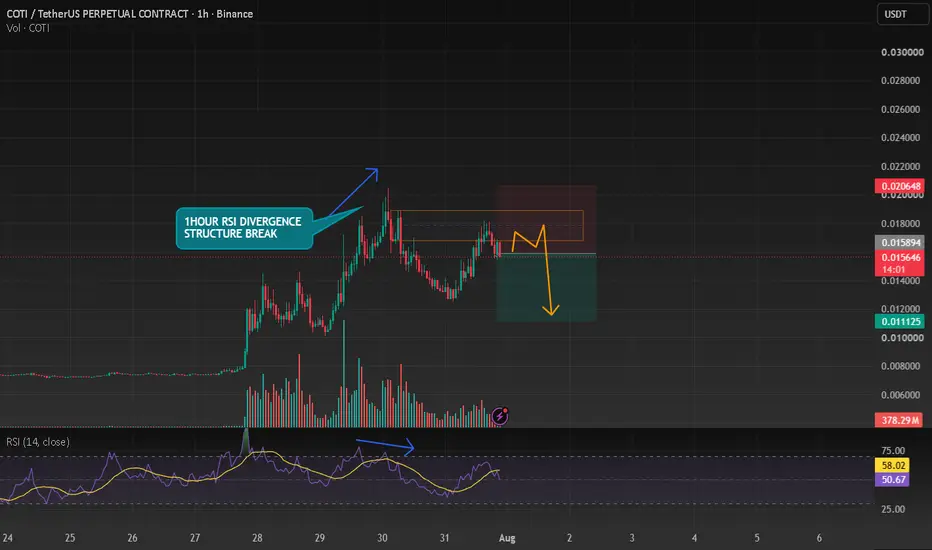
COTI Leads Market Amid Broad SelloffOn 28 July 2026, while major cryptocurrencies declined, CRYPTOCAP:COTI rallied over 63% with more than $102.9 million in trading volume. Analysts noted this as part of a capital rotation into low-cap privacy tokens, with on-chain data showing large holder accumulation coinciding with real usage of its new Privacy Portal. This is bullish for COTI because it demonstrates strong speculative demand and narrative leadership during risk-off periods. However, such violent moves often precede volatility, and the 4-hour RSI reading of 95.55 signals deeply overbought conditions that could lead to a sharp pullback. The COTI Foundation expanded its Privacy Portal on 30 June 2026, adding support for wrapped Ethereum (wETH). This allows users to convert public wETH into private tokens with one click, enabling fully encrypted wallet balances and transactions. This is a positive development for COTI's utility, as it broadens the use cases for its privacy infrastructure and could attract more Ethereum-based assets and users to its network, potentially driving sustained demand for the COTI token. The COTI team announced the planned sunset of its V1 network by the end of Q3 2026. While tokens on major exchanges require no action, users holding COTI or gCOTI in VIPER or specific Ledger wallets must migrate to upgraded contracts. This is a neutral but necessary procedural update. It streamlines the ecosystem towards the newer V2 infrastructure but introduces minor friction for a subset of holders, requiring them to act to avoid complications. COTI's current trajectory is fueled by a potent combination of a technical breakout and growing utility of its privacy products, positioning it as a standout performer. Will the network's on-chain activity and adoption metrics sustain this momentum after the initial speculative surge?
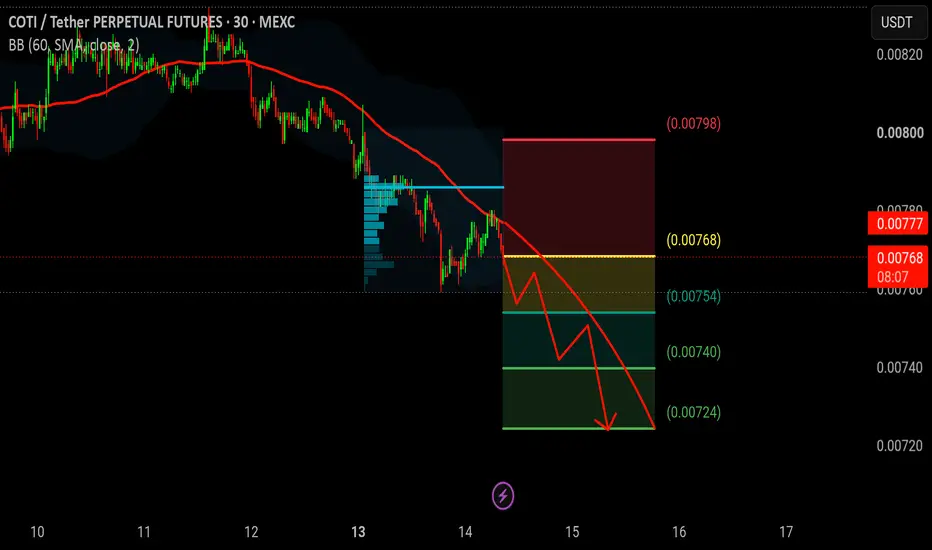
#COTI Possible Scenario Primary Trend: Strong Downtrend.
Analysis: The price action shows a clear, consistent structure of lower highs and lower lows. A sharp decline began around July 12th, followed by a brief consolidation/bear flag pattern around July 13th, which subsequently broke to the downside.
Moving Average Conformation: The price is trading strictly below the BB 60 SMA (the red dynamic line), which is sloping downward, confirming strong bearish momentum.
cotiusdt longInstructions:
Entry point: yellow
Stop loss: red
Take profit: green
👉Leverage x 5-10-20 for crypto
👉Leverage x 20-50-100 for commodities, stocks, indices, and forex
👉Margin 1-5% max.
Always practice risk and money management.
Invest a maximum of 5% on any trade or across all your trades.
Invest only what you can afford to lose, as no one is in control of the market.
👉Our analyses are primarily based on:
breakouts: two trend lines (ascending and descending) and a line indicating a horizontal breakout.
chart patterns: shoulders and head, triangle parttern, elliott impulse, etc etc.
We don't always have the time to track them at all times or to represent them visibly, given the numerous signals, the number of channels to manage, and especially because of the often rapid pace of market movements.
indicators: We associate at least two indicators with this technique.
👉Depending on the circumstances, we use specific indicators, often setting 3 or more take profit levels.
👉Indeed, there are good days in trading and also bad days. No one can promise to win every trade, and like all traders worldwide, we also experience stop-loss orders. However, we win more than we lose and remain positive.
👉You can close the position before or after the take profit orders indicated by the green lines if you are personally satisfied; the same applies to stop loss orders.
👉We must stay positive, clear-headed, and humble.
we cannot provide all instructions or all trades here on this channel.
Good luck to us all, and may God guide us. Amen.
COTI Facing Key Resistance After Relief BounceCOTI is still trading inside a macro descending channel, and the current move looks like a relief rally into resistance rather than a confirmed trend reversal.
After forming a base near the lows, price has pushed up and is now testing a confluence zone:
Descending trendline resistance
Fibonacci 0.5 – 0.618 area
Horizontal supply zone around 0.0155 – 0.0165
What’s happening:
Higher lows forming short term
Price compressing into resistance
Momentum slowing as it approaches supply
Bullish scenario:
A clean breakout and hold above 0.0165 could shift structure and open a move toward 0.019 – 0.021 and after 0.025.
Bearish scenario:
Rejection from this zone is likely, which could send price back toward 0.013 → 0.012 support, and potentially continue within the larger downtrend.
Right now, this is a decision zone, where price is testing strong resistance inside a broader bearish structure.
COTI/USDT — Bear Flag: Potential Continuation to the Downside?On the 1D timeframe, COTI/USDT is still within a larger downtrend structure since its peak. After a sharp decline (flagpole), price is now moving upward gradually in a consolidation phase, forming a Bear Flag pattern.
The current structure shows:
A slow and weak upward movement (flag)
Formed within a small ascending channel (yellow zone)
Still unable to break strong resistance
Price is currently positioned near the upper boundary of the flag, approaching resistance.
---
📐 Pattern Identified: Bear Flag
The Bear Flag is a:
> Bearish Continuation Pattern
Key characteristics:
Starts with a sharp drop (flagpole)
Followed by an upward consolidation (flag)
Typically ends with a breakdown continuing the downtrend
This suggests:
> The current upward movement is likely just a temporary relief before another drop
---
🔵 Bullish Scenario
A bullish case becomes valid if:
Price breaks out and closes above the flag resistance (±0.0160 – 0.0170)
Accompanied by increasing volume
Successful retest (resistance turns into support)
Potential targets:
0.0180 – 0.0200
Possible structural reversal if momentum strengthens
📌 This would signal a Bear Flag invalidation and early reversal potential
---
🔴 Bearish Scenario (Primary Outlook)
A bearish continuation is likely if:
Price breaks down from the lower boundary of the flag (support channel)
Closes below the 0.0130 – 0.0120 area
Downside targets:
0.0120 (minor support)
0.0112 (next support)
0.0103 (previous low / major support)
📉 From a theoretical perspective:
> Bear Flag targets can extend based on the length of the previous flagpole, suggesting deeper downside potential
---
📍 Key Levels
Flag Resistance: 0.0160 – 0.0170
Flag Support: ±0.0130
Key Support: 0.0120 – 0.0112
Major Support: 0.0103
---
⚠️ Key Insight
The broader structure remains bearish
Bear Flag indicates trend continuation to the downside
Current area is a critical decision zone for the next major move
---
🏁 Conclusion
COTI is forming a Bear Flag after a sharp decline, signaling a strong probability of continuing the downtrend.
Traders should:
Watch for a breakdown as a potential short opportunity
Wait for a confirmed breakout if considering a bullish scenario
#COTI #COTIUSDT #CryptoAnalysis #TechnicalAnalysis #Altcoin #BearFlag #BearishContinuation #Breakdown #CryptoTrading #SupportResistance #PriceAction
COTI / USDT Showing Strength — Bullish Move Toward $0.01568COTI / USDT is showing solid momentum and early signs of strength for a potential rally toward the $0.01551 – $0.01568 target zone. As long as price holds above our key support level, the probability of continuation remains high. Avoid blind entries—wait for proper confirmation and manage risk wisely in current market conditions. 🚀
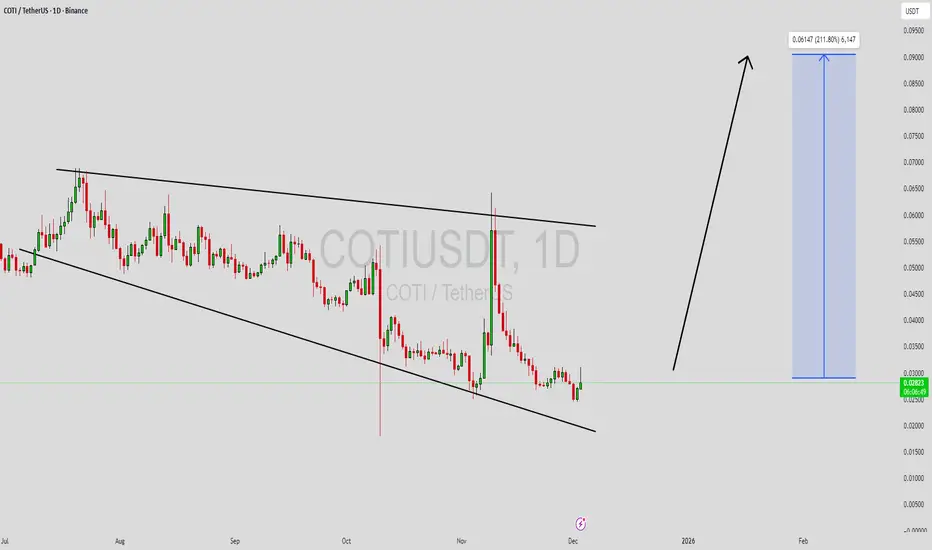
COTIUSDT Forming Falling WedgeCOTIUSDT is forming a clear falling wedge pattern, a classic bullish reversal signal that often indicates an upcoming breakout. The price has been consolidating within a narrowing range, suggesting that selling pressure is weakening while buyers are beginning to regain control. With consistent volume confirming accumulation at lower levels, the setup hints at a potential bullish breakout soon. The projected move could lead to an impressive gain of around 190% to 200% once the price breaks above the wedge resistance.
This falling wedge pattern is typically seen at the end of downtrends or corrective phases, and it represents a potential shift in market sentiment from bearish to bullish. Traders closely watching COTIUSDT are noting the strengthening momentum as it nears a breakout zone. The good trading volume adds confidence to this pattern, showing that market participants are positioning early in anticipation of a reversal.
Investors’ growing interest in COTIUSDT reflects rising confidence in the project’s long-term fundamentals and current technical strength. If the breakout confirms with sustained volume, this could mark the start of a fresh bullish leg. Traders might find this a valuable setup for medium-term gains, especially as the wedge pattern completes and buying momentum accelerates.
✅ Show your support by hitting the like button and
✅ Leaving a comment below! (What is your opinion about this Coin?)
Your feedback and engagement keep me inspired to share more insightful market analysis with you!
COTI/USDT - Smart Money Accumulation or Just a Dead Cat Bounce?After a sharp decline reaching an extreme low around $0.017, COTI has bounced strongly and managed to close back above the key demand zone at $0.047–$0.037.
This yellow zone isn’t just any level — it represents the last stronghold of buyers, a crucial area that has repeatedly held the price since 2021.
Looking closer, the latest weekly candle shows a deep liquidity sweep followed by a massive rejection — a classic sign that big players might have “cleared out stops” and begun stealth accumulation.
---
⚡ Structure & Pattern
Primary trend: Still macro bearish, but a potential double bottom pattern is forming at the major support area.
Momentum: Buyers are showing strength after a strong lower wick rejection from the zone.
Reversal confirmation: A weekly break and close above $0.065 could open the door for a larger rally.
---
🟢 Bullish Scenario
If the price manages to hold above $0.047–$0.037 and break through $0.065, COTI could extend its move upward toward:
🎯 Target 1: $0.090 (weekly resistance)
🎯 Target 2: $0.1855 (psychological resistance & strong supply zone)
🎯 Extended targets: $0.2875 – $0.4670 if strong market momentum and altcoin rotation occur.
The next few weekly candles will be critical in determining whether this is the start of a true macro reversal or just a technical relief bounce.
---
🔴 Bearish Scenario
However, if the price falls back and closes below $0.037, all bullish bias is invalidated.
Such a move could trigger a continuation to the downside toward:
⚠️ $0.018 (previous low and key liquidity zone).
A confirmed breakdown below this main support would indicate that buyers remain weak and the long-term bearish trend continues to dominate.
---
🧩 Pattern Conclusion
COTI is now at a major decision zone.
The $0.047–$0.037 area is a battlefield between buyers and sellers.
If it holds — a potential reversal is on the horizon.
If it breaks — expect another lower low continuation.
---
🔍 Additional Insight
Many major crypto reversals often begin from structures like this:
Strong rejection from multi-year support
Weekly candle with a long lower wick
Gradual increase in accumulation volume
Thus, this zone is not just a technical bounce area — it could mark the early phase of a shift from distribution to accumulation.
---
#COTI #COTIUSDT #CryptoAnalysis #TechnicalAnalysis #AltcoinSetup #SwingTrade #LiquidityHunt #CryptoReversal #SupportZone #CryptoTrading
COTI SHORT1. Chart Context
Pair: COTI/USDT
Timeframe: 1h
Current Price: ≈ 0.03299 USDT
Market has been in a downtrend with lower highs and lower lows. Price recently tested resistance and is now showing rejection.
2. Trade Setup
This is a short position (betting on price to drop).
The red/green rectangle highlights the Risk/Reward (R:R) structure:
Entry Zone: Around 0.0330 USDT (current price, at rejection point).
Stop Loss (SL): 0.03488 USDT (top of the red box).
If price climbs above this level, the short trade setup is invalid.
Take Profit (TP): 0.03043 USDT (bottom of the green box).
Target is a move down into prior support.
3. Risk/Reward Ratio
Risk (SL distance): ~0.0019 USDT
Reward (TP distance): ~0.0026 USDT
R:R ratio ≈ 1.37:1
Moderate setup; reward is larger than risk but not extremely high.
4. Support & Resistance
Resistance Zone: 0.0345–0.0350 (previous rejection area).
Support Zone: 0.0303–0.0305 (green target zone).
The trader expects sellers to defend the resistance and push the price back into the support area.
✅ In summary:
This is a short trade setup on COTI/USDT, where the trader enters around 0.0330, sets a stop at 0.03488, and targets 0.03043. The setup relies on price rejecting resistance and continuing the downtrend toward support.
COTIUSDT Forming Falling WedgeCOTIUSDT is showing a Falling Wedge Pattern, one of the most powerful bullish reversal setups in technical analysis. This formation suggests that the ongoing downtrend may be losing momentum, and a strong bullish breakout could be approaching soon. The narrowing structure of the wedge indicates reduced selling pressure and growing demand as buyers gradually step in. COTI has been consolidating for some time, and this compression phase could soon translate into a sharp upward movement.
The volume remains strong, confirming that accumulation is taking place beneath the surface. Once the price breaks out from the upper resistance of the wedge, traders may witness an explosive rally, potentially delivering gains of 50% to 650%+ in the medium term. This kind of setup often attracts both short-term traders and long-term investors looking to capitalize on a high-risk, high-reward opportunity.
Investor sentiment around COTI is improving as the broader market shows signs of strength. The combination of bullish technicals, solid trading activity, and renewed interest makes COTIUSDT a promising candidate for a major price breakout. Keep a close watch on the breakout zone, as momentum could accelerate quickly once confirmation arrives.
✅ Show your support by hitting the like button and
✅ Leaving a comment below! (What is You opinion about this Coin)
Your feedback and engagement keep me inspired to share more insightful market analysis with you!
COTI/USDT potential 200%+++COTI/USDT potential 200%+++
Buy zone $0.04 - $0.06
Targets given on the chart 200% to 300%
COTI is a fast and light confidentiality layer on Ethereum. Powered by the breakthrough cryptographic protocol Garbled Circuits and secured by Ethereum, COTI introduces the most advanced and compliant solution for data protection on the public blockchain.
COTIUSDT UPDATE#COTI
UPDATE
COTI Technical Setup
Pattern: Bullish Falling Wedge Pattern
Current Price: $0.0541
Target Price: $0.0875
Target % Gain: 65.96%
OTC:COTI is breaking out of a falling wedge on the 1D timeframe. Current price is $0.0541 with a target near $0.0875, showing almost 66% potential upside. The breakout confirms bullish momentum with structure favoring continuation. Always use proper risk management.
Time Frame: 1D
Risk Management Tip: Always use proper risk management.
COTIUSDT 1D#COTI is moving within a symmetrical triangle on the daily chart and is currently facing both the Ichimoku cloud and the triangle resistance. If it breaks out above both, the potential targets are:
🎯 $0.06003
🎯 $0.06563
🎯 $0.07122
🎯 $0.07918
🎯 $0.08932
⚠️ Always remember to use a tight stop-loss and follow proper risk management.
#COTI/USDT - Bottomed out!#COTI
The price is moving within a descending channel on the 1-hour frame, adhering well to it, and is heading for a strong breakout and retest.
We have a bearish trend on the RSI indicator that is about to be broken and retested, which supports the upward breakout.
There is a major support area in green at 0.05325, representing a strong support point.
We are heading for consolidation above the 100 moving average.
Entry price: 0.05390
First target: 0.05480
Second target: 0.05580
Third target: 0.05670
Don't forget a simple matter: capital management.
When you reach the first target, save some money and then change your stop-loss order to an entry order.
For inquiries, please leave a comment.
Thank you.
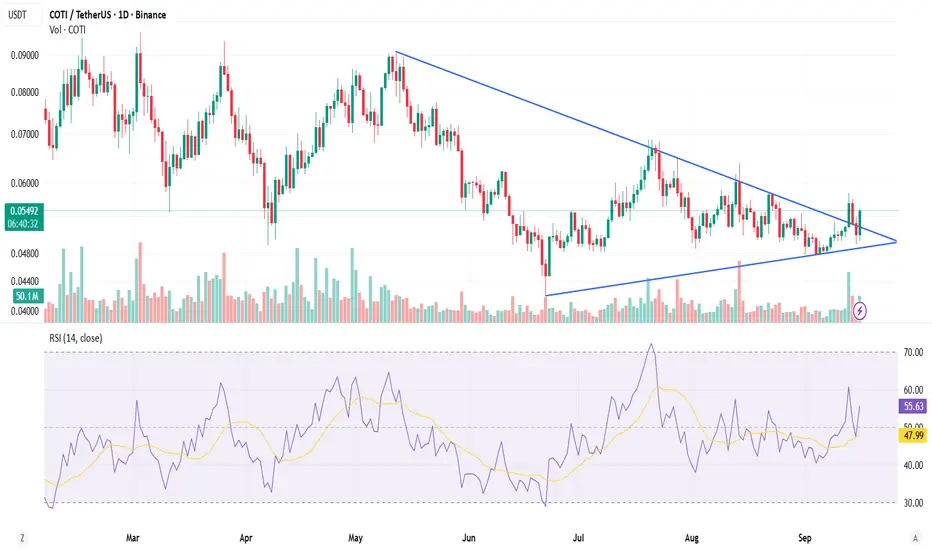
COTI/USDT – Symmetrical Triangle BreakoutCOTI has been consolidating inside a symmetrical triangle for several months, with lower highs and higher lows squeezing the price action.
🔎 Key Observations
Price has now broken out of the triangle resistance with a strong green daily candle.
Volume increased significantly on the breakout, confirming buyer participation.
RSI (14) is at 55.9, trending upward and above the neutral 50 mark, showing improving momentum.
Price is currently trading at $0.0551, above the key breakout zone around $0.052 – $0.053.
📊 Bullish Scenario
Holding above $0.052 keeps the breakout valid.
First resistance: $0.060
Next resistance: $0.070 (major psychological level).
Break and close above $0.070 could open the path toward $0.080 – $0.090.
⚠️ Bearish Scenario
If price falls back below $0.052, it may re-enter the triangle range.
Key supports:
$0.050 – $0.048
$0.045 (triangle base and crucial support)
A breakdown below $0.045 would invalidate the bullish setup.
COTIUSDT - Bottomed out!Many coins have already reached bottom levels, and one of the strongest among them is COTI.
It has formed a symmetrical triangle pattern and is now sitting at one of its lowest levels, which is a strong support zone — buying here is almost like getting it at “nothing.”
COTI is currently gearing up for a historical rally expected to take place in Q4 2025.
Best Regards:
Ceciliones🎯