

In-depth trading ideas

COTI — Long-Term Trendline Breakout & Critical Reclaim Zone!📊 Technical Analysis — ECONOMICS:COTI
⏱ Time Frame: 4D
📌 Pattern: Descending Trendline Breakout + Reclaim/Accumulation Zone
🟨 Key Zone: 0.0152 – 0.0125
---
📐 PATTERN — DESCENDING TRENDLINE
📉 COTI has previously been trading within a long-term downtrend, characterized by a series of lower highs and persistent selling pressure.
🔻 The yellow descending trendline has acted as dynamic resistance throughout the decline. As long as price remained below this trendline, bearish pressure remained t
Long
COTI — A Setup Worth WatchingCOTI is approaching a critical decision point on the daily chart. Price has been developing a Falling Wedge structure after an extended downtrend.
The key level to watch is 0.0205–0.0210. A strong daily close above this resistance, followed by a successful retest, would provide stronger confirmation of a bullish structure breakout.
If confirmed, the next major upside zones could be 0.030 → 0.050 → 0.074.
Invalidation remains below the key structural support.
No FOMO. No emotional entries. Le
Long
COTI/USDT (1h) Approaching a Breakout From a Symmetrical TrianglCOTI/USDT is consolidating inside a symmetrical triangle on the 1H chart after a strong bullish move. Price is forming lower highs beneath descending resistance while maintaining higher lows along the rising support, with the structure now becoming very tight near the apex around $0.0174–$0.0176.
A confirmed breakout and hold above the upper trendline could trigger a bullish continuation toward the $0.0205–$0.0210 measured target area. A breakdown below the rising support would weaken the bulli

COTI Faces Its Biggest Resistance — Breakout or Rejection?📊 Technical Analysis — COTI/USDT
COTI is currently at a critical area on the 4D timeframe, after experiencing a prolonged downtrend from the peak around $0.19. The price structure has formed a series of Lower Highs (LH) and Lower Lows (LL) connected by the yellow Descending Trendline.
However, after reaching a low around $0.00717, the price has started showing a strong recovery and is now approaching the descending trendline again.
🔥 This is a very important area: if the trendline is successf
Long
COTIUSDT Forming Bullish MomentumCOTIUSDT is forming a clear bullish momentum pattern, a classic bullish wave signal that often indicates an upcoming breakout. The price has been consolidating within a narrowing range, suggesting that selling pressure is weakening while buyers are beginning to regain control. With consistent volume confirming accumulation at lower levels, the setup hints at a potential bullish breakout soon. The projected move could lead to an impressive gain of around 90% to 100% once the price breaks above th
Long
COTIUSDT Forming Bullish MomentumCOTIUSDT is forming a clear bullish momentum pattern, a classic bullish wave signal that often indicates an upcoming breakout. The price has been consolidating within a narrowing range, suggesting that selling pressure is weakening while buyers are beginning to regain control. With consistent volume confirming accumulation at lower levels, the setup hints at a potential bullish breakout soon. The projected move could lead to an impressive gain of around 70% to 80% once the price breaks above the
Long
PERFECT SETUP COTI forming 1hour RSI divergence breaking the structure and after that a lower high price reversing from order block enough points to catch the move .................
Short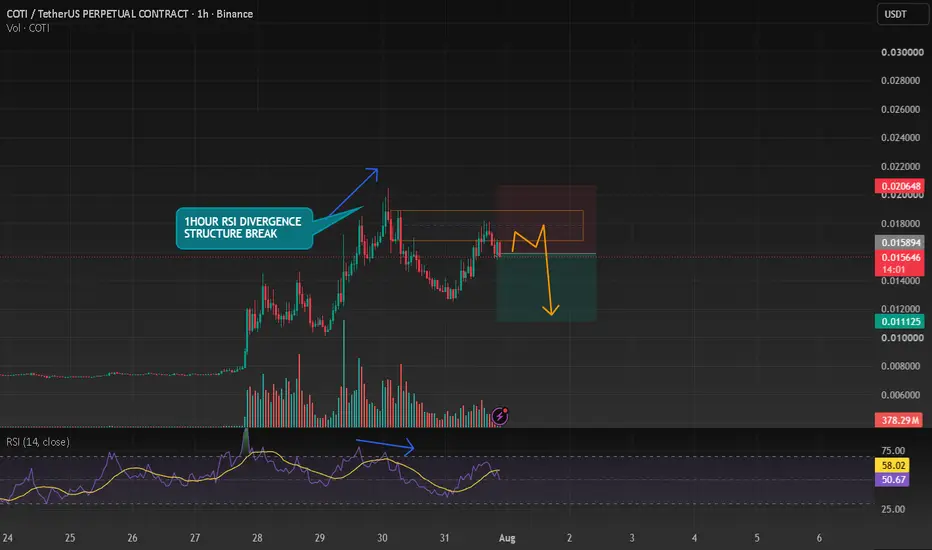
We see more of a move towards previous highs or a re-run of prevWhat do you think about the changes made to the ecosystem of this currency? Are we seeing higher highs or are we returning to more lows?
Is this the same rapid rise and fall?
 Short

COTIUSDT: Potential 30% CorrectionCOTI is showing bearish pressure. If it fails to reclaim resistance and selling continues, a 30% correction could follow.
Watch for lower highs and sell-volume confirmation. This is a market idea, not financial advice.
Short
COTI Leads Market Amid Broad SelloffOn 28 July 2026, while major cryptocurrencies declined, CRYPTOCAP:COTI rallied over 63% with more than $102.9 million in trading volume. Analysts noted this as part of a capital rotation into low-cap privacy tokens, with on-chain data showing large holder accumulation coinciding with real usage of its new Privacy Portal. This is bullish for COTI because it demonstrates strong speculative demand and narrative leadership during risk-off periods. However, such violent moves often precede volatili

COTIUSDT: Potential 30% CorrectionCOTI is showing bearish pressure. If price fails to reclaim resistance and sellers remain in control, a 30% correction could follow.
Watch for lower highs and selling volume for confirmation. This is a market idea, not financial advice.
Short
#COTI Possible Scenario Primary Trend: Strong Downtrend.
Analysis: The price action shows a clear, consistent structure of lower highs and lower lows. A sharp decline began around July 12th, followed by a brief consolidation/bear flag pattern around July 13th, which subsequently broke to the downside.
Moving Average Conformation: The price is trading strictly below the BB 60 SMA (the red dynamic line), which is sloping downward, confirming strong bearish momentum.
Short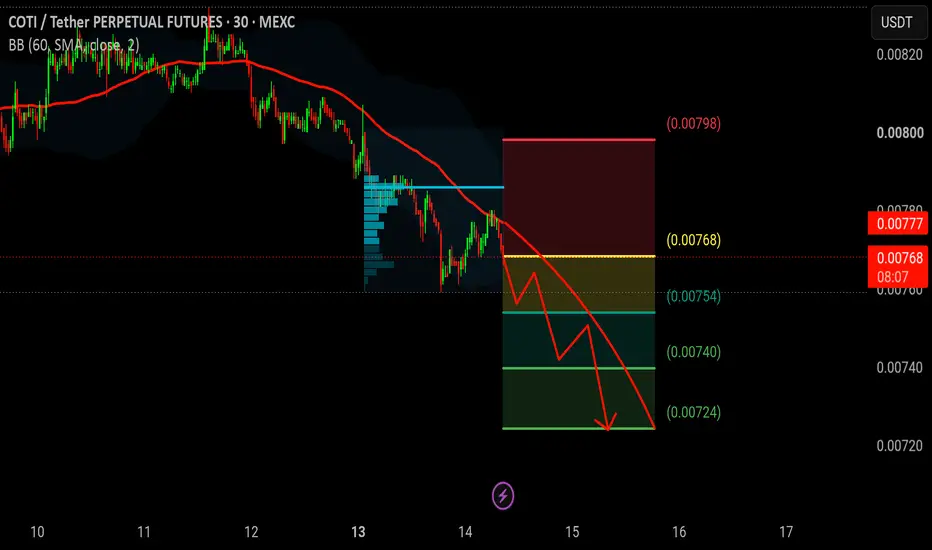
COTI Facing Key Resistance After Relief BounceCOTI is still trading inside a macro descending channel, and the current move looks like a relief rally into resistance rather than a confirmed trend reversal.
After forming a base near the lows, price has pushed up and is now testing a confluence zone:
Descending trendline resistance
Fibonacci 0.5 – 0.618 area
Horizontal supply zone around 0.0155 – 0.0165
What’s happening:
Higher lows forming short term
Price compressing into resistance
Momentum slowing as it approaches supply
Bullish scen

COTI/USDT — Bear Flag: Potential Continuation to the Downside?On the 1D timeframe, COTI/USDT is still within a larger downtrend structure since its peak. After a sharp decline (flagpole), price is now moving upward gradually in a consolidation phase, forming a Bear Flag pattern.
The current structure shows:
A slow and weak upward movement (flag)
Formed within a small ascending channel (yellow zone)
Still unable to break strong resistance
Price is currently positioned near the upper boundary of the flag, approaching resistance.
---
📐 Pattern Identi
 Short

COTI / USDT Showing Strength — Bullish Move Toward $0.01568COTI / USDT is showing solid momentum and early signs of strength for a potential rally toward the $0.01551 – $0.01568 target zone. As long as price holds above our key support level, the probability of continuation remains high. Avoid blind entries—wait for proper confirmation and manage risk wisely in current market conditions. 🚀
Long
COTIUSDT Forming Falling WedgeCOTIUSDT is forming a clear falling wedge pattern, a classic bullish reversal signal that often indicates an upcoming breakout. The price has been consolidating within a narrowing range, suggesting that selling pressure is weakening while buyers are beginning to regain control. With consistent volume confirming accumulation at lower levels, the setup hints at a potential bullish breakout soon. The projected move could lead to an impressive gain of around 190% to 200% once the price breaks above
Long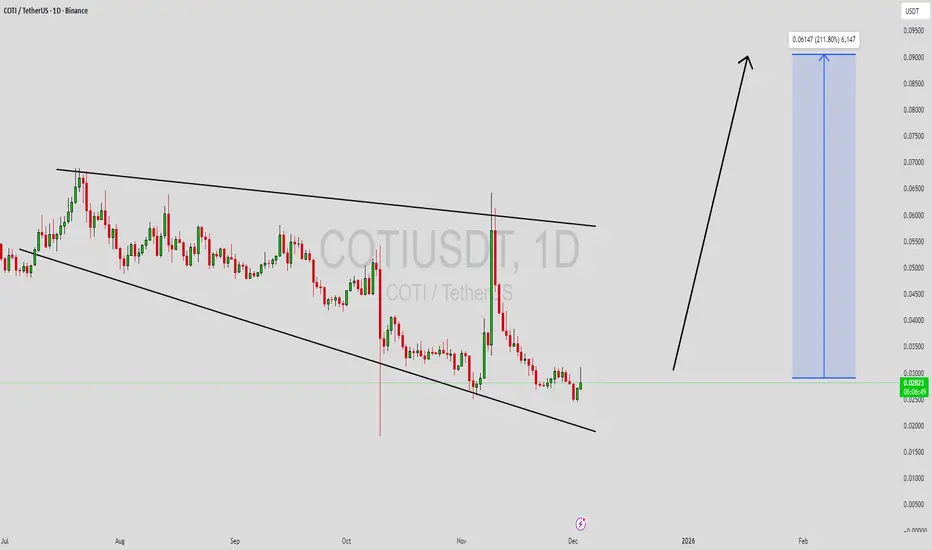
The 0.04154 support level gave wayThe 0.04154 support level gave way, signaling weakness after the reversal attempt. Keeping an eye on 0.03402 as the next major zone for a potential pullback or recovery move.
Short
COTI/USDT - Smart Money Accumulation or Just a Dead Cat Bounce?After a sharp decline reaching an extreme low around $0.017, COTI has bounced strongly and managed to close back above the key demand zone at $0.047–$0.037.
This yellow zone isn’t just any level — it represents the last stronghold of buyers, a crucial area that has repeatedly held the price since 2021.
Looking closer, the latest weekly candle shows a deep liquidity sweep followed by a massive rejection — a classic sign that big players might have “cleared out stops” and begun stealth accumulati
Long
COTI SHORT1. Chart Context
Pair: COTI/USDT
Timeframe: 1h
Current Price: ≈ 0.03299 USDT
Market has been in a downtrend with lower highs and lower lows. Price recently tested resistance and is now showing rejection.
2. Trade Setup
This is a short position (betting on price to drop).
The red/green rectangle highlights the Risk/Reward (R:R) structure:
Entry Zone: Around 0.0330 USDT (current price, at rejection point).
Stop Loss (SL): 0.03488 USDT (top of the red box).
If price climbs above this level, the sho
Short
COTIUSDT Forming Falling WedgeCOTIUSDT is showing a Falling Wedge Pattern, one of the most powerful bullish reversal setups in technical analysis. This formation suggests that the ongoing downtrend may be losing momentum, and a strong bullish breakout could be approaching soon. The narrowing structure of the wedge indicates reduced selling pressure and growing demand as buyers gradually step in. COTI has been consolidating for some time, and this compression phase could soon translate into a sharp upward movement.
The volum
Long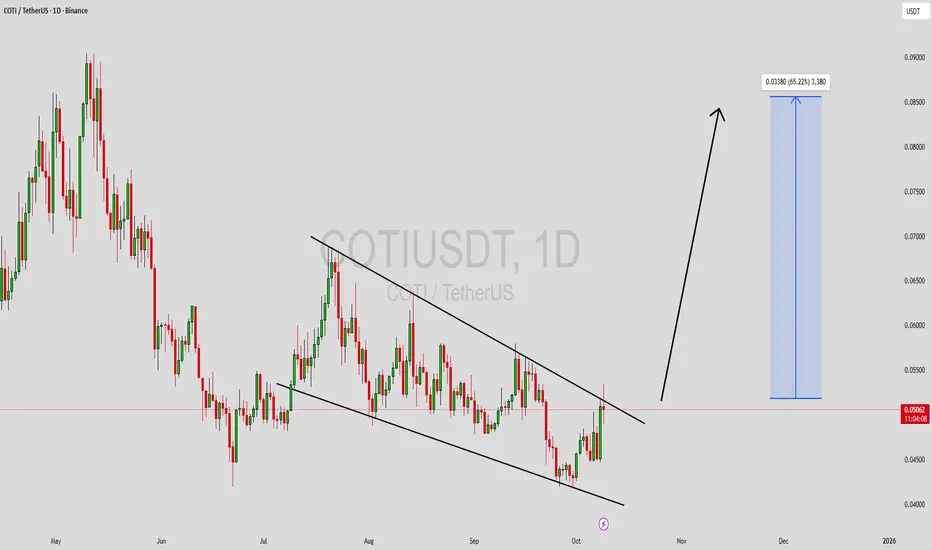
COTI/USDT potential 200%+++COTI/USDT potential 200%+++
Buy zone $0.04 - $0.06
Targets given on the chart 200% to 300%
COTI is a fast and light confidentiality layer on Ethereum. Powered by the breakthrough cryptographic protocol Garbled Circuits and secured by Ethereum, COTI introduces the most advanced and compliant solution for data protection on the public blockchain.
Long
COTIUSDT UPDATE#COTI
UPDATE
COTI Technical Setup
Pattern: Bullish Falling Wedge Pattern
Current Price: $0.0541
Target Price: $0.0875
Target % Gain: 65.96%
OTC:COTI is breaking out of a falling wedge on the 1D timeframe. Current price is $0.0541 with a target near $0.0875, showing almost 66% potential upside. The breakout confirms bullish momentum with structure favoring continuation. Always use proper risk management.
Time Frame: 1D
Risk Management Tip: Always use proper risk management.
Long